NVGate Software overview
Starting the analyser and NVGate
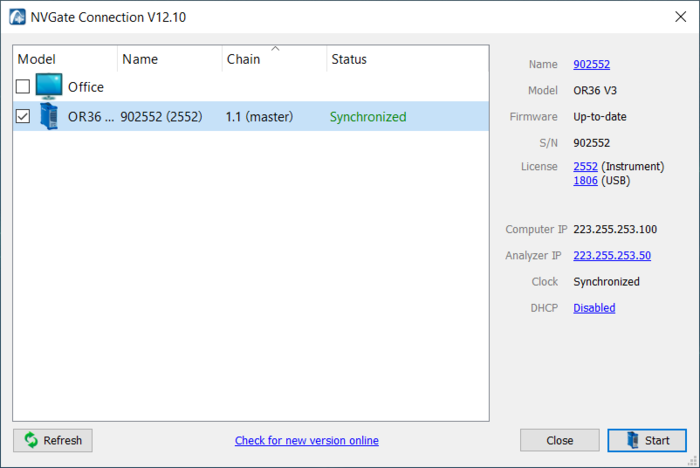
First of all, connect your analyser to the computer and power it on. Then double-click on the NVGate Icon from your desktop. The connection dialog appears. Select operation mode (Connected, Office or multi-instruments).
Select the analyser and click on start.
The NVGate splash screen will automatically appears.
Open/create a project
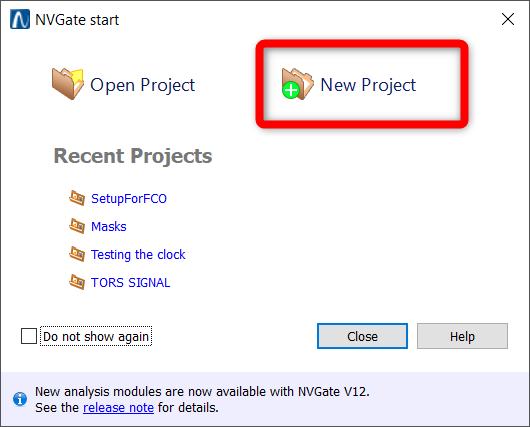
NVGate will start and the Start dialog is proposed:
Here we will create a new project :
This window is also accessible from the NVGate Ribbon.
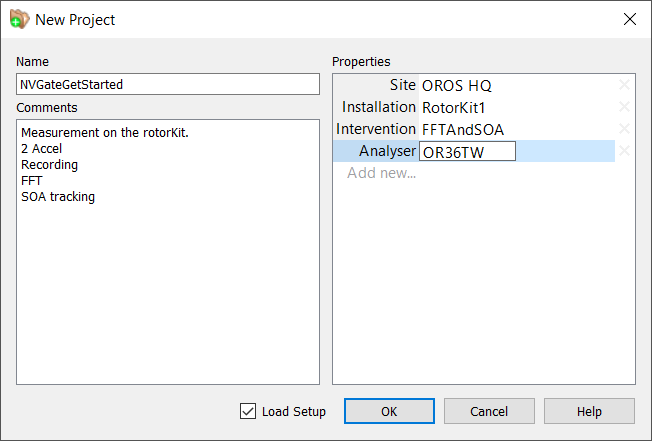
This will open the "New Project" definition window. Fill up the necessary properties and comment to describe the context of this project. Check the Load setup box and click on the Ok button.
Load the configuration
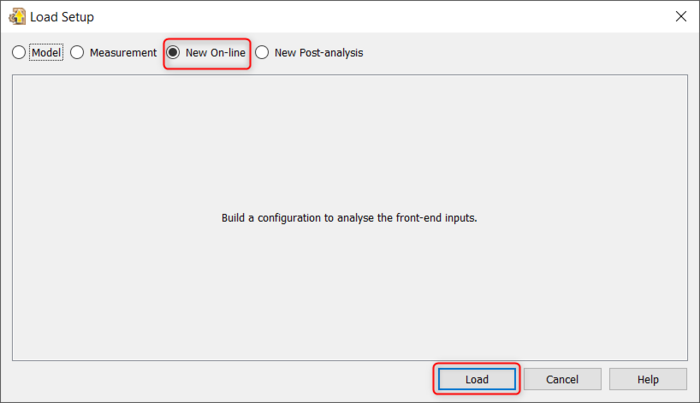
This will open the Load setup window. This window allows you to load the configuration from a pre-saved model, a previous measurement, create a new setup or opening a signal for post-analysis. Here we want to setup a new configuration, we will select New On-Line :
Select the inputs
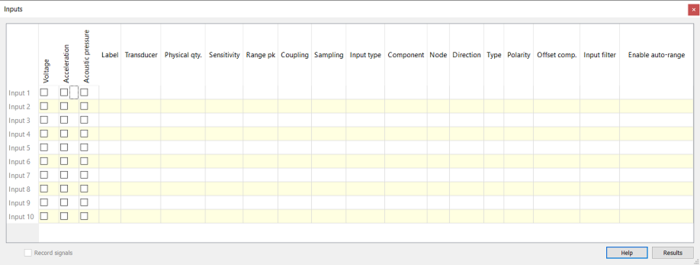
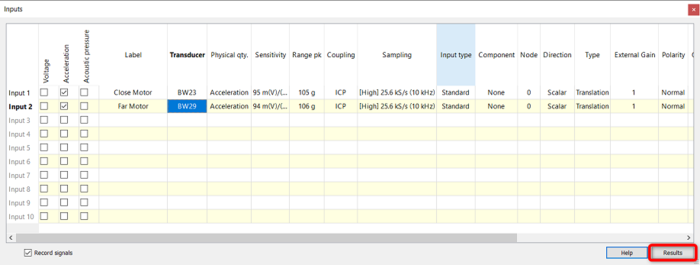
Once you click Load, the input setup window appears :
This window can be called anytime from the GoToResult. See Input selection for the detail of the parameters.
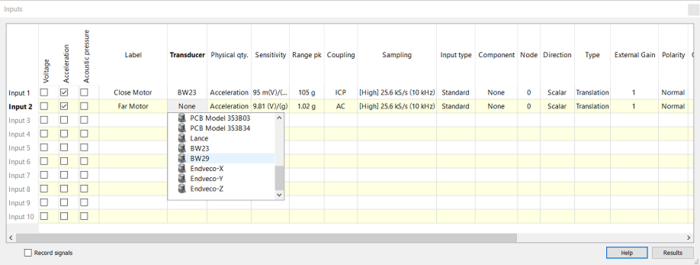
As we use 2 accelerometers, select check the "Acceleration" boxes for inputs 1 and 2, and select the appropriate sensors in the "Transducer" column for each inputs. If you don't see your specific sensors, please fill your transducer database.
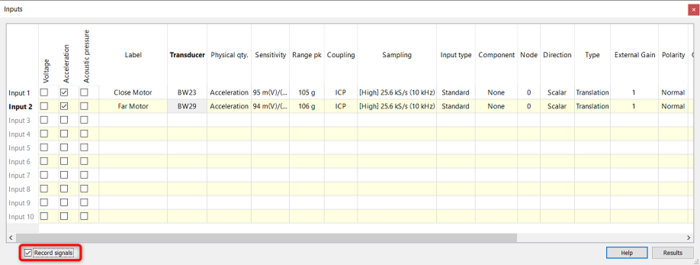
To add the inputs into the recorder, check the Record signals box :
By doing this, any inputs (even if added later) will automatically be connected to the recorder plug-in.
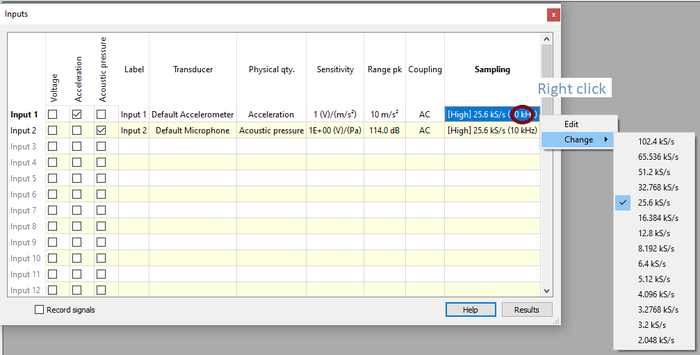
Edit the Sampling Rate
The sampling rate is the rate to which the signals will be sampled by the analyzer. This will define the maximum frequency that can be analyzed during the online analysis or in post-analysis on the recorded signals. However, a higher sampling rate will need more computational power. You may choose a sampling rate that is twice the highest frequency you want to analyze.
To edit the sample rate, do a right click on the sampling case.
Here we have a 25,6kS/sec that allow us to analyze the data up to 10kHz.
Setup the analysis
Once the inputs are correctly declared, click on Results to setup the analysis :
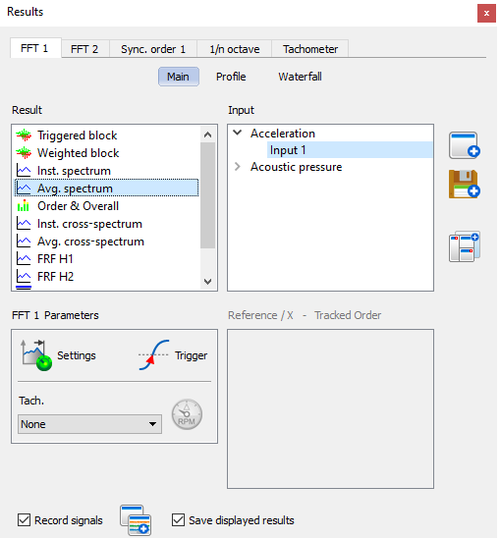
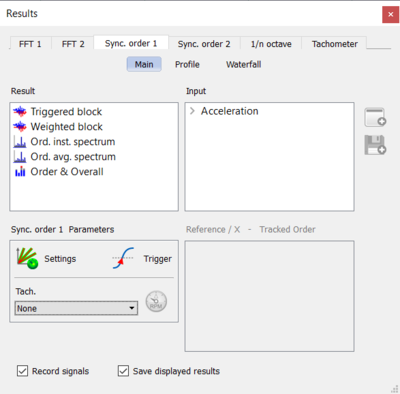
This will open the Results window :
This window can be called anytime from the GoToResult icons. See the Show result section for detail about this window.
Displaying the FFT analysis
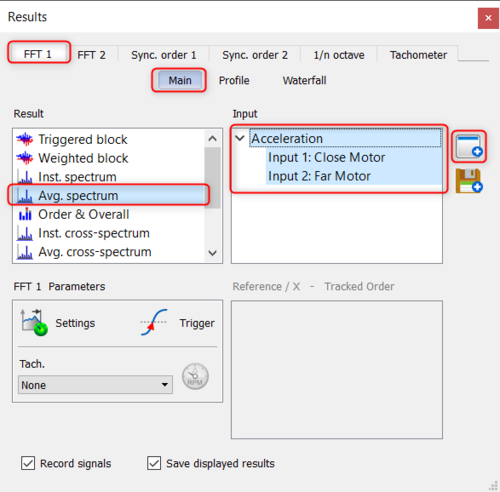
We will now display the average spectrum for the two inputs :
Once you selected the result you want to display, click on ![]() to display the graph in the current layout.
to display the graph in the current layout.
Make sure you checked the box Save displayed results to save the result at the end of the measurement.
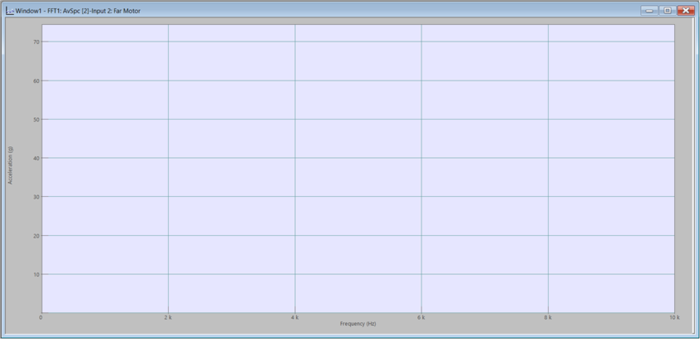
The FFT graph window now appear in the current layout :
.
Setting up the FFT analysis
We can now setup the FFT to optimise the analysis. To access to the setup parameters, click on settings in the Show result window :
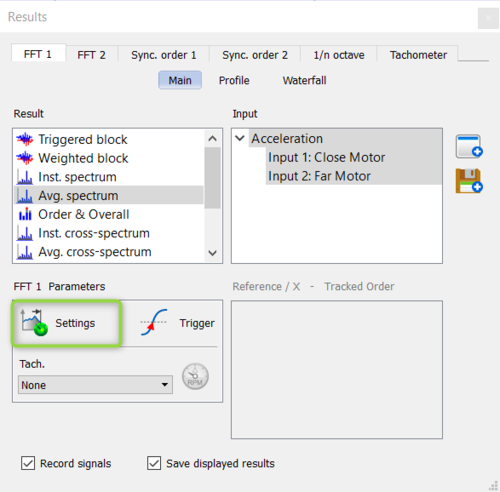
Here, the maximum speed of the motor is 2000RPM. That make the first order at 2000/60 = 33Hz and the tenth order at 330Hz. In order to optimize the computation, we will then limit the FFT bandwidth to 5kHz, the overlap to 67% and the number of lines to 1601 to have a correct precision.
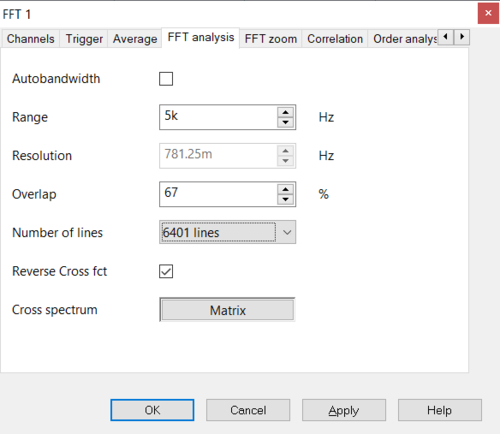
You can then press OK to close this window. For details about the parameters, please visit the NVGate FFT page.
Adding Order Profile
We can now setup and display the order profile. To do this, select the Sync. order 1 tab of the Result window.
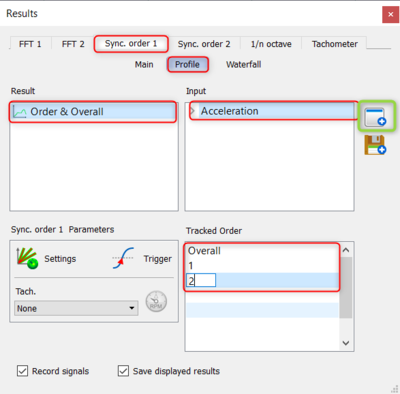
Here, we want to display the first two orders profile for each input. To do so, select the profile tab, and select Order & Overall under Result and Acceleration (that will select the 2 acceleration channels) under input. To track the 2 first orders, you can simply enter 1 and 2 under the Tracked Order section.
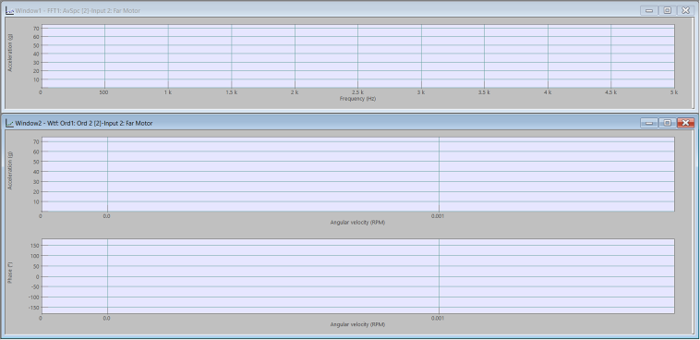
The profile graph is now displayed on the current layout along with the FFT spectrum graph :
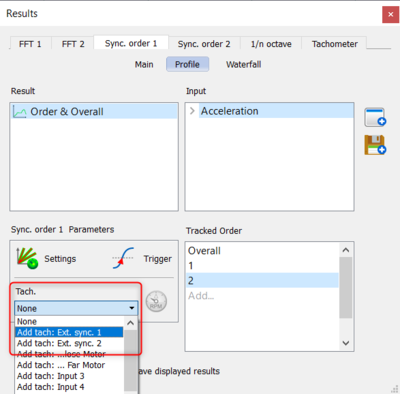
We will now need to add and declare the tachometer. To do so, select Add : Ext. Sync. 1 under Tachometer :
And set the threshold, coupling and Pulse/rev as recommended for your sensor :
Please visit the external sync tachometer page for more details.
Displaying the recorder
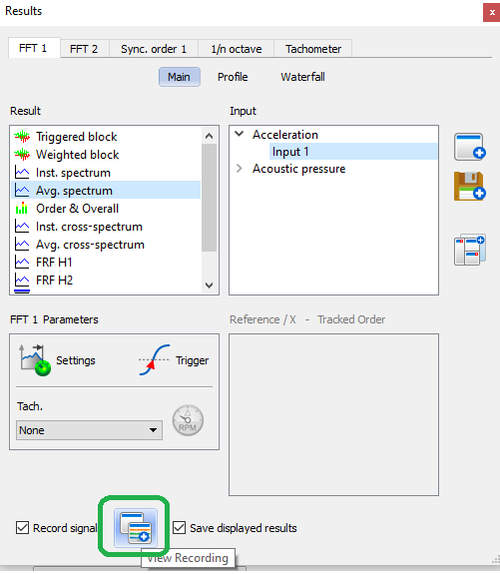
In order to have a complete view of the measurement, you can display the recording of the raw signals by clicking on View recording .
Performing and saving the measurement
We will now perform the measurement during a run-up of the motor. To do so, put the motor at its lowest speed, start the acquisition by clicking on ![]() , and then stop it with
, and then stop it with ![]() once you reached the top speed. You will see the graph updating with the last result.
once you reached the top speed. You will see the graph updating with the last result.
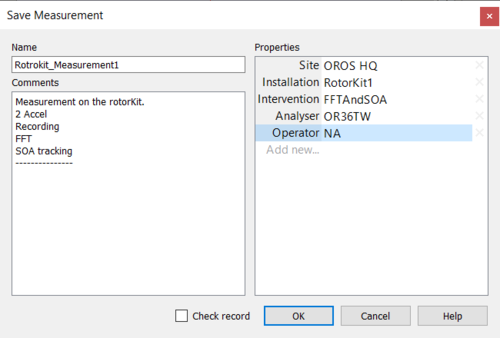
The save measurement window will then be opened. You can fill it with the maximum of information to help ease archiving and the sharing of the data:
Project manager
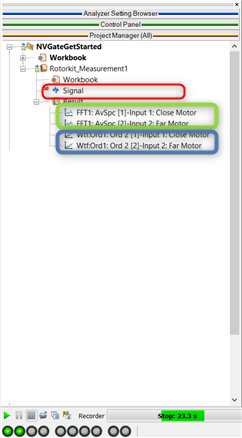
And you can find the saved data under the Project name in the Project Manager :
The red area represents the recorded temporal raw data, the green area the FFT results and the blue area the Order tracking results.
Display
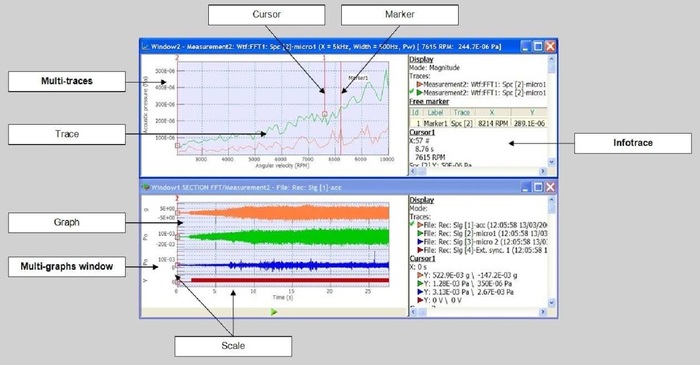
The acquisition is now complete and the results are displayed .
Display overview
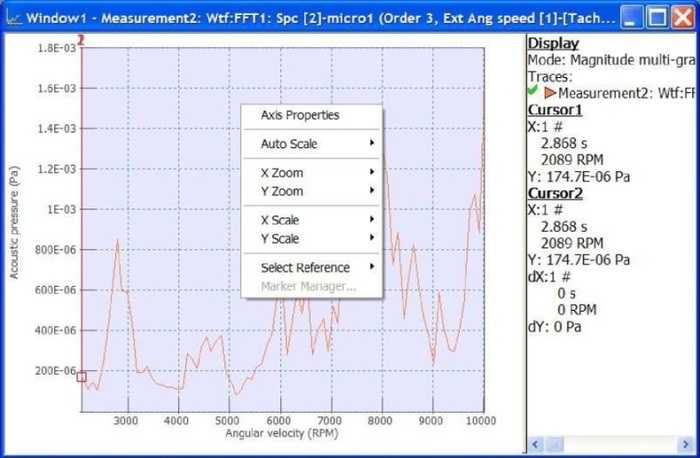
Right click on the graph provides access to the scale, zooms and X/Z axis references of the current graph.
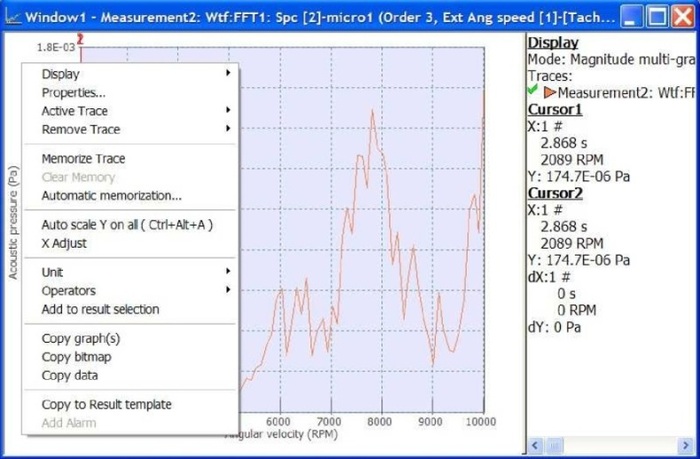
Right click on the window to access the local windows properties and actions on the contained traces.
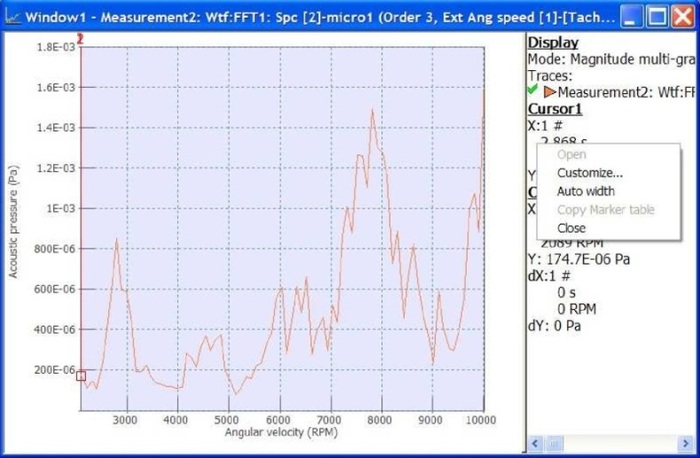
Right click on the infotrace allows customization of the displayed information.
Conclusion
Congratulation you have done you're first measurement with NVGate.
The home tab, let you a quick access to all this settings, and more! :
