NVGate Synchronous Order Analysis
Order analysis is a set of specialized measurement techniques often used when making vibration measurements on rotating machine. With the Order Analysis option, you can make RPM profiles, order tracking and order spectrum.
To make order measurements, you must use a proper tach signal which is synchronized with the rotational speed of the machine.
Outlines
What is Order Tracking?
When doing a measurement on rotating machinery, it is often useful to display a spectrum in the behavior of harmonics or sub harmonics related with the shaft speed.
If the shaft speed varies, each harmonic of the shaft rate needs to appear at a fixed point into the spectrum, so called order.
The basics to make such analysis are to control the sampling rate of the analyzed signals in order to get an equal number of samples independently of the shaft speed.
The classical way uses a tracking ratio synthesizer based on phased locked loop oscillator which generates a constant number of sampling pulses during one shaft revolution. This synthesizer also controls variable cut off frequency of analog anti-aliasing filters. They are adapted to the variable sampling frequency that is itself depending on the frequency bandwidth.
How the OROS Analyzer Works?
Basics
The OROS analyzer is based on a variable digital resampling technique implemented as software in a digital signal processor chip.
This approach gives an improved performance over analog solutions along with reduced hardware cost and reduced complexity.
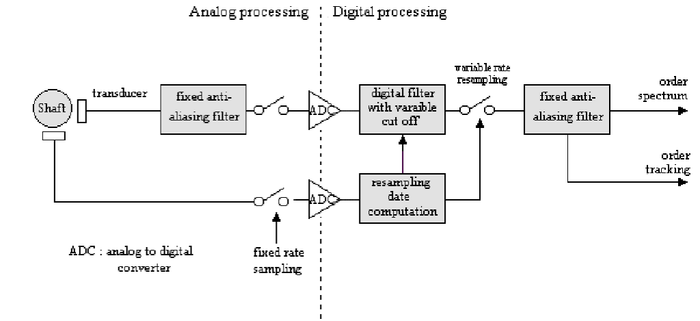
The figure below shows a general block diagram of digital resampling technique.
The signals to be analyzed are sampled at a constant rate with fixed antialiasing filters. These filters have a slope greater than 200dB per octave in the transition band.
The tach signal is sampled and processed in order to compute sampling rate of tach revolution pulses. The arrival time of a tach pulse is computed using interpolation between 2 samples. This tach processing also computes instantaneous speed in order to adjust the cut off frequency of the low pass digital filter used in resampling.
Block diagram of digital order analyzer
After low pass digital filtering, the analyzed signals are resampled and a standard FFT analysis is done.
Resampling date computation
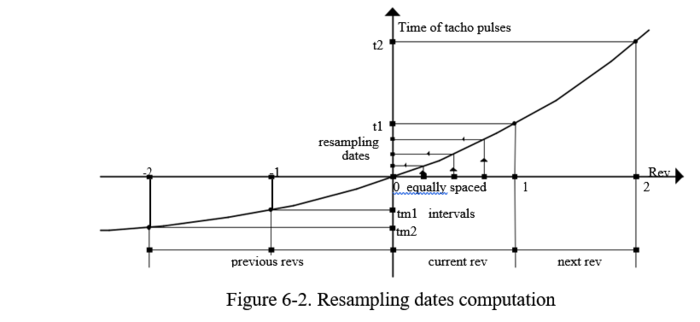
The tach processing first measures date arrival of tach pulses and next computes resampling dates as shown in the figure below:
For a revolution, resampling dates are computed taking into account current rev duration, next one and both preceding ones.
A function of sampling rate versus revolution or shaft position is evaluated and for the current revolution resampling rates are computed for equally spaced shaft positions.
If the number of tach pulses per revolution is not an integer, the tach processing calculates by interpolation the new dates of the tach pulses in order to always have an integer number of revolution for the resampling process.
So using backward and forward tach information gives an accurate evaluation of resampling dates. But this method needs to store signals to be analyzed so that when a tach pulse arrives, the analyzer computes dates of the previous revolution (use of digital signal processors).
This method makes no basic assumption about shaft speed variation profile and compared to other methods, it always gives exact resampling dates at the start and the end of a revolution.
So in case of a large speed variation in a revolution, the analyzer can always deliver valuable spectrums. During implementation the operator can adjust the speed variation threshold over which measurements are automatically rejected.
Signal resampling
The digital resampling of analyzed signals needs a complementary antialiasing filter whose cut off is continuously adjusted to a frequency equal to the product of the maximum analyzed order by instantaneous shaft speed.
The resampling also needs X signal interpolation between samples. The variable filtering and interpolation is based on an OROS proprietary wich is the most accurate and powerful on the market.
Compared to other methods, the OROS one has the main advantage to be able to work with the full available frequency range of the original sampled signal, so the OROS order tracking analyzer is able to work with signals up to 40 kHz with initial sampling at 102.4 kHz.
Signal analysis
The signal analyzer does FFT processing on resampled signal.
This signal is always taken by starting synchronously on a tach revolution pulse in order to be able to deliver absolute phase information of each order.
Sub-ranging order analysis is available with order resolution down to 1/32. In this case the FFT processing is done by using signal corresponding to N consecutive shaft revolutions and so gives a 1/N order resolution.
The angular and spectral averaging are implemented. Angular averaging is necessary when absolute phase resolution and/or rejection of signals unrelated to shaft rotation are needed.
Spectral averaging can compute power spectrums and cross power spectrums with associated results. In this mode, weighting windows are available in order to reduce side lobe effects of signals not related to shaft rotation.
NVGate SOA Plug in
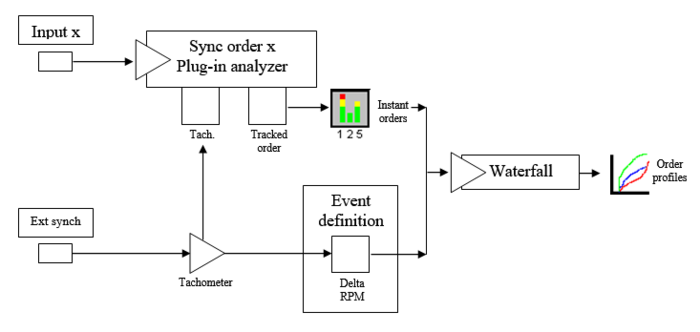
This plug-in is used to perform synchronous order tracking (it is also used to compute time signals in post analysis mode with the Player module).
Set an accurate range peak is advice for more accurate results.
Connect track and display
We advise using GoToResult result Wizard for connecting track and display SOA results.
Available results:
With Resolution being the value of the Synch. order x/Order FFT /Resolution setting:
| Type | Size | Dimension | Domain | Save |
| Filtered signal | 256 pt | 2D | time | Yes |
| Triggered block | (Resolution-1)*2.56 | 2D | angle(rev) | Yes |
| Trigger Shaftview | (Resolution-1)*2,56 | 2D | angle(rev) | Yes |
| DC | 1pt | 1D | Yes | |
| RMS | 1pt | 1D | Yes | |
| Min level | 1pt | 1D | Yes | |
| Max level | 1pt | 1D | Yes | |
| Peak | 1pt | 1D | Yes | |
| Peak-Peak | 1pt | 1D | Yes | |
| Crest Factor | 1pt | 2D | Yes | |
| Avg. block | (Resolution-1)*2.56 | 2D | angle(rev) | Yes |
| Avg. Trigger Shaftview | (Resolution-1)*2,56 | 2D | angle(rev) | Yes |
| Weighted block | (Resolution-1)*2.56 | 2D | angle(rev) | Yes |
| Order spectrum | Resolution | 2D | order | Yes |
| Order inst. spectrum | Resolution | 2D | order | Yes |
| Order avg. spectrum | Resolution | 2D | order | Yes |
| Order & Overall | 1 pt | 1D | Yes | |
| Inst. Order cross-spectrum | Resolution | 2D | order | Yes |
| Avg. order cross-spectrum | Resolution | 2D | order | Yes |
| ORF H1 | Resolution | 2D | order | Yes |
| ORF H2 | Resolution | 2D | order | Yes |
| Order Coherence | Resolution | 2D | order | Yes |
| Order profile | 2048 pt max | 2D | time | Display only |
| Cepstrum* | Resolution | 2D |
Roder | Yes |
| InstCepstrum* | Resolution | 2D | Roder | Yes |
| AvgCepstrum* | Resolution | 2D | Roder | Yes |
| Correlation* | 1/((Resolution-1)*2.56) | 2D | angle(rev) | Yes |
| instCorrelation* | 1/((Resolution-1)*2.56) | 2D | angle(rev) | Yes |
| AvgCorrelation* | 1/((Resolution-1)*2.56) | 2D | angle(rev) | Yes |
| CrossCorrelaion* | 1/((Resolution-1)*2.56) | 2D | angle(rev) | Yes |
| InstCrossCorrelaion* | 1/((Resolution-1)*2.56) | 2D | angle(rev) | Yes |
| AvgCrossCorrelaion* | 1/((Resolution-1)*2.56) | 2D | angle(rev) | Yes |
| Synthesized Orbit | (Resolution-1)*2,56 | 2D | angle(rev) | Yes |
| Raw Orbit | Nb Pulse/rev | 2D | angle(rev) | Yes |
- Filtered signal: This result is available if a filter is selected in the Synch. order x/Channel x/Input filter setting. It displays the input time signal after filtering it.
- Triggered block: This displays the signal after being triggered by the event selected with the Synch. order x/Trigger/Trigger setting .
- Avg. block: This result is available if the value of the Synch. order x/Average/Domain setting is Time. It displays the time signal block average.
- Weighted block: This result displays the signal after being weighted by the weighting window selected with the Synch. order x/Channel x/Weighting window setting.
- Ord spectrum: This result is available if the value of the Synch. order x/Average/Domain setting is Time. It displays the result of the Synchronous order processing results after angular averaging.
- Ord inst. spectrum: This result is available if the value of the Synch. order x/Average/Domain setting is Spectral. It displays the Synchronous order processing results.
- Ord avg. spectrum: This result is available if the value of the Synch. order x/Average/Domain setting is Spectral. It displays the average order instant spectrum results.
- Order & Overall: It displays computation of the orders chosen with the Synch. order x/Channel x/Tracked order setting and the Overall level if the Synch. order x/Overall Analysis/Band power tracking is set to On.
- Inst. Order cross-spectrum: This result is not available if there is no cell checked in the Synch. Order x /Order FFT/Cross spectrum matrix. It displays the instant cross spectrum between the 2 selected channels.
- Avg. cross-spectrum: This result is not available if there is no cell checked in the Synch. orderx /Order FFT/Cross spectrum matrix. It displays the averaged cross spectrum average results.
- ORF H1: This result is not available if there is no cell checked in the matrix of the Synch. Order x /Order FFT/Cross spectrum matrix. It displays the Order Response Response Function H1, see Appendix for details.
- ORF H2: This result is not available if there is no cell checked in the matrix of the Synch. Order x /Order FFT/Cross spectrum matrix. It displays the Order Response Function H2, see Appendix for details.
- Order Coherence: This result is not available if there is no cell checked in the Synch. Order x /Order FFT/Cross spectrum matrix. It displays the ORF H1/H2 ratio.
- Order profile: It displays changes in the Order & Overall result.
- Order AutoCorrelation: This result is available if correlation is selected in the Synch. Order x/Correlation and Synch. Order x x/Average/Domain setting value is Time.
- Order CrossCorrelation: This result is available if correlation is selected in the Synch. Order x/Correlation and Synch. Order x x/Average/Domain setting value is Time. This result is not available if there is no cell checked in the Synch. orderx /Order FFT/Cross spectrum matrix
- Inst. Order AutoCorr: This result is available if correlation is selected in the Synch. Order x/Correlation and Synch. Order x /Average/Domain is Spectral or Frequency synchronous.
- Avg. Order AutoCorr: This result is available if correlation is selected in the Synch. Order x/Correlation and Synch. Order x /Average/Domain is Spectral or Frequency synchronous.
- Inst. Order CrossCorr: This result is available if correlation is selected in the Synch. Order x/Correlation and Synch. Order x x/Average/Domain is Spectral or Frequency synchronous. This result is not available if there is no cell checked in the Synch. Order x /Order FFT/Cross spectrum matrix
- Avg. Order CrossCorr: This result is available if correlation is selected in the Synch. Order x/Correlation and Synch. Order x x/Average/Domain is Spectral or Frequency synchronous. This result is not available if there is no cell checked in the Synch. Order x /Order FFT/Cross spectrum matrix
Settings
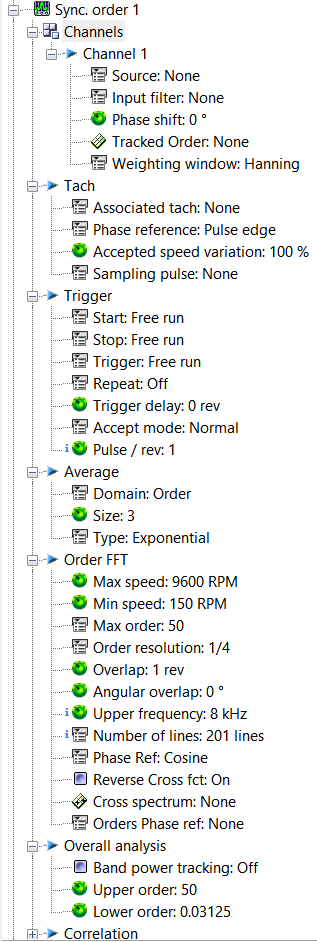
Note: Up to 2 SOA plug-in can be present in the software configuration, each of them running independent analyses on the same or different channels.
Channel
Contains the settings related to the source input.
- Source: Input source to be analyzed. It may come from the Front-end input or from the Player in post analysis mode (see the post analysis chapter). In post analysis mode, only the tracks with the same signal bandwidth can be plugged.
- Input filter: filter to be used for filtering the source before the analysis. The Filters that are not compatible with the upper frequency of the plug-in cannot be selected (see the Filter builder chapter). The A and C weighting on time domain are available in the NVGate® filter list.
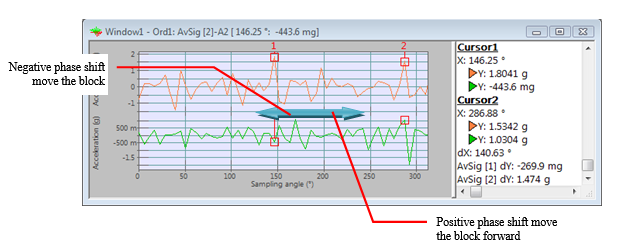
- Phase shift. This setting is independent for each channel and can be change in the range of +/- 720° in order to cover up the cycle duration of 4 stroke engines in both directions (forward/backward).
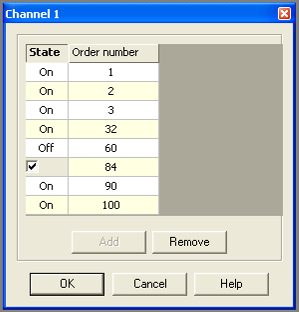
- Tracked order: Orders to be tracked by the Synchronous Order Tracking. You can select up to eight different orders per channel, and there are 2 settings for each order:
- State: ON if you want the order to be computed
- Order number: Select the number of the order you want to track, from 0.001 up to 800
- Weighting window: window used to weight the signal before processing. There are 6 fixed windows: Uniform, Hanning, Hamming, Kaiser Bessel, and Flat top; 3 customized windows: Force, Response (see the Time Windows chapter) For the window characteristics, see the Appendix.
Tach
Contains the Synchronous order analysis tachometer settings.
- Associated tach
 : The selected tachometer enables the plug-in to perform Synchronous Order Tracking.
 - Phase reference: selects the original phase when computing the absolute spectrum phase.
| Phase reference | Description |
| Pulse Edge | The original phase is referenced from the tach edge detection, i.e. the position of the unbalance. It gives the absolute phase. |
| Pulse Center | The spectrum phase is corrected with the phase of the first order of the tach signal (the correction is applied to all the spectrum lines proportionally to the number of lines). This corresponds to the center of the tach pulse. This setting can be used only if the tach signal is analyzed (the source of the tach must be a source of the analyzer). It gives a relative phase. |
For example if the analyzed signal is a pure sine and if this signal is also applied to the tach input (with a threshold of 0 Volt and a positive slope), the measured spectrum phase at the sine frequency is:
Pulse Edge: -90 °
Pulse Center: 0 ° (whatever the threshold level of the tach is)
- Accepted speed variation: Percentage of variation of the tach speed accepted during one revolution. The default value is 100%. It means that this parameter is not taken account.
- Sampling pulse: Select an Ext. Synch input declared as "Sampling". When this setting differ from "none", the angular sampling of the SOA plug-in is based on the actual sampling pulse phase.
The angular sampling allows getting the exact angle (or phase) of the events in the machine cycle. The results are event better using the time domain averaging (i.e. angular).
Please read the sampling page for more info.
Trigger
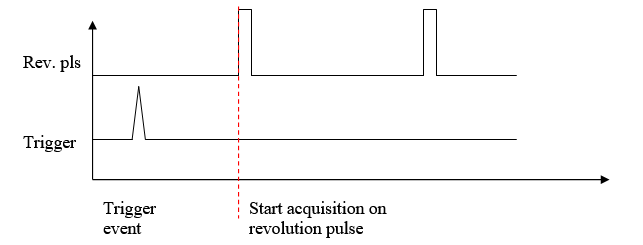
Contains the settings related to triggering events and how to start, and stop signal computation. Note that the trigger is always done on the next available revolution pulse:
- Start: defines the event to start the analysis. The user can choose any event among the list of defined events. By default only the Free run and Manual events are available. The user can define another event in the "Event Definition" shared resources and then use this event for the "Start" condition.
- Stop: defines the event to stop the analysis. The user can choose any event among the list of defined events. By default only the Free run and Manual events are available. The user can define another event in the "Event Definition" shared resources and then use this event for the "Stop" condition.
- Trigger: defines an event to compute the Order Spectrum on one block of time signal. After the computation, the plug-in waits for a new event to compute another block.
Warning: SOA will not start without any tachometer, the SOA will stay in the status ’triggering’.
- Repeat: This setting allows selecting a condition for the plug-in to be restarted. If an event is selected as a Start event, the option New start is available, and when this mode is selected each Start event restarts the plug-in. The mode End of averaging is available when the value of the Sync Order x/Average/Type setting is different from the Exponential mode, it restarts the plug-in when the averaging is finished. It is set to "Off" except for linear average when it is set to "End of averaging". In this case, the "Avg duration" gives the periodicity of the average restart.
- Mode Repeat on ’end of averaging’:
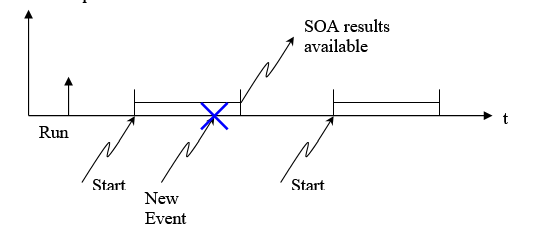
The ’Run’ corresponds to the start of the analyzer. The start is the beginning of average duration. At the end of the first average, the second average will start and so on till the end of the integration time (even if the last short time integration duration is not over). Each averaging has the same size, except the last that can be smaller.
- Mode Repeat on ’New start’:
The ’Run’ trigger the analyzer, but the average begins at the start event (set in the event definition). This averaging stops at the end of average duration or at the stop event. Then the next averaging is waiting for the new start event to occur.
In case a new event occurs during a previous averaging, this start event won’t be effective because the previous average duration is not over, you can only set other event after the end of the previous one.
- Trigger delay: defines a trigger delay in revolution
- Pulse/rev.: defines the number of pulses per revolution of the signal used as trigger source. This setting is available if:
- The SOA is set on spectral averaging
- The "Trigger" event is a "edge detection" event (on analogical or ExtSync channel)
If the setting value is higher than 1, the "Overlap" and the "Overlap in rev" are forced to their maximum and are not modifiable. The overlap between 2 spectra is equal to ((pulse_per_rev-1)/pulse_per_rev) rotations i.e. a delay of 1/pulse_per_rev revolution between 2 spectra. This setting is provided for information only. It is modifiable in the trigger source settings.
- Accept mode: selects the method of rejecting signal blocks.
| Mode | Description |
| Normal | All blocks are accepted |
| Overload rejection | Blocks with an overload are automatically rejected |
Average
Contains the settings related to the type of averaging of the signals to be computed.
- Domain
 : You can chose between Spectral and Angular: the spectral domain averaging computes the average after Order spectrum processing, while angular averaging the average before Order spectrum processing.
 - Size: The number of signal blocks used to compute the average, from 1 up to 1000000000.
- Type: The method of averaging the signal. There are four different averaging modes: Linear, Exponential, Peak hold, and Referenced Peak hold.
| Type | Description |
| Linear | Linear averaging of results is carried out on the value of the Size setting from the same sub-module. The plug-in automatically stops when the given number of averages is reached. |
| Exponential | In this mode of computation, each new average is obtained by adding its previous value the new Order spectrum result divided by the value of the Size setting, and subtracting its previous value divided by the value of the Size setting too. |
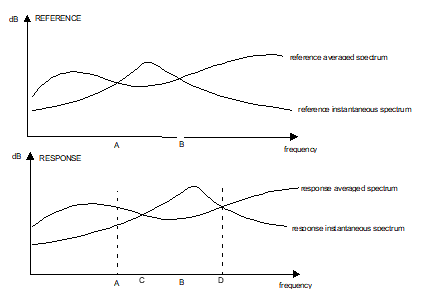
| Peak hold | This method processes the peaks found in their spectrum power density for each channel, and for a number of Order spectrum analysis determined by the size setting. The plug-in automatically stops when a given number of averages is reached. For each order line, each time the value of the instantaneous spectrum is greater than the value of the average order spectrum, the average order spectrum value is equal to the instantaneous order spectrum value. Otherwise, the average order spectrum value is not modified. |
| Ref Peak hold |
|
Hidden/fixed: Peak hold and Referenced Peak hold are only available if the Domain setting from the same sub-module is set to Spectral.
- Reference channel: channel to be used as a reference in Referenced Peak hold averaging mode. You can choose between the channels that are plugged into the plug-in. If None is selected, the average processing is the same as the Peak hold mode.
Hidden/fixed: This setting is only available when the Referenced Peak hold averaging mode is selected.
Order FFT
Transforms the order blocks into order spectra.
- Max speed: defines the highest angular speed accepted. All revolutions with a speed higher than Max speed are rejected by the analysis.
The Max speed value is given by:
Max speed (RPM) = Frequency Range (Hz) / Max Order * 60
If a tach is connected to this plug-in, the max speed value is forced to the value defined in tachometer properties.
To know more, see § 1.4.2.1 tachometer /tachs.
The SOA Upper frequency is limited by the High sampling of the front-end or by the Max bandwidth of the Player in post-analysis.
- Min speed: defines the lowest measured angular speed accepted. All revolutions with a speed lower than Min speed are rejected by the analysis.
The RPM velocity dynamic is defined by:
Max Speed / Min Speed = 64
- Max order
 : defines the highest order that can be computed. Range from 6,25 to 800.
 - Order resolution
 :: Defines the resolution of the Order spectra. Resolution = Max order / Number of lines
Available resolutions are: 1, ½, ¼, 1/8, 1/16 and 1/32 of order
- Overlap: defines the amount of overlap of blocks of signal between 2 successive Order FFT computations expressed in revolutions, from 0 to 1/Order resolution For example: if Order resolution setting is 1/8, then Overlap range is from 0 to 7.
- Angular Overlap: defines the overlap (in angle) corresponding to a rotation fraction. This setting is comprised between 0 and 1 rotation-SOA angular resolution with one rotation equal to 2*PI or 360° depending on the physical quantity used for the angle. The resolution (in radian) is equal to 2*PI/number of samples per rotation (=(number of lines -1)*2.56*order resolution). This setting is only available for a spectral averaging mode (in time domain it is forced to 0 and it is not modifiable). To have the maximal overlap when the resolution is <1, the "Overlap" and the "Overlap in rev" must be at their maximum.
- Upper frequency: The Upper frequency that can be processed by the plug-in. It depends on two settings: Max speed setting and Max order setting. If Max speed is in RPM you have the formula: Upper Frequency = MaxOrder * (MaxSpeed/60). For example Max speed = 770 RPM, Max Order = 100 then Upper Frequency = 100* (770/60) = 1283.333 Hz
Hidden/fixed: fixed
- Resolution: The number of lines computed by the Order FFT: this depends on two settings: Max order setting and Order resolution setting. Resolution = (MaxOrder / OrderResolution) + 1. For example: if Max order = 50 and Order resolution = 1/8, then Resolution = 50 * 8 + 1= 401 lines.
Hidden/fixed: fixed
- Phase Ref: The phase reference for the computation of the Order FFT
| Phase reference | |
| Cosine | Default value |
| Sine | Leads to a +90° phase Offset |
- Reverse cross function: this setting allows calculating the cross function of the greyed part of the Cross spectrum setting. Default value is True except on cascaded mode (multiple hardware) as the number of reference spectrum to be carried between the analyzers may lead to a dramatic loss of performances.
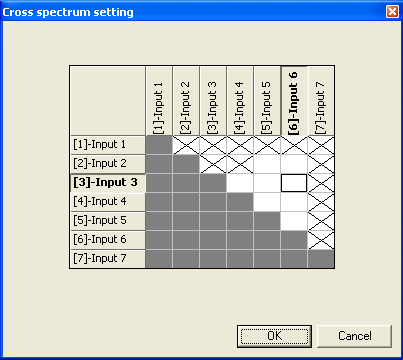
- Cross spectrum: Matrix used for the selection of the computed cross spectra. Only the upper half of the matrix can be used; when a box is checked, two cross spectra are computed with each of both channels being the reference. Selecting the cross spectra is necessary to have access to some results: instant order cross spectrum, order average cross spectrum, ORF H1, ORF H2 and Order coherence.
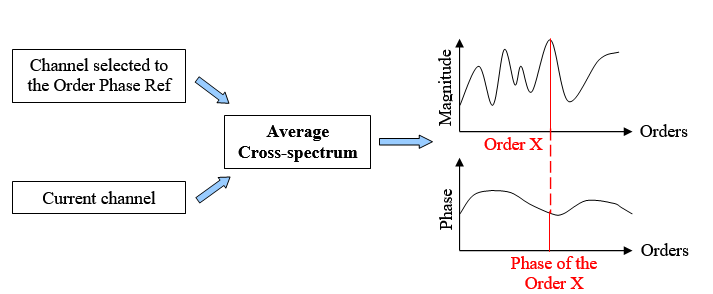
- Orders Phase ref: This function allows you to use the cross-spectrum phase value for the phase of the order (relative phase). The cross-spectrum phase is the relative phase between the input signal of the current channel and the reference input signal associated to this channel. Whatever the average mode, the average cross-spectrum is always used to calculate the orders phase.
- No activated: The phase of the order is the spectrum phase of the frequency corresponding to the order value (absolute phase).
To know more, see §1.5.2.2 Ext Syncs/Tach/Phase Ref p1-115.
- Activated: choose the channel used to calculate the orders phase.
If a channel is selected, ’Phase Ref’ in SOA/Tach is not activated.
Note: This set up doesn’t change the spectrum phases and consequently doesn’t change the orders phases extracted from a waterfall of spectra.
- Range: Frequency range of the plug-in, set automatically in order to process the Sync Order x/Order FFT/Upper frequency value. For optimum performance, the Front End/Input sampling setting value should be close to the value of the Range setting multiplied by 2.56. For example: for a Range value of 20kHz, the input sampling should be 20000*2.56 = 51.2kS/s.
Hidden/fixed: fixed
Overall analysis
Calculation of the order bands sum.
- Band 'power tracking': Switches computation of the overall level result "on or off".
- Lower Order: Specifies the lower order of the overall computation order range
- Upper Order: Specifies the upper order of the overall computation order range
Correlation
Calculation of the Auto Correlation and the Cross Correlation in the angle domain.
- Correlation: Allows to activate or not the calculation of the correlation.
All results of the correlation are in the angle domain with –T/2 et T/2 where T equal to the duration of the trigger block of the FFT.
- Weighting window: Choose between following values of this setting:
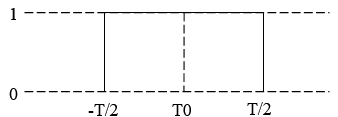
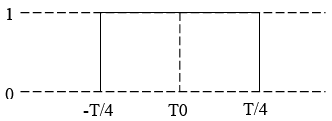
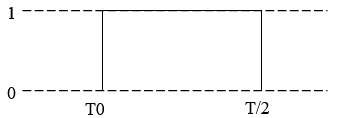
Three types of correlation window are available:
Uniform [-T/2, T/2] (where T is the trigger block length): All the window coefficients are equal to 1. For best results with the Uniform weight window, you should use signal sources that are self-windowing, such as transients, burst, and periodic waveforms (signal period must be a multiple of the weight window length). In order to have the trigger point (T0) at the center of the time trigger block, the trigger Delay must be set to –T/2.
Centered Zero Padding [-T/4, T/4] (where T is the trigger block length): Only the central part of the window (representing the half-length) is not null. This weight window must be used with random noise. In order to have the trigger point (T0) at the center of the time trigger block, the trigger Delay must be set to –T/4 (where T is the trigger block length)
Left Zero Padding [0, T/2] (where T is the trigger block length): Only the first half of the window is not null. This weight window must be used with random noise. In order to have the trigger point (T0) at the beginning of the time trigger block, the trigger Delay must be set to 0.
If the correlation is activated then all results of the SAO will be affected by the weighting windows of the correlation. When the Correlation setting is deactivated the weighting windows by default (Hanning) is applied on all SOA plug-in. inputs
Notes: Results from the correlation are normalized.
Considerations to obtain good results when making correlation measurement.
- Use input AC coupling. Both auto correlation and cross correlation are disturbed by DC offset in the input signal.
- Use appropriate trigger mode and trigger delay. The trigger mode should be different from free run. The trigger Delay must be set to –T/2 (where T is the time signal block length) with the Uniform and Centered Zero Padding correlation weighted window (and 0 for the Left Zero Padding window). But in some cases, especially with the Centered Zero Padding and Left Zero Padding window (as these function types attenuate parts of the trigger signal block), the trigger Delay must be adjusted to position the input signal with respect to time.
SOA Status
All statuses are available to add to the control panel
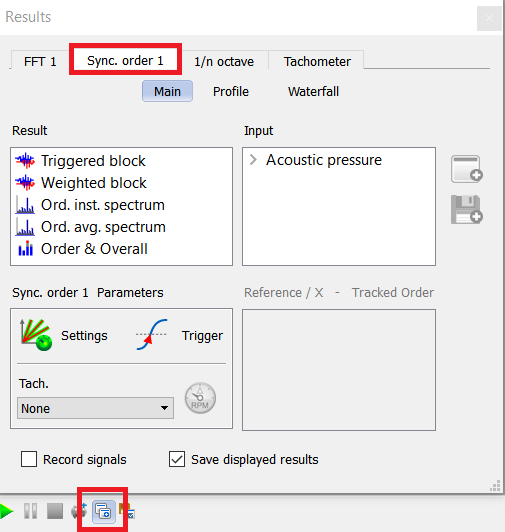
Sync. Order x
The current plug-in status is synthesized in a special progress-bar. This progress bar is automatically displayed in the ’control panel’ when the plug-in is active (i.e. as soon as at least 1 input is connected to the Sync Order plug-in). This status is called ’Sync. Order x’ (x is 1 or 2) and it is available in the status ASB tree (see customize control panel).
This setting displays the averaging count (i.e. a current analyzed block number), the plug-in state and the real-time status.
- State: block number analyzed
- Run: The SOA plug-in is computing order spectra and averaging it.
- Stop: The SOA plug-in is stopped.
- Trig: The SOA plug-in is waiting for next block; i.e. next trigger event (block triggering) or first start event (triggering)
- Pause: The SOA plug-in averaging is paused
- Waiting: The SOA plug-in averaging is waiting for the acquisition to be accepted or rejected (in structural mode).
Notes: in exponential averaging mode the average count stops increasing as soon as the set value is reached.
The way the status bar is displayed, depends on the type of averaging selected:
- ’Linear’, ’Peak hold’ or ’Ref peak hold’: the progress bar is filled from left to right.
- ’Exponential’: the progress bar is filled from right to left with a flashing until the end of the acquisition.
The color of the background bar and of the text depends on real-time status:
- Green background and white or black text: acquisition in real-time.
- Red background and white or black text: the current acquisition is not real-time (current block is not analyzed).
- Green background and red text: the current acquisition is real-time, but since start not all the blocks were analyzed.
SOAx cur.blk
SOA cur. blk is a status that shows if the measurement has been triggered (for long time acquisition) and the progression in the block.
- Triggering:
- Acquiring: displays the evolution of the acquisition in percentage. During the acquiring period, no result is displayed; the result will be display at the end of the acquisition.
- Paused: the acquisition is paused
- Stop: the acquisition is stopped
Trigger State
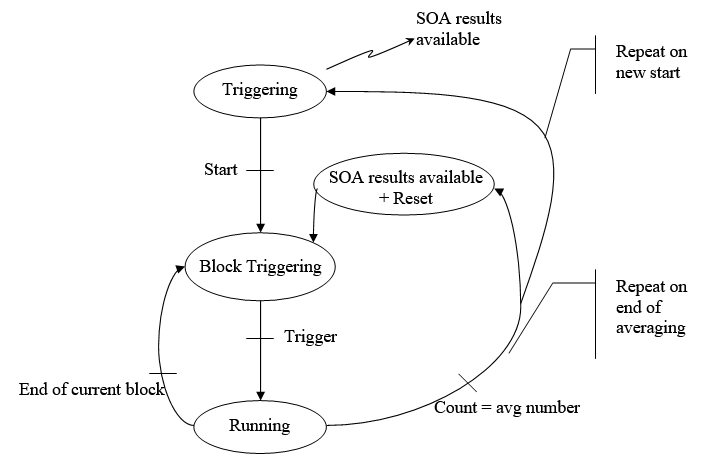
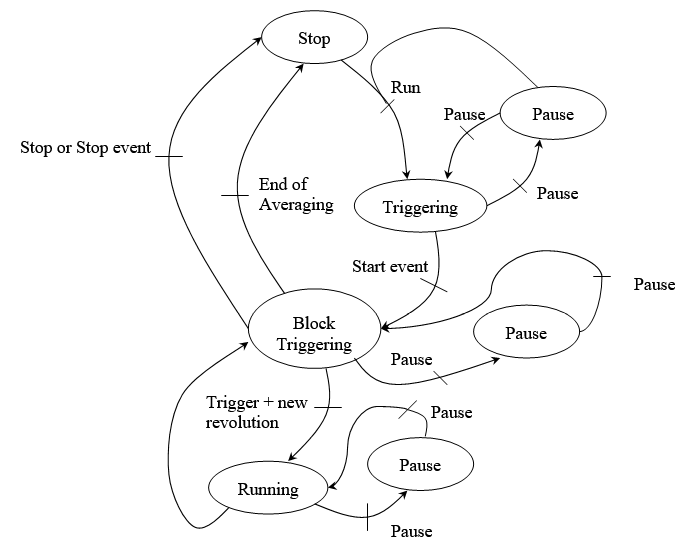
The following scheme describes the different states of the measurement:
The default trigger state is on ’Stop’ and waiting for a ’Run’ (start or trigger). Then the state become ’Triggering’ and is waiting for a start event, the states become ’Block Triggering’ and is now waiting for a trigger event for being in the ’Running state. If after one second there is no trigger event, the state comes back to ’Block Triggering’.
The state is ’Stop’ after a stop event or at the end of averaging.
Note: all start event, trigger, new revolution or run are ignored in ’free run’ mode
Count
This status displays the averaging count processed. This status is expressed in analyzed block.
Real-time
This status displays if the averaging is in real-time or not (i.e. the current block is analyzed or not). If the corresponding signal were not available at this time, the acquisition is not real-time. That means that the treatment is longer than the acquisition. There are three values for this state:
- ’OK’: The acquisition is real-time (all block have been processed and averaged)
- ’No’: Acquisition was not real-time (some previous blocks are missing in the average).
- ’-’: The acquisition is currently not real-time (current block is not analyzed an averaged).
Block overload
This status corresponds to the instantaneous overload indication within 1 SOA trigger block, for instance amplitude overload occurred in the current analyzed block. Note that overloaded block may be automatically rejected (see accept mode).
Analysis overload
This status corresponds to overload indication over the measurement period. It means that during the whole measurement period there was (or not) an overload. It memorizes block overloaded.
