Difference between revisions of "NVGate Post Analysis"
| (20 intermediate revisions by 3 users not shown) | |||
| Line 1: | Line 1: | ||
[[category:NVGate]] | |||
[[category:WikiOros]] | |||
The Post Analysis of a signal is a mode of NVGate where the physical input of the frontend are replaced by the tracks of the signal load in the player. This will allow you to re-analyse a signal previously recorded. Therefore, this mode can be used to calculate new result from a previous measurement, or re-calculate results with different setups. <br> | The Post Analysis of a signal is a mode of NVGate where the physical input of the frontend are replaced by the tracks of the signal load in the player. This will allow you to re-analyse a signal previously recorded. Therefore, this mode can be used to calculate new result from a previous measurement, or re-calculate results with different setups. <br> | ||
| Line 8: | Line 10: | ||
===Loading the signal=== | ===Loading the signal=== | ||
switch to post analyse more from the "home" tab | |||
After clicking | [[File:Online_PA.png|700px]] | ||
[[Image:TutoPA_LoadSig.png| | |||
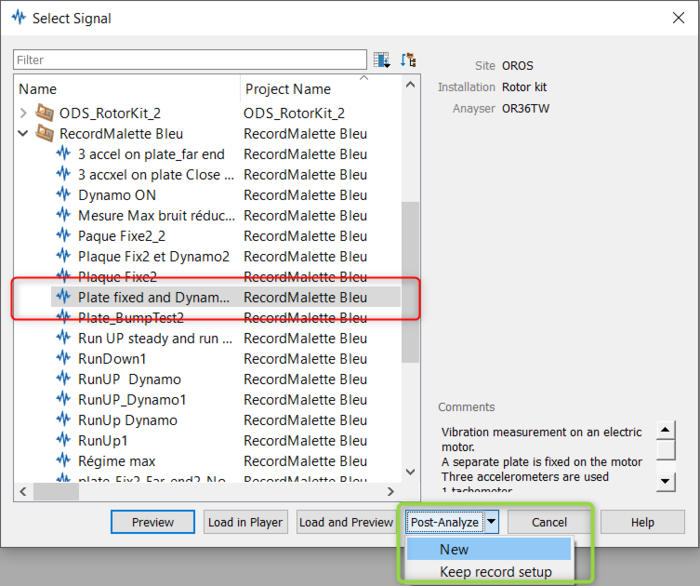
After clicking the ''Select Signal'' window is open. This window allow you to select the signal you want to load. Here, I select the record "Plate fixed and Dynamo" and slect ''New'' under the ''Post Analyze'' button : | |||
[[Image:TutoPA_LoadSig.png|700px|none]]<br> | |||
For more detail about the loading of the record, please see the [[NVGate_Post_Analysis#Loading_a_signal|Parameter: Loading a signal]] section of this page.<br> | For more detail about the loading of the record, please see the [[NVGate_Post_Analysis#Loading_a_signal|Parameter: Loading a signal]] section of this page.<br> | ||
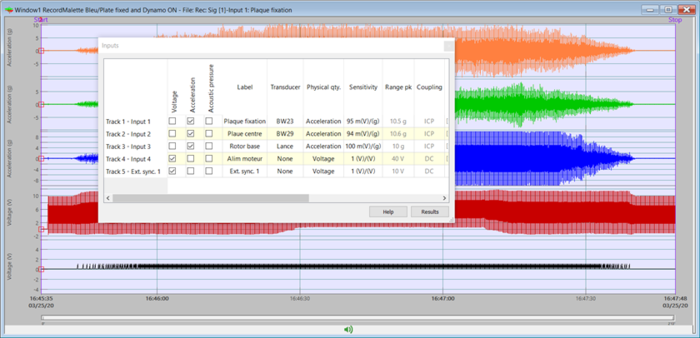
After clicking on post analyse, NVGate is automatically switch to post analysis mode, the signal is load in the [[NVGate Player|player]] and the [[NVGate_Software_overview#Step_1:_Inputs_selection|''Input'' window]] is opened : | After clicking on post analyse, NVGate is automatically switch to post analysis mode, the signal is load in the [[NVGate Player|player]] and the [[NVGate_Software_overview#Step_1:_Inputs_selection|''Input'' window]] is opened : | ||
[[Image:TutoPA_Loaded.png| | [[Image:TutoPA_Loaded.png|700px|none]]<br> | ||
You can see that the frontend inputs are replaced by the tracks of the record. | You can see that the frontend inputs are replaced by the tracks of the record. | ||
| Line 23: | Line 26: | ||
===Connect the tracks in the plug-ins=== | ===Connect the tracks in the plug-ins=== | ||
In this section, we will see how to display the [[NVGate Waterfall|waterfall]] of the [[NVGate FFT | In this section, we will see how to display the [[NVGate Waterfall|waterfall]] of the [[NVGate FFT|average spectrum]], the [[NVGate_Waterfall#Waterfall_profile_display|profile]] of the first order with the [[NVGate Synchronous Order Analysis|SOA plug-in]], and the speed [[NVGate_Waterfall#Waterfall_profile_display|profile]] of the tachometer. | ||
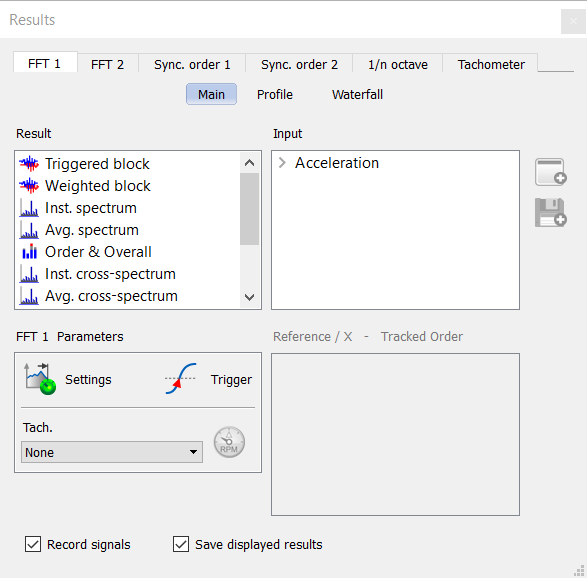
To connect the tracks in the different NVGate plug-in, click on ''Result'' to open the ''[[NVGate_Software_overview#Step_2_Show_results|Show result]]'' window: | To connect the tracks in the different NVGate plug-in, click on ''Result'' to open the ''[[NVGate_Software_overview#Step_2_Show_results|Show result]]'' window: | ||
[[Image:ResultWindow.png|framed|none]]<br> | [[Image:ResultWindow.png|framed|none]]<br> | ||
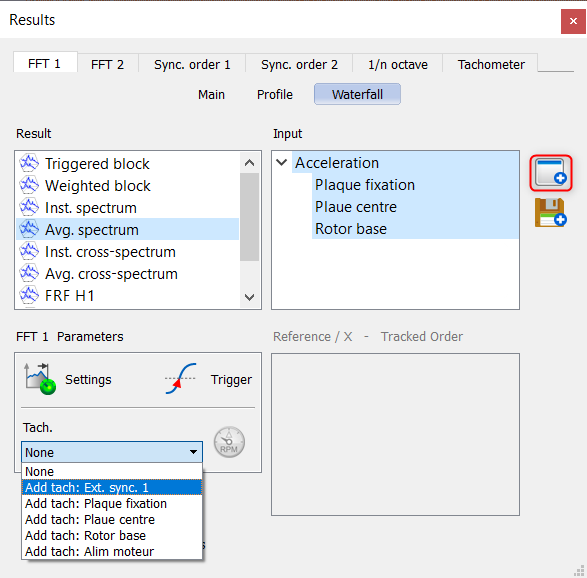
We can now connect the tracks in the [[NVGate FFT | We can now connect the tracks in the [[NVGate FFT|FFT module]] to display the [[NVGAte Waterfall|waterfall]] : | ||
[[Image:TutoPA_DisplayWaterfall.png|framed|none]]<br> | [[Image:TutoPA_DisplayWaterfall.png|framed|none]]<br> | ||
| Line 39: | Line 42: | ||
* '''Note :''' please refer to the [[NVGate_Software_overview#Tutorial|NVGate software tutorial]] and the plug-ins pages to correctly setup each modules and displays.<br><br> | * '''Note :''' please refer to the [[NVGate_Software_overview#Tutorial|NVGate software tutorial]] and the plug-ins pages to correctly setup each modules and displays.<br><br> | ||
After displaying all the wanted results, I can run the acquisition by the same manner | After displaying all the wanted results, I can run the acquisition by the same manner as On-line mode, by clicking on [[Image:RunIcon.png]]: | ||
[[Image:TutoPA_Result.png| | [[Image:TutoPA_Result.png|700px|none]]<br> | ||
===Selecting specific ranges=== | ===Selecting specific ranges=== | ||
After this first acquisition, the three phases of the measurement, the run-up, steady state ans run-down, are clearly visible on the tacho [[NVGate Waterfall#Profile|profile]], and I can use the cursors to find each starting and ending points : | After this first acquisition, the three phases of the measurement, the run-up, steady state ans run-down, are clearly visible on the tacho [[NVGate Waterfall#Profile|profile]], and I can use the cursors to find each starting and ending points : | ||
[[Image:TutoPA_TachoProfile.png| | [[Image:TutoPA_TachoProfile.png|700px|none]]<br> | ||
We can now select the specific ranges to separate our analysis on the three states of the record and create our new measurements. The run-up is between 10.36 and 54.28 seconds on the record. We can either select the run-up's range with the mouse in the player : | We can now select the specific ranges to separate our analysis on the three states of the record and create our new measurements. The run-up is between 10.36 and 54.28 seconds on the record. We can either select the run-up's range with the mouse in the player : | ||
| Line 55: | Line 57: | ||
Once the range is selected, you can run the acquisition by clicking on [[Image:RunIcon.png]]. Only the selected range will be analysed, and you can then save the results : | Once the range is selected, you can run the acquisition by clicking on [[Image:RunIcon.png]]. Only the selected range will be analysed, and you can then save the results : | ||
[[Image:TutoPA_RunUp_Results.png| | [[Image:TutoPA_RunUp_Results.png|700px|none]]<br> | ||
===Conclusion=== | ===Conclusion=== | ||
| Line 65: | Line 67: | ||
==Parameters== | ==Parameters== | ||
<Youtube>https://www.youtube.com/watch?v=qII6SsJfqGc</Youtube> | |||
===Loading a signal=== | ===Loading a signal=== | ||
In this section, we detail the two different method to load a signal and switch to post analysis mode. | In this section, we detail the two different method to load a signal and switch to post analysis mode. | ||
| Line 70: | Line 75: | ||
This first option allow you to post analyse the signal with a brand new setup. It will load a signal in the [[NVGate_Player|player]], display the preview of the signal envelope, and switch to post-analysis mode. | This first option allow you to post analyse the signal with a brand new setup. It will load a signal in the [[NVGate_Player|player]], display the preview of the signal envelope, and switch to post-analysis mode. | ||
* From the [[NVGate Ribbons: Home Tab|Home tab / Start group]], press the ''Post-Analyze'' button. This will display a selection of signal files available for post-analysis: | * From the [[NVGate Ribbons: Home Tab|Home tab / Start group]], press the ''Post-Analyze'' button. This will display a selection of signal files available for post-analysis: | ||
[[Image:Player_pa.png| | [[Image:Player_pa.png|700px|none]]<br> | ||
Click on the descending arrow to select '''New''': | Click on the descending arrow to select '''New''': | ||
| Line 76: | Line 81: | ||
This will open the '''connection properties''' widow, and you can connect your tracks in the different module to perform your post analysis. | This will open the '''connection properties''' widow, and you can connect your tracks in the different module to perform your post analysis. | ||
[[Image:NewConnecTracks.png| | [[Image:NewConnecTracks.png|700px|none]]<br> | ||
* From the [[NVGate Project manager|project manager]], by right clicking on the signal you want to analyze. Choose '''Post-Analyze ''', and click on '''New''': | * From the [[NVGate Project manager|project manager]], by right clicking on the signal you want to analyze. Choose '''Post-Analyze ''', and click on '''New''': | ||
| Line 82: | Line 87: | ||
As previously, this will open the '''connection properties''' widow, and you can connect your tracks in the different module to perform your post analysis. | As previously, this will open the '''connection properties''' widow, and you can connect your tracks in the different module to perform your post analysis. | ||
[[Image:NewConnecTracks.png| | [[Image:NewConnecTracks.png|700px|none]]<br><br> | ||
if you are already in '''post analyse mode''', the current setup will not be deleted if you load a new record with this method. Therefore, you can use this method to post Analyse two record witht the same analysis setup. However, the records must have the same track number and type. | if you are already in '''post analyse mode''', the current setup will not be deleted if you load a new record with this method. Therefore, you can use this method to post Analyse two record witht the same analysis setup. However, the records must have the same track number and type. | ||
| Line 93: | Line 98: | ||
Click on the descending arrow to select '''Keep record setup''': | Click on the descending arrow to select '''Keep record setup''': | ||
[[Image:MenuKeepRecSetup.png| | [[Image:MenuKeepRecSetup.png|700px|none]]<br> | ||
This will open the '''[[NVGate Player|Preview window]]''' (1), and all the plug-in used in real time during the analysis. Here, the [[NVGate FFT | This will open the '''[[NVGate Player|Preview window]]''' (1), and all the plug-in used in real time during the analysis. Here, the [[NVGate FFT|FFT]] window (2) and the [[NVGate Waterfall|waterfall]] (3). Finally the '''Connection window''' (4) is displayed, so you can connect your tracks in other plug-ins to perform your post analysis. | ||
[[Image:KeepRecDisplay.png| | [[Image:KeepRecDisplay.png|700px|none]]<br><br> | ||
The opened plug-in are setup the same way as during the acquisition. So you can change these setup, as you would do for an [[NVGate Architecture|online]] real time analysis. | The opened plug-in are setup the same way as during the acquisition. So you can change these setup, as you would do for an [[NVGate Architecture|online]] real time analysis. | ||
| Line 104: | Line 109: | ||
As from the ribbon, this will open the recorder and plug-in used for acquisition. | As from the ribbon, this will open the recorder and plug-in used for acquisition. | ||
[[Image:KeepRecDisplay.png| | [[Image:KeepRecDisplay.png|700px|none]]<br><br> | ||
if you are already in '''post analyse mode''', the current setup will '''be deleted''' if you load a new record with this method and be replaced by the setup used during the recording. To post analyse another record with the current setup, simply load it in the [[NVGate Player|player]]. | if you are already in '''post analyse mode''', the current setup will '''be deleted''' if you load a new record with this method and be replaced by the setup used during the recording. To post analyse another record with the current setup, simply load it in the [[NVGate Player|player]]. | ||
| Line 120: | Line 125: | ||
Once the record is load, the [[NVGate Player|player window]] and the connect tracks window appears: | Once the record is load, the [[NVGate Player|player window]] and the connect tracks window appears: | ||
[[Image:Connect_First_Step.png| | [[Image:Connect_First_Step.png|700px|none]]<br> | ||
As in on-line mode, I can click on ''[[NVGate_Software_overview#Setup_the_analysis|Result]]'' to display the ''[[NVGate_Software_overview#Step_2_Show_results|Result window]]'' and connect the different tracks. The tracks appears in the '''Input''' section: | As in on-line mode, I can click on ''[[NVGate_Software_overview#Setup_the_analysis|Result]]'' to display the ''[[NVGate_Software_overview#Step_2_Show_results|Result window]]'' and connect the different tracks. The tracks appears in the '''Input''' section: | ||
[[Image:Results_PA.png|framed|none]]<br> | [[Image:Results_PA.png|framed|none]]<br> | ||
I can now create a [[NVGate Waterfall|waterfall]] of the [[NVGate FFT | I can now create a [[NVGate Waterfall|waterfall]] of the [[NVGate FFT|Average spectrum]] of my accelerometers inputs, and add the [[NVGate_Tachometer#Ext._Tach|tachometer Ext. Sync. channel]] as reference : | ||
[[Image:Add_Tacho_PA.png|framed|none]]<br> | [[Image:Add_Tacho_PA.png|framed|none]]<br> | ||
Then click on [[Image:FFT_Setting_PA.png]] to adapt the setup of the [[NVGate FFT | Then click on [[Image:FFT_Setting_PA.png]] to adapt the setup of the [[NVGate FFT|FFT]], and then [[Image:DisplayButton.png]] to display the [[NVGate Waterfall|waterfalls]]: | ||
[[Image:Final_Display_PA.png| | [[Image:Final_Display_PA.png|700px|none]]<br> | ||
=====Connect tracks to the TDA plug-in===== | =====Connect tracks to the TDA plug-in===== | ||
| Line 137: | Line 142: | ||
The ''Track connection'' window appear: | The ''Track connection'' window appear: | ||
[[Image:Track_Connection_PA.png| | [[Image:Track_Connection_PA.png|700px|none]]<br> | ||
You can then select the track you want, and '''drop''' them in to any plug-in. Here, we are adding the first tract to the [[NVGate Time Domain Analysis|TDA]]: | You can then select the track you want, and '''drop''' them in to any plug-in. Here, we are adding the first tract to the [[NVGate Time Domain Analysis|TDA]]: | ||
[[Image:Connect_TDA_PA.png| | [[Image:Connect_TDA_PA.png|700px|none]]<br> | ||
You can then click on ''OK'', and display the [[NVGate Time Domain Analysis|TDA]] results from the [[NVGate Ribbons: Display/Graph Tab|Display/Graph tab]] of the ribbon. | You can then click on ''OK'', and display the [[NVGate Time Domain Analysis|TDA]] results from the [[NVGate Ribbons: Display/Graph Tab|Display/Graph tab]] of the ribbon. | ||
Latest revision as of 11:48, 26 November 2024
The Post Analysis of a signal is a mode of NVGate where the physical input of the frontend are replaced by the tracks of the signal load in the player. This will allow you to re-analyse a signal previously recorded. Therefore, this mode can be used to calculate new result from a previous measurement, or re-calculate results with different setups.
The post analysis mode can be made in connected (starting NVGate with the analyser) or office mode (starting NVGate with the dongle). However, we strongly advise to perform post analysis in Office mode, as the communication between the PC and the analyser will limit the performances. To do so, the signal must have been downloaded from the analyser to the computer.
Tutorial
In this tutorial, we will perform the post analysis of a signal recorded during a previous measurement with an OR36TW. The post analysed record is a run-up, a run-down, and a phase at steady speed of an electric motor. The electric motor is linked to a Dynamo and a plate is attached to the its base. Four sensors are used : three accelerometers and a tachometer for the speed. I will post analyse the signal to separate each steps of the record.
Loading the signal
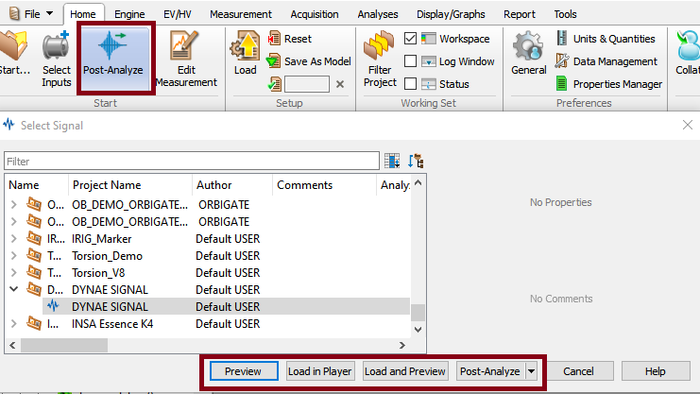
switch to post analyse more from the "home" tab
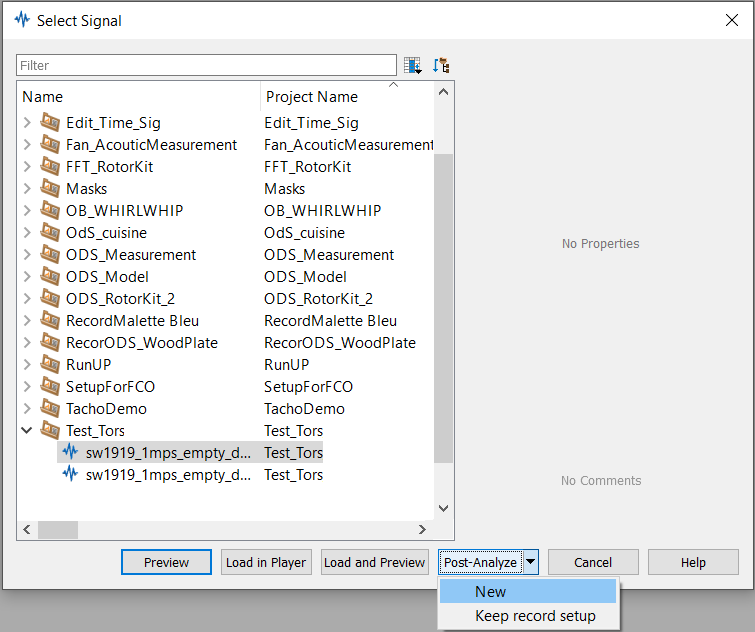
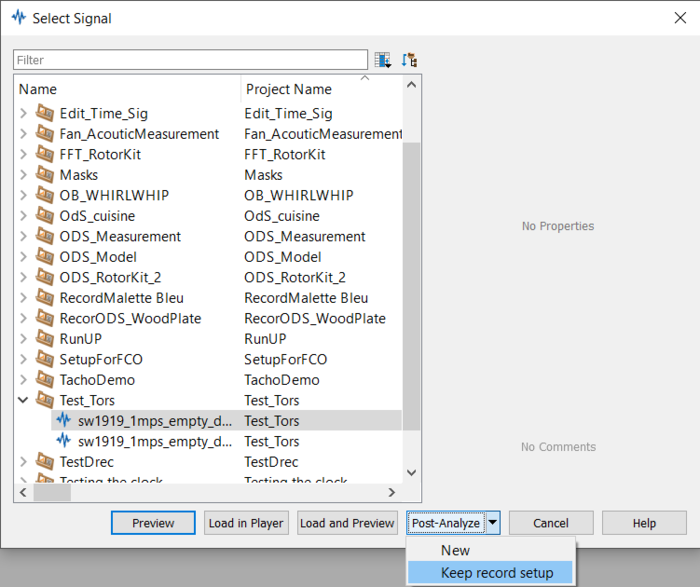
After clicking the Select Signal window is open. This window allow you to select the signal you want to load. Here, I select the record "Plate fixed and Dynamo" and slect New under the Post Analyze button :
For more detail about the loading of the record, please see the Parameter: Loading a signal section of this page.
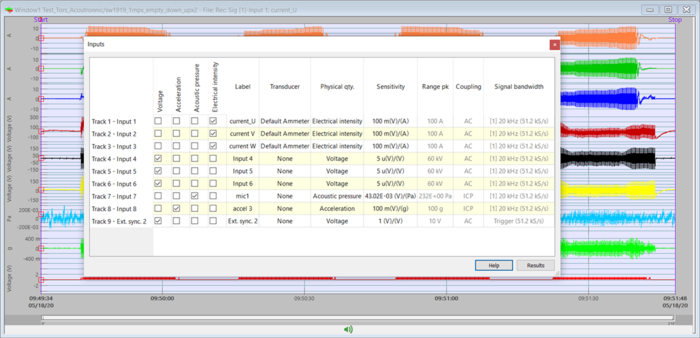
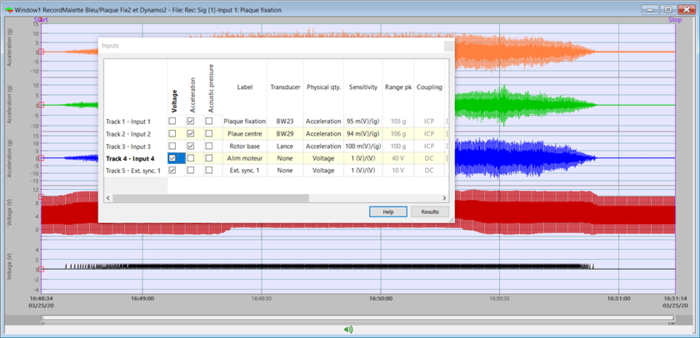
After clicking on post analyse, NVGate is automatically switch to post analysis mode, the signal is load in the player and the Input window is opened :
You can see that the frontend inputs are replaced by the tracks of the record.
Connect the tracks in the plug-ins
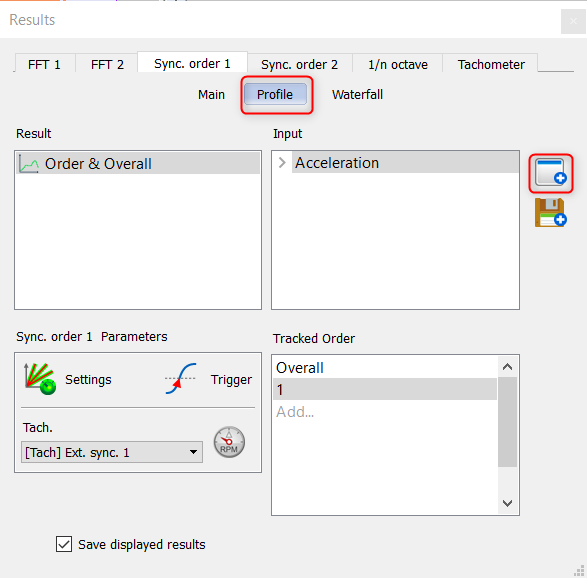
In this section, we will see how to display the waterfall of the average spectrum, the profile of the first order with the SOA plug-in, and the speed profile of the tachometer.
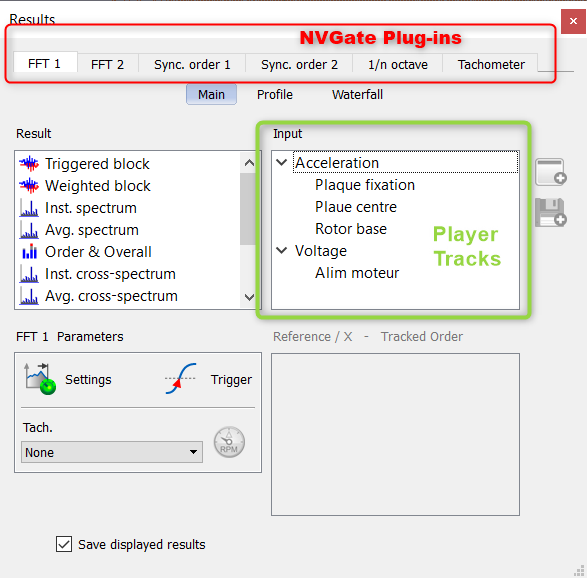
To connect the tracks in the different NVGate plug-in, click on Result to open the Show result window:
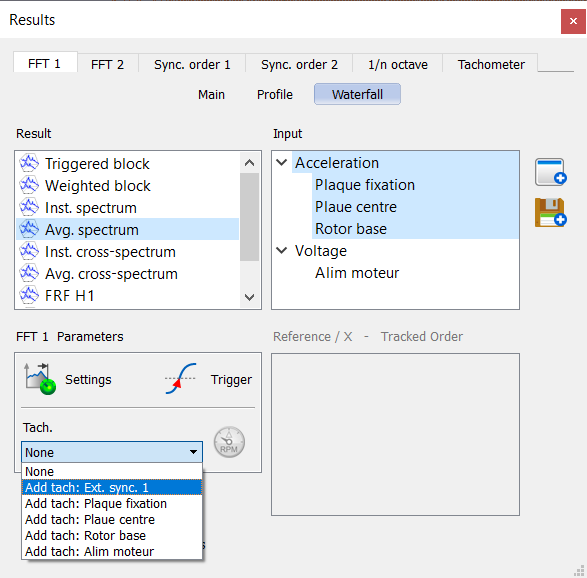
We can now connect the tracks in the FFT module to display the waterfall :
In the SOA plug-in to display the profile:
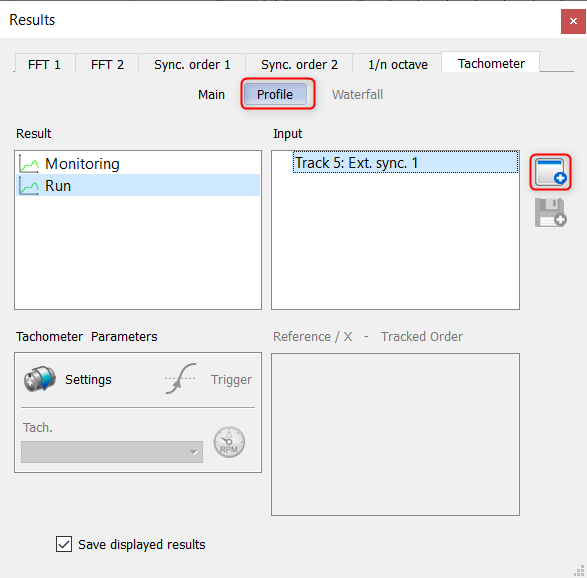
And in the tachometer section to display the tachometer profile:
- Note : please refer to the NVGate software tutorial and the plug-ins pages to correctly setup each modules and displays.
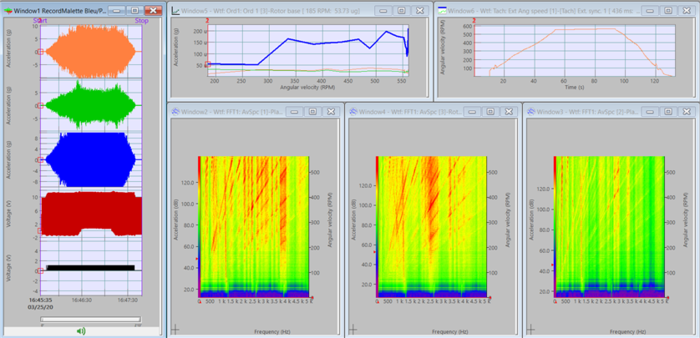
After displaying all the wanted results, I can run the acquisition by the same manner as On-line mode, by clicking on ![]() :
:
Selecting specific ranges
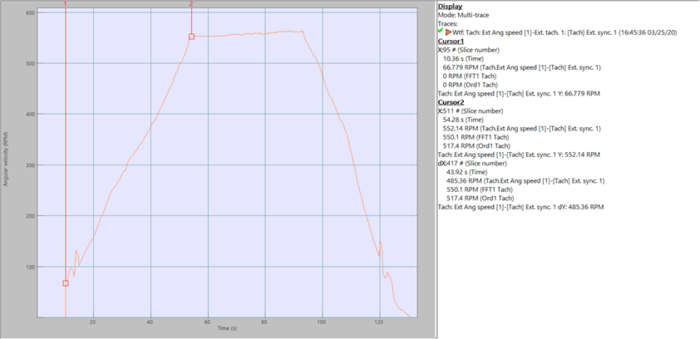
After this first acquisition, the three phases of the measurement, the run-up, steady state ans run-down, are clearly visible on the tacho profile, and I can use the cursors to find each starting and ending points :
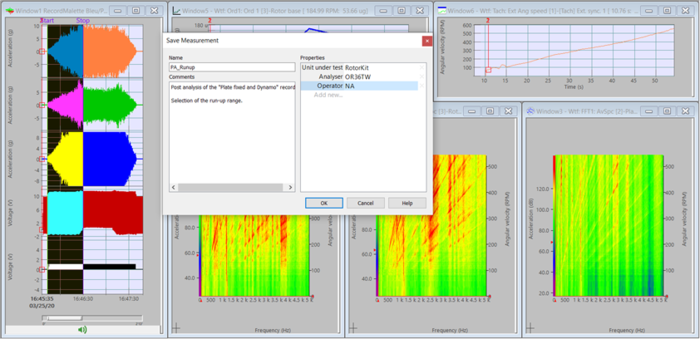
We can now select the specific ranges to separate our analysis on the three states of the record and create our new measurements. The run-up is between 10.36 and 54.28 seconds on the record. We can either select the run-up's range with the mouse in the player :
Or directly in the tracks section of the Acquisition tab of the NVGate ribbon:
Once the range is selected, you can run the acquisition by clicking on ![]() . Only the selected range will be analysed, and you can then save the results :
. Only the selected range will be analysed, and you can then save the results :
Conclusion
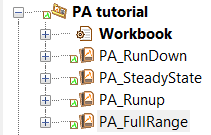
You can now select the Steady state and the Run_down ranges and make the acquisitions. After saving the results, the measurement will appear in the project manager :
- Note : You can adapt the setup of the result s for each rage if needed (the relevant results for the steady state may not be the same than the Run up and down states).
Parameters
Loading a signal
In this section, we detail the two different method to load a signal and switch to post analysis mode.
New setup option
This first option allow you to post analyse the signal with a brand new setup. It will load a signal in the player, display the preview of the signal envelope, and switch to post-analysis mode.
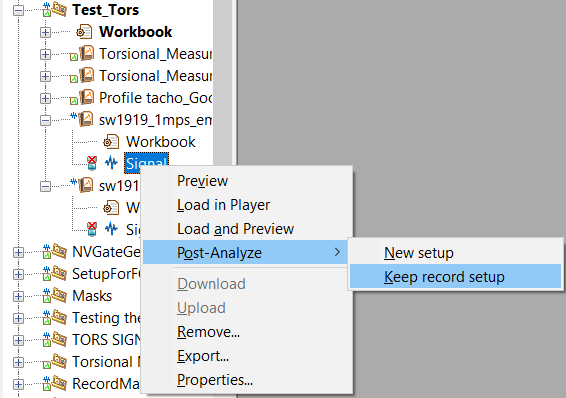
- From the Home tab / Start group, press the Post-Analyze button. This will display a selection of signal files available for post-analysis:
Click on the descending arrow to select New:
This will open the connection properties widow, and you can connect your tracks in the different module to perform your post analysis.
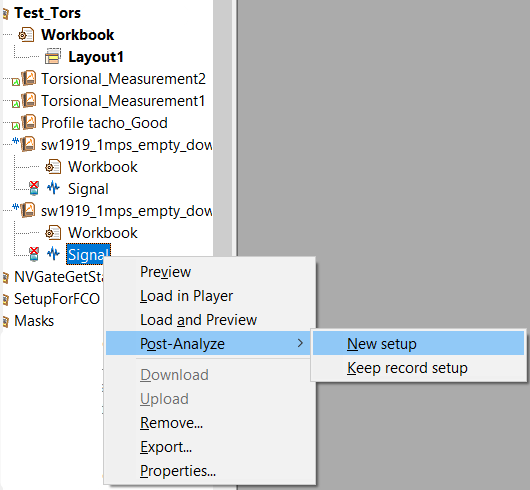
- From the project manager, by right clicking on the signal you want to analyze. Choose Post-Analyze , and click on New:
As previously, this will open the connection properties widow, and you can connect your tracks in the different module to perform your post analysis.
if you are already in post analyse mode, the current setup will not be deleted if you load a new record with this method. Therefore, you can use this method to post Analyse two record witht the same analysis setup. However, the records must have the same track number and type.
Keep recording setup option
This second method will allow you to post analyse the signal with the same setup used for the recording. As previously, this will load signal in the player and display the envelope of the recorded signal, switch to post-analysis mode, and keep the setup used during the record signal by replacing dynamical input of the frontend by the player tracks. Note: 'if the record setup contains virtual inputs, torsional channels, CAN or DC channels, the connection of these channels to the plug-ins will be reset.
- From the Home tab / Start group, press the Post-Analyze button. This will display a selection of signal files available for post-analysis:
Click on the descending arrow to select Keep record setup:
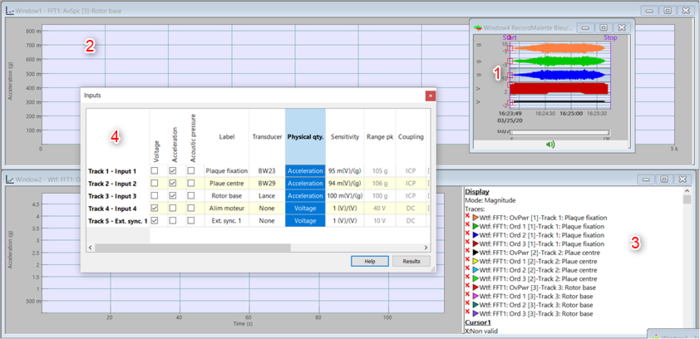
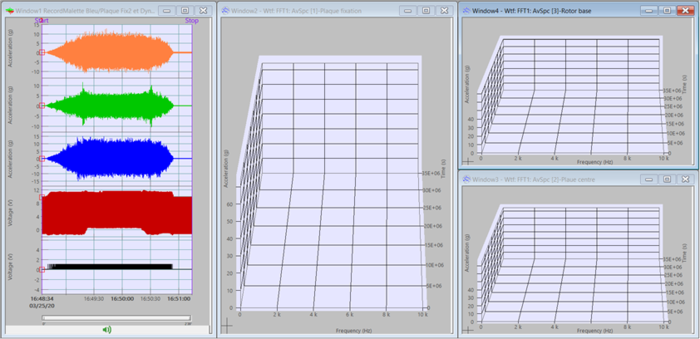
This will open the Preview window (1), and all the plug-in used in real time during the analysis. Here, the FFT window (2) and the waterfall (3). Finally the Connection window (4) is displayed, so you can connect your tracks in other plug-ins to perform your post analysis.
The opened plug-in are setup the same way as during the acquisition. So you can change these setup, as you would do for an online real time analysis.
- From the project manager, by right clicking on the signal you want to analyze. Choose Post-Analyze , and click on Keep record setup:
As from the ribbon, this will open the recorder and plug-in used for acquisition.
if you are already in post analyse mode, the current setup will be deleted if you load a new record with this method and be replaced by the setup used during the recording. To post analyse another record with the current setup, simply load it in the player.
Please see also the Keep record setup tutorial video :
Connecting the tracks in NVGate
In this section, we will see how to connect the tracks in the different plug-in once the signal have been load in the player. We will use the New setup option, as it will work exactly the same with the Keep record setup option.
Connect tracks to the different modules
In this example, I have 3 acceleration input, a voltage input and an Ext. Sync input used for a tachometer. The recording contain a run-up, steady state a maximal speed ans a run-down of an electric motor. I will use the acceleration and tachometer channel for post analysis.
Once the record is load, the player window and the connect tracks window appears:
As in on-line mode, I can click on Result to display the Result window and connect the different tracks. The tracks appears in the Input section:
I can now create a waterfall of the Average spectrum of my accelerometers inputs, and add the tachometer Ext. Sync. channel as reference :
Then click on  to adapt the setup of the FFT, and then
 ![]() to display the waterfalls:
to display the waterfalls:
Connect tracks to the TDA plug-in
To connect tracks to the TDA plug-in, you cannot use the Result window. To use this module in post analysis, go into the Acquisition tab of the NVGate ribbon. Select Connect Tracks (which replace Connect Inputs of the on-line mode):
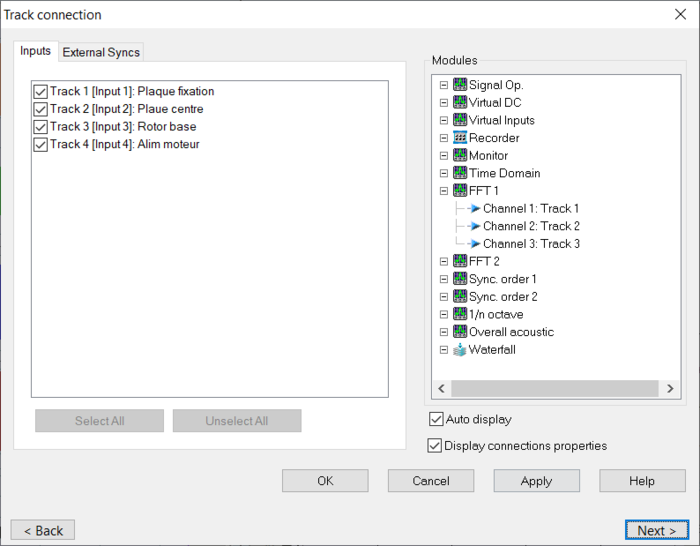
The Track connection window appear:
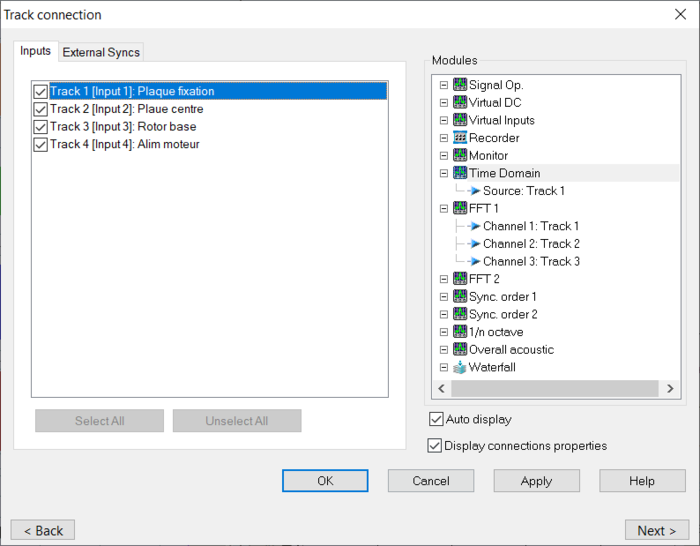
You can then select the track you want, and drop them in to any plug-in. Here, we are adding the first tract to the TDA:
You can then click on OK, and display the TDA results from the Display/Graph tab of the ribbon.
Connect a tachometers as a torsional channels
Post Analysis if often used for torsional measurement. for details about channel connection, you can directly visit the NVGate Torsional analysis wiki page.
Batch Post Process
The BatchPostProcess tool is an external tool of NVGate that allow to automatically repeat the same post analysis setup over multiple recording.
For details, please visit the BatchPostProcess dedicated wiki page.

