|
|
| (145 intermediate revisions by 5 users not shown) |
| Line 1: |
Line 1: |
| | [[category:NVGate]] |
|
| |
|
| | =====Starting the analyser and NVGate===== |
| | First of all, connect your analyser to the computer and power it on. Then double-click on the NVGate Icon from your desktop. The connection dialog appears. Select operation mode (Connected, Office or multi-instruments).<br> |
|
| |
|
| ===Analyzer software architecture===
| | [[Image:Connection.png|700px|none]] |
| [[NVGate_Architecture|Analyzer architecture page]]
| |
| | |
| ===Dataset management===
| |
| | |
| [[NVGate dataset management|See NVGate Dataset management page]]
| |
| | |
| ===Starting NVGate===
| |
| | |
| This example will show you how to use the "GoToResult" of NVGate to realise quickly a complete measurement setup from the start of the software. To realise this, we are using an OR36TW analyser and NVGate V12.10. We also use a simple rotorkit built from an electric modelling motor, on witch we connected two 100mV/g accelerometer and a tachometer with 2 pulse/revolution.<br><br>
| |
| ====Starting the analyser and NVGate====
| |
| First of all, connect you analyser to the computer and start it on. Then double-click on the NVGate Icon from your desktop. The connection dialog appears. Select operation mode (Connected, Office or multi-instruments).<br>
| |
| | |
| [[Image:Connection.png|framed|none]] | |
|
| |
|
| Select the analyser and click on start.<br><br> | | Select the analyser and click on start.<br><br> |
|
| |
|
| The NVGate splash screen will automatically appears | | The NVGate splash screen will automatically appears. |
|
| |
|
| [[Image:NVGateStartImg.png|framed|none]] | | [[Image:splascreen2.png|framed|none]] |
|
| |
|
| At this stage, you can click on the cross [[Image:NVGateStartCross.png]] to abort the opening of the software.
| | =====Open/create a project===== |
| | |
| ====Open/create a project==== | |
|
| |
|
| NVGate will start and the ''Start ''dialog is proposed: | | NVGate will start and the ''Start ''dialog is proposed: |
| Line 32: |
Line 20: |
| Here we will create a new project : | | Here we will create a new project : |
|
| |
|
| [[Image:NewProg.png|framed|none]] | | [[Image:NewProg.png|framed|none]]<br> |
| | | This window is also accessible from the [[NVGate Ribbons: Home Tab|NVGate Ribbon]].<br><br> |
| This will open the "New Project" definition window. Fill up the necessary properties and comment to describe the context of this project and click on the ''Ok ''button.
| | This will open the "New Project" definition window. Fill up the necessary properties and comment to describe the context of this project. Check the ''Load setup'' box and click on the ''Ok ''button. |
| | |
| [[Image:FillingNewProj.png|framed|none]]
| |
| | |
| ====Select a setup====
| |
| In both above ''open project'' cases, the project is opened, no setup is loaded. The Setup is loaded further this first action. There are few ways to load a setup prior being ready for acquisition and analyses.
| |
| [[Image:V10_release_18.png|framed|none]]
| |
| | |
| <u>Check the ''Load setup'' box</u> in the ''open project'' dialog in order to select the setup while exiting the ''Open project'' one. | |
| | |
| Use the ''Home/Setup/Load'' ribbon button.
| |
| | |
| The load setup dialog behaves as a single Item selection. It allows loading setups from ''Models'' ''Measurements'' and ''Projects'' or creating setups for on-line or post-analysis:
| |
| | |
| | |
| | |
| ====GoToResult====
| |
| | |
| | |
| Available from both the bottom bar and ''Home\Start\Select Inputs'' this window allows selecting the inputs to be used and setups their acquisition.
| |
| | |
| | |
| '''Access to the ''''''''GoToResults'' ''''''window is continuously available from the NVGate bottom bar.'''
| |
| | |
| The 2 first buttons control the visibility of the corresponding windows ''Inputs selection'' and ''Show results''. Click once to show the window, click again to hide it. The 3<sup>rd</sup> button only opens the ''Results overview''.
| |
| | |
| These 3 buttons show the windows described below.
| |
| | |
| [[Image:V11_release_08.png|framed|none]]
| |
| Hide the window by clicking on its control button, closing the window (up-right red cross), clicking on the ''Results'' button to show the next window.
| |
| | |
| ===== Step 1: Inputs selection=====
| |
| [[Image:Usersmanual_26.png|framed|none]]
| |
| | |
| ======Usage======
| |
| The ''Inputs selection'' window '''allows access to the other items of the NVGate''' '''interface''' (ex: ''check ICP, Autorange'', change sampling frequencies, graphs…) while it remains open.
| |
| | |
| [[Image:Usersmanual_110.png|framed|none]]
| |
| | |
| The actions in this window apply immediately to the analysis, there is no possible cancel. In the same way actions in other parts of NVGate are immediately reflected in this window.
| |
| | |
| This window manages dynamic inputs only. For using parametric, CAN or ext. synch inputs, one should use the acquisition tab of the ribbon. | |
| | |
| ======Operations======
| |
| The Inputs selection window allows activating and setting-up the dynamic inputs in a fast and smart way. Inputs are activated and set to a physical quantity when the corresponding check box is clicked.
| |
| | |
| ======Selection======
| |
| This table allows selecting one or multiple cells in an Excel like mode, using '''mouse drag'''''',''' '''keyboard arrows''' and '''SHIFT/CTRL''' keys. After edition, the focus is automatically set to the next cell for continuous operation with the keyboard:
| |
| | |
| {|border="2" cellspacing="0" cellpadding="4" width="100%"
| |
| |Exit key
| |
| |Return
| |
| |Tab
| |
| |Left arrow
| |
| |Right arrow
| |
| |Up arrow
| |
| |Down arrow
| |
| | |
| |-
| |
| |Next cell
| |
| |Down
| |
| |Right
| |
| |Left
| |
| |Right
| |
| |Up
| |
| |Down
| |
| | |
| |}
| |
| | |
| ======Edition======
| |
| Editing a cell or a group of cells is direct, '''no need to double click''', '''simply enter the values''' or initials for combo boxes. Hit the <nowiki><</nowiki>Space<nowiki>></nowiki> key to open the combo with the current selection. This allows using the keyboard only while setting cells in a column or a line.
| |
| | |
| ======Add physical quantities======
| |
| The 3 basic physical quantities (Voltage, Acceleration and Acoustic pressure) used in noise and vibration are proposed as default. '''Changing one input physical quantity will add a new column''' with this physical quantity.
| |
| | |
| In addition to the basics and active physical quantity, the columns also show the physical quantities of deactivated inputs. '''This is useful to add default physical quantities to your models'''.
| |
| | |
| ======Transducers======
| |
| The list of possible transducers is '''adjusted to the input physical quantity'''. Ex: if an input is set to acoustic pressure, only a microphones<nowiki>’</nowiki> list is proposed.
| |
| | |
| ======Sampling & groups======
| |
| The sampling setting is new. It '''defines the recording sampling and the analysis bandwidth for each group of inputs'''. The groups correspond to the inputs physical quantities. See the ''Autobandwidth'' chapter for more details
| |
| | |
| There are 2 samplings, ''High'' and ''Low''. Each sampling can be adjusted from the table with ''Right click -<nowiki>></nowiki> Change -<nowiki>></nowiki> Select new sampling.''
| |
| | |
| '''Changing the sampling of one input will apply to all input in the same group'''. For applying different samplings to inputs with same physical quantity, use the ASB.
| |
| | |
| Sampling settings are also available from the ribbon Measurement\Front-end\High Samp. and Low Samp. and from the Front-end Module in the Analysis Setting Browser.
| |
| | |
| ======Record signals======
| |
| Check this box to '''ensure the recording of all active inputs'''. This includes the DC inputs (parametric), the Ext Sync. and the CAN ones.
| |
| | |
| Unchecking this box just set the recorder to off. The inputs remain set in the recorder. This is helpful to '''temporarily pause the inputs recording'''; especially on setup fine tuning.
| |
| | |
| | |
| [[Image:Usersmanual_05.png|framed|none]]
| |
| | |
| The Record signal is also available from the ribbon Measurement\Front-end\Records signal. And from the show results window.
| |
| | |
| All instances of this setting work in the same way. Wiith this method, the recorder signals are not automatically displayed.
| |
| | |
| A new button is available to '''monitor temporarily or continuously the signal:''' ''Measurement\Control\View recording''. '''It opens the signal monitoring window on top of the current layout'''. In the case of this window is already open in another layout, it swaps to this layout.
| |
| | |
| ======Access to all======
| |
| By default, the window shows only the basic settings. In order to get the full columns, '''flyover the right side of the table and click on the grayed arrow'''.
| |
| | |
| [[Image:Usersmanual_111.png|framed|none]] | |
| | |
| Same with the left arrow to return to the basic view.
| |
| | |
| ======Post-analysis======
| |
| ''Inputs selection'' window works on both on-line and post-analysis modes.
| |
| | |
| =====Step 2 Show results=====
| |
| [[Image:Usersmanual_28.png|framed|none]]
| |
| ======Call======
| |
| Available from both the bottom bar or directly following the ''Inputs Selection'' window, this window allows '''displaying and saving results from activated inputs'''.
| |
| | |
| Hide the window by clicking on its control button closing the window (up-right red cross) or by clicking on its corresponding button in the NVGate bottom bar.
| |
| | |
| [[Image:Usersmanual_112.png|framed|none]]
| |
| | |
| ======Usage======
| |
| The ''Show results'' window '''allows access to the other items of the NVGate interface''' (''Add/Change layout, Setup tachometer''…) while it remains open.
| |
| | |
| [[Image:Usersmanual_30.png|framed|none]]
| |
| | |
| The actions in this window apply immediately to the analysis, there is no cancel possible from this window. In the same way, actions in other parts of NVGate are immediately reflected in this window.
| |
| | |
| This window manages to connect and display result from FFTx, SOAx, OCT plug-ins only. For results from TDA and OVA, one should use the ''Acqusition\Inputs\Connect inputs'' button followed by the ''Display/Graphs''\''Windows\Add/Remove'' one from the ribbon.
| |
| | |
| ======Show results======
| |
| The Show ''results'' window allows displaying and saving results without connecting inputs or tracks to the plug-in analyzers in advance.
| |
| | |
| | |
| Results to be displayed are selected as follows:
| |
| | |
| 1. Select the plug-in which calculates the results,
| |
| [[Image:Usersmanual_38.png|framed|none]]
| |
| | |
| | |
| | |
| 2. select the results<nowiki>’</nowiki> familly between:
| |
| | |
| * ''Main'' is for results imediatelly provided by the analysis like the trigger blocks, RPM, spectra, FRFs, …
| |
| * ''Profile'' is for scalar profiles like order tracking, acoustic level, RPM profiles, …
| |
| * ''Waterfall ''is for 3D results.
| |
| 3. Select the result type,
| |
| | |
| 4. select the Inputs/Tracks to be displayed. This list '''gathers the sources in groups according to their physical quantities'''. One can develop the group for partial selection.
| |
| | |
| Go. Use the ''Show'' button to display your selection. This button operates in 2 ways:
| |
| | |
| * <u>Add a new window</u> in the current layout with the selected results by clicking the button
| |
| * Drag & Drop the button to an existing window of the current layout to <u>add the selected results in this window</u>.
| |
| | |
| ======References======
| |
| Cross functions (FRFs, ORFs, Coherence, etc..) are selected through the bottom right area. The references are displayed as the inputs/tracks using the physical quantity group. There is no need to predefine the cross function from the Plug-in settings.
| |
| | |
| ======Orders and overall======
| |
| | |
| [[Image:Usersmanual_04.png|framed|none]]
| |
| | |
| For order tracking, the Show results window features a fast and simple order selection mode. While selecting order-based result, one can enter the chosen orders in the bottom right area of the window.
| |
| | |
| Values are entered directly using the keyboard; The Enter and up/down keys will navigate to next or previous lines in the list.
| |
| | |
| If the plug-in channels show different orders to track for one line, "Mixed" will be displayed.
| |
| | |
| ======Save results======
| |
| Results to be saved (i.e. added to the save selection list) are selected as for showing it.
| |
| | |
| There are 3 ways to save the results:
| |
| | |
| * Manually by using the save button. This will add the selected results to the save selection.
| |
| *
| |
| [[Image:Usersmanual_113.png|framed|none]]
| |
| Automatically and continuously, by checking the Save displayed results check box at the bottom of the window. This will continuously add the displayed results to the save selection. Results remain in the save selection list, even if they are removed from the layout.
| |
| *
| |
| [[Image:Usersmanual_27.png|framed|none]]
| |
| | |
| Automatically once by using Measurement\Save\Add All Results button from the ribbon. This button acts like the save all display result but only at once.
| |
| * This button is grayed when all displayed results are already in the save selection
| |
| * When the Save displayed results is active, this button shows
| |
| ======Parameters======
| |
| The bottom half of the window allows adjusting the selected plug-in parameters and triggering.
| |
| | |
| [[Image:Usersmanual_114.png|framed|none]]
| |
| | |
| 1. This button opens the active plug-in properties. NB: it is also possible to access it from the ribbon while the window is open. Helpful with the directly available main settings.
| |
| | |
| 2. Click here to open the ''Events connection'' window, where one can '''associate event with plug-ins<nowiki>’</nowiki> Start, stop or trigger'''.
| |
| | |
| 3. Activate the plug-in tach with this combo box. The tachometer properties will be proposed just after selecting the tach. The corresponding input (dynamic, or ext. synch) is automatically activated. <br>NB: The selected tachometer is associated with the plug-in. For profile and waterfall results, the corresponding tachometer is showed as: XXX tach (ex. FFT1 tach, or SOA2 tach)
| |
| | |
| 4. Click on the engine tachometer icon to setup the delta RPM for scheduled analyses with ''Profiles'' and ''Waterfalls''.
| |
| | |
| =====Step 3 Results overview=====
| |
| ======Call======
| |
| Available from the bottom bar. This window '''shows a synthetic table of the displayed and saved results'''. Close the window by clicking on its control button closing the window (up-right red cross).
| |
|
| |
|
| ======Usage======
| | [[Image:FillingNewProj.png|framed|none]]<br> |
| The table summarizes all the displayed and saved result (i.e. present in the Save Selection list), by:
| |
|
| |
|
| * Plug-ins
| | =====Load the configuration===== |
| * Type of results
| | This will open the ''Load setup'' window. This window allows you to load the configuration from a pre-saved model, a previous measurement, create a new setup or opening a signal for post-analysis. Here we want to setup a new configuration, we will select ''New On-Line'' : <br> |
| * Groups (i.e. Physical quantity)
| | [[Image:SelectNesConfig.png|700px|none]] |
| The 2 columns at the right, indicate what is done with each set of results. ''Show'' for the displayed results and ''Save'' for the to-be-saved results.
| |
|
| |
|
| [[Image:Usersmanual_115.png|framed|none]]
| | =====Select the inputs===== |
| | Once you click ''Load'', the input setup window appears : |
|
| |
|
| The check boxes have 3 possible status:
| | [[Image:InputEmpty.png|700px|none]]<br> |
|
| |
|
| *
| | This window can be called anytime from the ''[[NVGate_GoToResult|GoToResult]]''. See [[NVGate_GoToResult#Step_1:_Inputs_selection|Input selection]] for the detail of the parameters.<br><br> |
| [[Image:Usersmanual_116.png]] | |
| Checked, means all the inputs with these type and physical quantity, calculated by the plug-in are saved and/or displayed.
| |
| *
| |
| [[Image:Usersmanual_117.png]] | |
| Unchecked, means none of the inputs with these type and physical quantity, calculated by the plug-in are saved and/or displayed.
| |
| *
| |
| [[Image:Usersmanual_118.png]]
| |
| Partial, means only a part of the inputs with these type and physical quantity, calculated by the plug-in are saved and/or displayed.
| |
| One can check and uncheck the ''Save'' column boxes. Partial status boxes change to checked or unchecked only.
| |
|
| |
|
| It is possible to check the results one by one with the ''Save Selection'' window by clicking on the corresponding button at the bottom-right of the window
| | As we use 2 accelerometers, select check the "Acceleration" boxes for inputs 1 and 2, and select the appropriate sensors in the "Transducer" column for each inputs. If you don't see your specific sensors, please fill your [[NVGate Transducer and Calibration|transducer database]]. |
|
| |
|
| ===Interface description===
| | [[Image:AddInput.png|700px|none]]<br> |
|
| |
|
| [[NVGate_Ribbons_overview |See interface overview page]] | | To add the inputs into the [[NVGate Recorder|recorder]], check the ''Record signals'' box : |
| | [[Image:CheckRecorder.png|700px|none]]<br> |
| | By doing this, any inputs (even if added later) will automatically be connected to the [[NVGate Recorder|recorder plug-in]]. |
|
| |
|
| ======Analyzer Settings====== | | =====Edit the Sampling Rate===== |
| The Log Window shows all the changes made to the modules (Front-end, Filter builder, Monitor, FFT x, etc.) in the ASB. | | The sampling rate is the rate to which the signals will be sampled by the analyzer. This will define the maximum frequency that can be analyzed during the online analysis or in post-analysis on the recorded signals. However, a higher sampling rate will need more computational power. You may choose a sampling rate that is twice the highest frequency you want to analyze. |
|
| |
|
| Some setting values need to be adjusted when another setting value is modified. So when you change a setting value in the ASB (new value: ...) which may affect another setting value, the Log window marks the changes made by the analyzer (adjusted to: ...).
| | To edit the sample rate, do a right click on the sampling case. |
| | [[File:change sampling.png|700px]]<br> |
|
| |
|
| 1. Right click on this area:
| | Here we have a 25,6kS/sec that allow us to analyze the data up to 10kHz. |
|
| |
|
| 2. Select Copy (to paste a setup in a text document for example)
| | =====Setup the analysis===== |
| | Once the inputs are correctly declared, click on ''Results'' to setup the analysis : |
| | [[Image:ClickOnResults.png|700px|none]]<br> |
|
| |
|
| 3. Clear the display in the Analyzer Settings tab.
| | This will open the ''[[NVGate_GoToResult#Step_2_Show_results|Results]]'' window : |
|
| |
|
| Warning
| | [[File:Gotoresults2022.png|500px]] |
| | <br> |
|
| |
|
| The Warning tab shows any unauthorized operations you have carried out or errors reported by NVGate®.
| | This window can be called anytime from the ''[[NVGate_GoToResult#GoToResult|GoToResult]]'' icons. See the [[NVGate_GoToResult#Step_2_Show_results|Show result section]] for detail about this window. <br> |
|
| |
|
| 1. Right click on this area:
| | =====Displaying the FFT analysis===== |
| | We will now display the [[NVGate FFT|average spectrum]] for the two inputs : |
|
| |
|
| 2. Select Copy (to paste a setup in a text document for example)
| | [[Image:AddingFFT.png|500px]]<br> |
|
| |
|
| 3. Clear the display in the Warning tab.
| | Once you selected the result you want to display, click on [[Image:DisplayButton.png]] to display the graph in the current [[NVGate_Project_manager#Layout|layout]].<br> |
| | Make sure you checked the box ''Save displayed results'' to save the result at the end of the measurement.<br><br> |
|
| |
|
| Macro Trace
| | The [[NVGate_Display#Display_Window|FFT graph]] window now appear in the current [[NVGate_Project_manager#Layout|layout]] : |
| | [[Image:FFTDisplayWindow.png|700px|none]].<br> |
|
| |
|
| The Macro Trace tab shows the operations (the start and stop macro execution, errors) made in the macro mode.
| | =====Setting up the FFT analysis===== |
| | We can now setup the FFT to optimise the analysis. To access to the setup parameters, click on ''settings'' in the ''Show result'' window : |
| | [[Image:SettingFFT.png|500px]]<br> |
|
| |
|
| Warnings do not stop macro execution but major errors will.
| | Here, the maximum speed of the motor is 2000RPM. That make the first order at 2000/60 = 33Hz and the tenth order at 330Hz. In order to optimize the computation, we will then limit the FFT bandwidth to 5kHz, the overlap to 67% and the number of lines to 1601 to have a correct precision. |
| | [[Image:ModSettingFFT.png|500px]]<br> |
|
| |
|
| 1. Right click on this area:
| | You can then press ''OK'' to close this window. For details about the parameters, please visit the [[NVGate FFT]] page. |
|
| |
|
| 2. Clear the display in the Macro Trace tab.
| | =====Adding Order Profile===== |
| | We can now setup and display the order profile. To do this, select the ''[[NVGate Synchronous Order Analysis|Sync. order 1]]'' tab of the ''[[NVGate_GoToResult#Step_2_Show_results|Result]]'' window. |
|
| |
|
| '''Tip:''' double clicking on the error icon in the Macro Trace tab will open the Macro Editor on the failed command.
| | [[Image:SOAShowResult.png|400px|none]]<br> |
|
| |
|
| =====Workspace=====
| | Here, we want to display the first two [[NVGate_Synchronous_Order_Analysis#Profile|orders profile]] for each input. To do so, select the ''profile'' tab, and select '''Order & Overall''' under ''Result'' and '''Acceleration''' (that will select the 2 acceleration channels) under ''input''. To track the 2 first orders, you can simply enter '''1''' and '''2''' under the ''Tracked Order'' section.<br> |
| [[Image:Usersmanual_39.png|framed|none]] | |
| The workspace is a dockable tab on the left part of the NVGAte interface it holds 3 main themes of the analyzer interface.
| |
|
| |
|
| Analyzer Setting Browser (ASB)
| | Finally click on [[Image:DisplayButton.png]]to display: |
|
| |
|
| The analyzer is controlled through a tree of settings called the Analyzer Setting Browser (ASB). This tree consists of a set of modules that allows to setup the signal acquisition, play back and processes.
| | [[Image:AddOrderProfile.png|400px|none]]<br> |
|
| |
|
| '''Note''': The "information" icon [[Image:Usersmanual_134.png]]may be found next to a setting. It means you cannot change the setting value.
| | The [[NVGate_Display#Profile|profile graph]] is now displayed on the current [[NVGate_Project_manager#Layout|layout]] along with the [[NVGate_Display#Spectral|FFT spectrum graph]] : |
|
| |
|
| '''Tip''': When using the right click on any item from the ASB, you can copy the value(s) contained in the selection (it can be a module, collection, sub-module or just a setting) and paste it (them) into another item which contains compatible value(s). It is also possible to drag and drop a scalar type setting [[Image:Usersmanual_135.png]]from the ASB to a displayed window (for example the center frequency of the FFT Zoom).
| | [[Image:Complete setup.png|700px|none]]<br> |
|
| |
|
| ======Ways of editing a setting======
| | We will now need to add and declare the tachometer. To do so, select ''Add : Ext. Sync. 1'' under ''Tachometer'' : |
| Right click on an item and select '''Properties. '''You can check your setup and also change the settings in real time by double-clicking on the cell you want to change. The drop-down menu or the mouse wheel can also be used.
| | [[Image:AddTach1.png|400px|none]]<br> |
| | And set the threshold, coupling and Pulse/rev as recommended for your sensor : |
|
| |
|
| A setting can be set to its default value by right-clicking on it and by selecting '''Set to default'''.
| | [[Image:SetupTacho.png|900px|none]]<br> |
| | Please visit [[NVGate_Tachometer#Ext._Tach| the external sync tachometer page]] for more details. |
|
| |
|
| [[Image:Usersmanual_136.jpg|framed|none]]
| | =====Displaying the recorder===== |
| | In order to have a complete view of the measurement, you can display the recording of the raw signals by clicking on ''View recording'' . |
|
| |
|
| ======Analyzer states======
| | [[File:view_recording2022.png|500px]] |
| In the analyzer Setting Browser, you can find the analyzer states icons. They were made to show you visually the state of each plug-in analyzer at the same time. Follow the icon descriptions:
| |
|
| |
|
| [[Image:Usersmanual_137.png]] | | =====Performing and saving the measurement===== |
| The plug-in analyzer is stopped
| | We will now perform the measurement during a run-up of the motor. To do so, put the motor at its lowest speed, start the acquisition by clicking on [[Image:RunIcon.png]], and then stop it with [[Image:StopIcon.png]] once you reached the top speed. You will see the graph updating with the last result.<br> |
|
| |
|
| [[Image:Usersmanual_138.png]] | | The save measurement window will then be opened. You can fill it with the maximum of information to help ease archiving and the sharing of the data: |
| The plug-in analyzer is running
| | [[Image:SaveMeasurement.png|500px|none]]<br> |
| | =====Project manager===== |
|
| |
|
| [[Image:Usersmanual_139.png]] | | And you can find the saved data under the Project name in the [[NVGate Project manager|Project Manager]] : |
| The plug-in analyzer is paused | | [[Image:ResultsSaved.png|framed|none]]<br> |
| | The red area represents the [[NVGate Recorder|recorded temporal raw data]], the green area the [[NVGate FFT Analyzer|FFT]] results and the blue area the [[NVGate Synchronous Order Analysis|Order tracking results]]. |
|
| |
|
| [[Image:Usersmanual_140.png]]
| | =====Display===== |
| The plug-in analyzer is recording
| |
|
| |
|
| [[Image:Usersmanual_141.png]]
| | The acquisition is now complete and the results are displayed . |
| The plug-in analyzer is waiting for a trigger: defined Event or Manual ( | |
| [[Image:Usersmanual_142.png]]
| |
| )
| |
|
| |
|
| [[Image:Usersmanual_143.png]]
| | =====Display overview===== |
| The plug-in analyzer is waiting for the user answer: Accept (
| |
| [[Image:Usersmanual_144.png]]
| |
| ) or Reject (
| |
| [[Image:Usersmanual_145.png]]
| |
| ) the signal
| |
|
| |
|
| [[Image:Usersmanual_146.png]]
| | [[Image:Usersmanual_165.jpg|700px|none]] |
| The plug-in analyzer is failed (the analyzer is not able to do the data acquisition anymore; a warning message will appear)
| |
| | |
| Modules
| |
| | |
| There are 4 types of modules:
| |
| | |
| [[Image:Usersmanual_147.png]]
| |
| The sources that acquire store and play back signals
| |
| | |
| [[Image:Usersmanual_148.png]]
| |
| The resources that provide events, filters, weighting windows, and tachometers to the plug-in analyzers
| |
| | |
| [[Image:Usersmanual_149.png]]
| |
| The plug-in analyzers that process independent analysis modes
| |
| | |
| [[Image:Usersmanual_150.png]]
| |
| The Waterfall that synchronizes the results computed by the plug-ins
| |
| | |
| The modules contain different functions located on '''sub-modules'''.
| |
| | |
| A '''collection'''
| |
| [[Image:Usersmanual_151.png]]
| |
| is a box that contains a group of sub-modules of the same type (inputs, filters, channels, etc.). The sub-modules of collection can be active (visible) or inactive (hidden). Right click on it to add/remove channels.
| |
| | |
| The '''settings''' are inside the sub-modules. The ASB has a maximum depth of 3 levels: module, sub-module and setting. In the case of multiple similar sub-modules (inputs for example), the user sets his analyzer simply by changing the settings. The settings are grouped in families:
| |
| | |
| * The scalar settings
| |
| [[Image:Usersmanual_152.png]]
| |
| are every numerical value which can be entered from the keyboard.
| |
| * The label settings
| |
| [[Image:Usersmanual_153.png]]
| |
| are every character string which can be entered from the keyboard.
| |
| * The enumerated settings
| |
| [[Image:Usersmanual_154.png]]
| |
| are a selection of an item from a list (items are character strings or numbers).
| |
| * The Table setting is a group of values
| |
| * The Matrix setting is selection of a matrix<nowiki>’</nowiki>s intersections
| |
| * The Boolean setting
| |
| [[Image:Usersmanual_155.png]]
| |
| allows activating or deactivating functions (inputs, auto-calibration, zoom…)
| |
| | |
| =====Project Manager=====
| |
| The Project Manager is used to store all your projects, results and measurements…. There are several display options that enable you to show or hide certain items.
| |
| | |
| '''Tip''':''' '''you can drag and drop any type of result from the Project Manager to the windows top to display the result window.
| |
| | |
| The Project Manager is made up of 3 main parts: the '''Workbook''', the '''Project''' and the '''Measurement'''.
| |
| | |
| ======Workbook======
| |
| | |
| [[Image:Usersmanual_156.png|framed|none]]
| |
| | |
| ======Project======
| |
| | |
| [[Image:Usersmanual_25.png|framed|none]]
| |
| | |
| [[Image:Usersmanual_157.png|framed|none]]
| |
| | |
| ======Measurement======
| |
| | |
| [[Image:Usersmanual_158.png|framed|none]]
| |
| | |
| In front of the projects and measurements item, 2 small icon may be present: e.g:
| |
| [[Image:Usersmanual_159.png]]
| |
| | |
| * The icon [[Image:Usersmanual_160.png]]indicates if a project/measurement contains a signal file.
| |
| * The icon [[Image:Usersmanual_161.png]]indicates if a project/measurement contains results.
| |
| | |
| =====Control panel=====
| |
| | |
| | |
| The configurable Workspace area provides quick access to settings and/or ASB status. It looks similar to the "Favorites" in Internet Explorer. The settings can be classified into customizable tabs.
| |
| | |
| '''Tip:''' a setting from the ASB can be added to the Control Panel by right clicking the setting in the ASB and select Add to Control Panel.
| |
| | |
| [[Image:Usersmanual_162.png|framed|none]]
| |
| | |
| ======Customization======
| |
| The control panel is a part of the Workspace. It is used to control the measurement process. It is user-customizable and saved in the current project. Customization can be reached by right clicking on the Control Panel or from the '''Tools '''tab and Customize.
| |
| | |
| [[Image:Usersmanual_163.png|framed|none]]
| |
| | |
| '''Tip:''' Use drag and drop to add a setting from a place to another. The destination tab must be compatible with the setting you try to add to.
| |
| | |
| ====Displays====
| |
| Different windows which contain one or several graphs or traces can be created. You can also add or remove some information in the Infotrace using the Infotrace properties. Manage all the display settings using the right click on almost any area. For each result type there are different available options using the right click.
| |
| | |
| [[Image:Usersmanual_165.jpg|framed|none]] | |
| | |
| =====Multi-graphs windows=====
| |
| A graph is the area where traces are displayed. A multi-graph window contains several graphs which display signal from the same source or plug-in analyzer. The graphs can be displayed with different physical quantities.
| |
| | |
| =====Multi-traces=====
| |
| You can display several traces in the same graph. You can also display in multi-trace 3D mode.
| |
| | |
| Multi-traces display is not available for Waterfall displays.
| |
| | |
| The trace represents a signal or a result.
| |
| | |
| =====Cursors=====
| |
| The cursor is displayed when cursor mode is selected: Used to move the cursor by left clicking and dragging.
| |
| | |
| Select [[Image:Usersmanual_166.png]]from the Measurement tab in the Graphs group in order to activate the cursor mode.
| |
| | |
| =====Markers=====
| |
| | |
| [[Image:Usersmanual_10.png|framed|none]]
| |
| | |
| Select a type of marker from the Display/Graphs tab in the Markers group in order to activate the marker mode.
| |
| | |
| To add a marker on a graph, double click on the graph. Obtain information about a trace by using the marker table.
| |
| | |
| =====Scales=====
| |
| The scale displays the magnitude and the grid of the graph.
| |
| | |
| =====Infotrace=====
| |
| Displays information about the graph:
| |
| | |
| '''Graph mode''': magnitude, real…
| |
| | |
| '''List of traces with their status''': available or not/displayed in all areas or not/not displayed. You can move into the ''infotrace'' to select a specific trace and to follow cursor<nowiki>’</nowiki>s value of this trace. Memorized traces are also displayed in the list.
| |
| | |
| * '''Overall levels''': displays the RMS level in 2D windows containing spectra or time signals
| |
| * '''Cursor information''': x,y, order, dx, dy if available
| |
| * Marker arrays
| |
| Using keyboard arrow up/down, you can select the active trace in the ''infotrace''.
| |
|
| |
|
| =====Contextual menus===== | | =====Contextual menus===== |
| Right click on the graph provides access to the scale, zooms and X/Z axis references of the current graph. | | Right click on the graph provides access to the scale, zooms and X/Z axis references of the current graph. |
|
| |
|
| [[Image:Usersmanual_167.jpg|framed|none]] | | [[Image:Usersmanual_167.jpg|700px|none]] |
|
| |
|
| Right click on the window to access the local windows properties and actions on the contained traces. | | Right click on the window to access the local windows properties and actions on the contained traces. |
|
| |
|
| [[Image:Usersmanual_168.jpg|framed|none]] | | [[Image:Usersmanual_168.jpg|700px|none]] |
|
| |
|
| Right click on the ''infotrace'' allows customization of the displayed information. | | Right click on the ''infotrace'' allows customization of the displayed information. |
|
| |
|
| [[Image:Usersmanual_169.jpg|framed|none]] | | [[Image:Usersmanual_169.jpg|700px|none]] |
| | |
| | ===Conclusion=== |
| | Congratulation you have done you're first measurement with NVGate. |
| | |
| | The [[NVGate_Ribbons:_Home_Tab|home tab]], let you a quick access to all this settings, and more! : |
|
| |
|
| ----
| | [[File:home3.PNG|800px]] |
Starting the analyser and NVGate
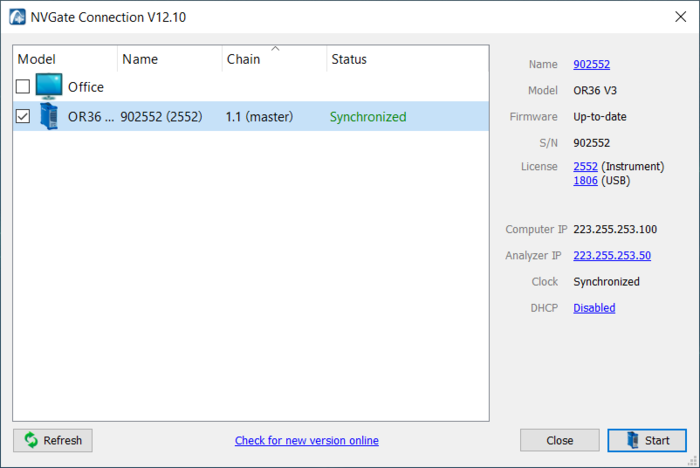
First of all, connect your analyser to the computer and power it on. Then double-click on the NVGate Icon from your desktop. The connection dialog appears. Select operation mode (Connected, Office or multi-instruments).
Select the analyser and click on start.
The NVGate splash screen will automatically appears.
Open/create a project
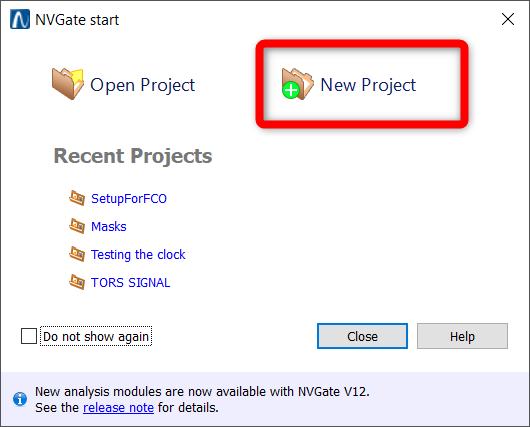
NVGate will start and the Start dialog is proposed:
Here we will create a new project :
This window is also accessible from the NVGate Ribbon.
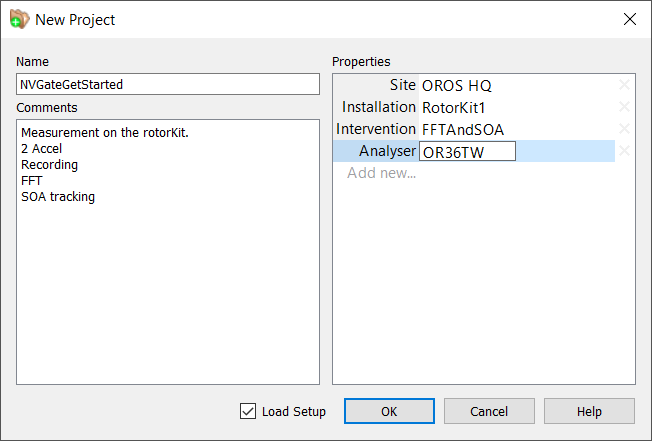
This will open the "New Project" definition window. Fill up the necessary properties and comment to describe the context of this project. Check the Load setup box and click on the Ok button.
Load the configuration
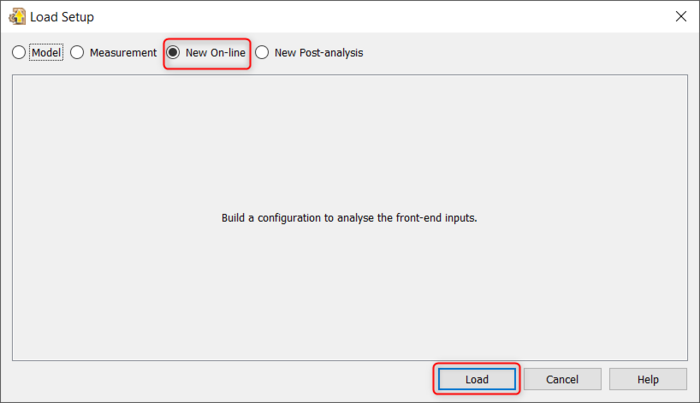
This will open the Load setup window. This window allows you to load the configuration from a pre-saved model, a previous measurement, create a new setup or opening a signal for post-analysis. Here we want to setup a new configuration, we will select New On-Line :
Select the inputs
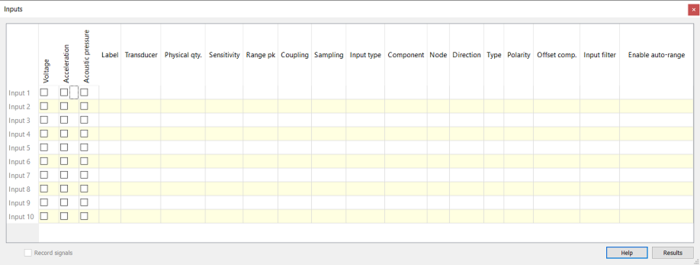
Once you click Load, the input setup window appears :
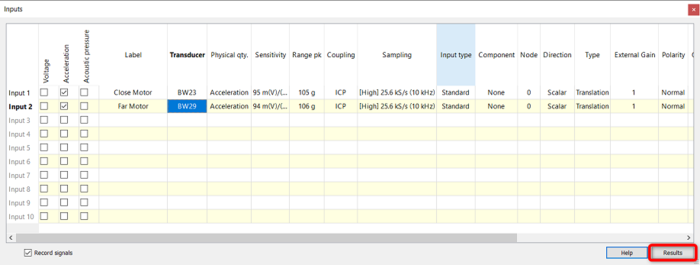
This window can be called anytime from the GoToResult. See Input selection for the detail of the parameters.
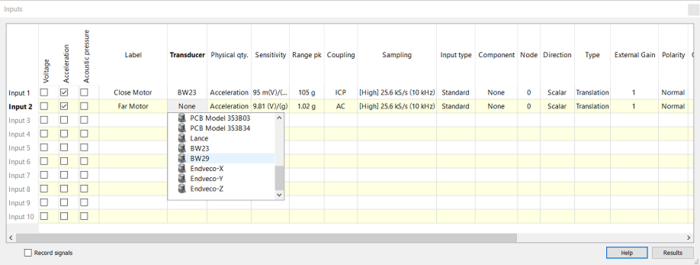
As we use 2 accelerometers, select check the "Acceleration" boxes for inputs 1 and 2, and select the appropriate sensors in the "Transducer" column for each inputs. If you don't see your specific sensors, please fill your transducer database.
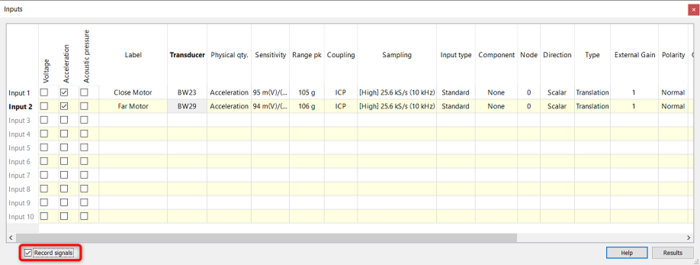
To add the inputs into the recorder, check the Record signals box :
By doing this, any inputs (even if added later) will automatically be connected to the recorder plug-in.
Edit the Sampling Rate
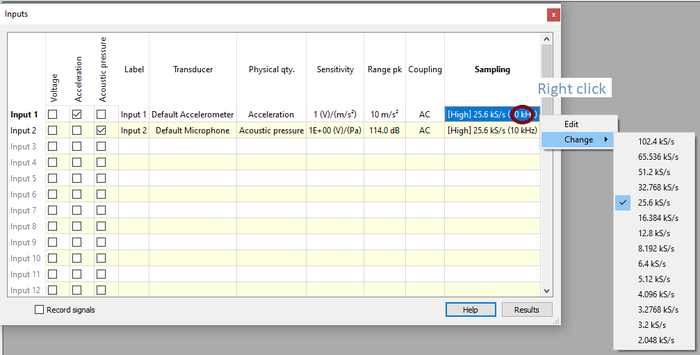
The sampling rate is the rate to which the signals will be sampled by the analyzer. This will define the maximum frequency that can be analyzed during the online analysis or in post-analysis on the recorded signals. However, a higher sampling rate will need more computational power. You may choose a sampling rate that is twice the highest frequency you want to analyze.
To edit the sample rate, do a right click on the sampling case.

Here we have a 25,6kS/sec that allow us to analyze the data up to 10kHz.
Setup the analysis
Once the inputs are correctly declared, click on Results to setup the analysis :
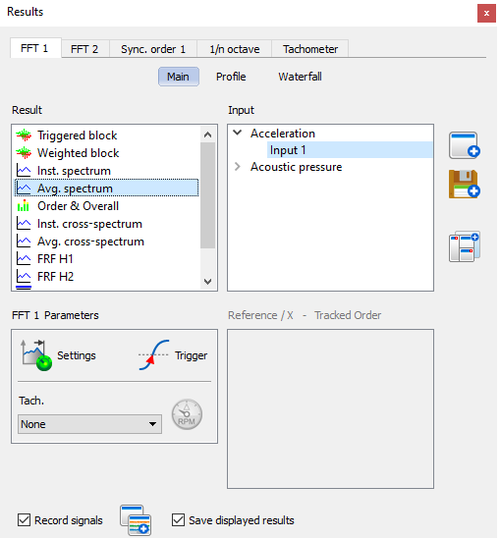
This will open the Results window :

This window can be called anytime from the GoToResult icons. See the Show result section for detail about this window.
Displaying the FFT analysis
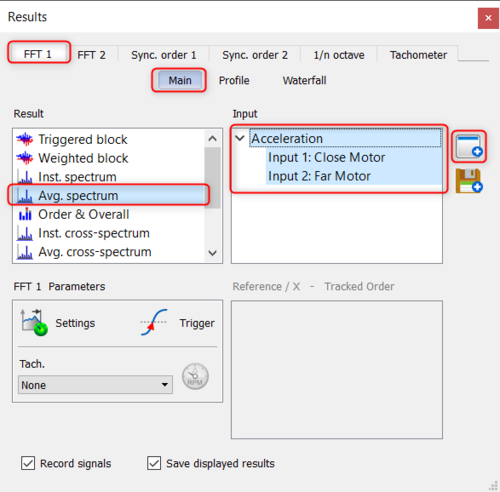
We will now display the average spectrum for the two inputs :

Once you selected the result you want to display, click on  to display the graph in the current layout.
Make sure you checked the box Save displayed results to save the result at the end of the measurement.
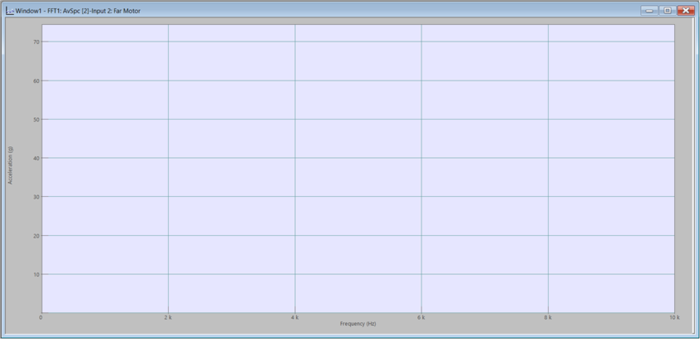
The FFT graph window now appear in the current layout :
.
Setting up the FFT analysis
We can now setup the FFT to optimise the analysis. To access to the setup parameters, click on settings in the Show result window :
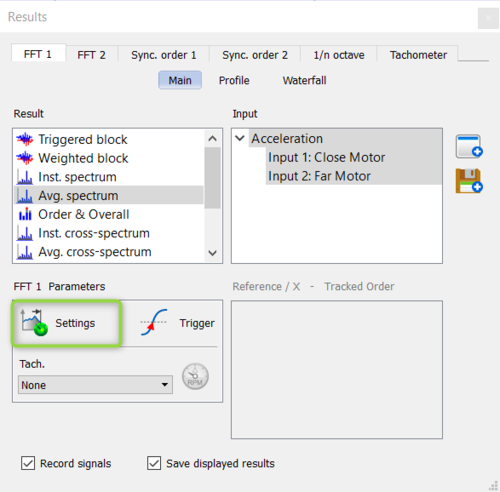
Here, the maximum speed of the motor is 2000RPM. That make the first order at 2000/60 = 33Hz and the tenth order at 330Hz. In order to optimize the computation, we will then limit the FFT bandwidth to 5kHz, the overlap to 67% and the number of lines to 1601 to have a correct precision.
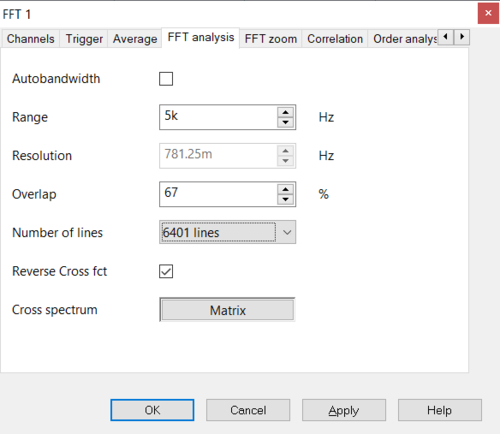
You can then press OK to close this window. For details about the parameters, please visit the NVGate FFT page.
Adding Order Profile
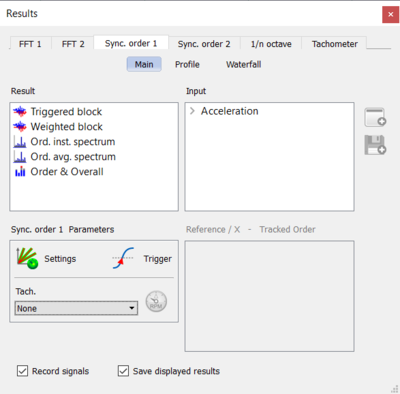
We can now setup and display the order profile. To do this, select the Sync. order 1 tab of the Result window.
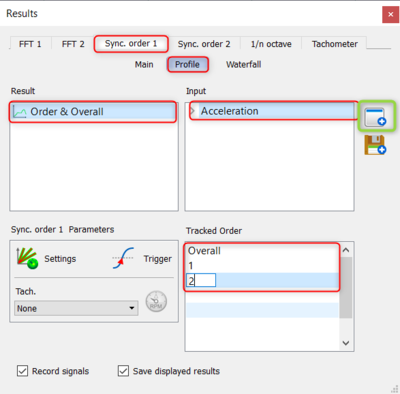
Here, we want to display the first two orders profile for each input. To do so, select the profile tab, and select Order & Overall under Result and Acceleration (that will select the 2 acceleration channels) under input. To track the 2 first orders, you can simply enter 1 and 2 under the Tracked Order section.
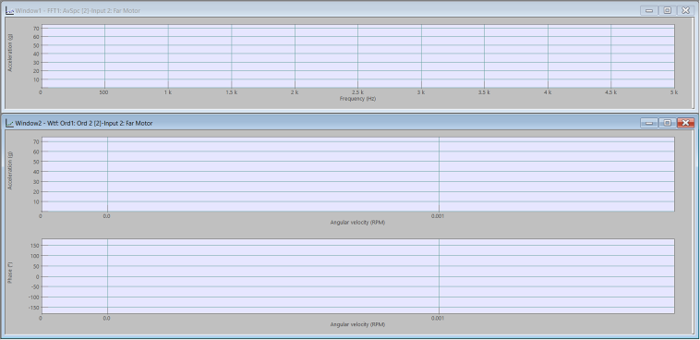
Finally click on  to display:
The profile graph is now displayed on the current layout along with the FFT spectrum graph :
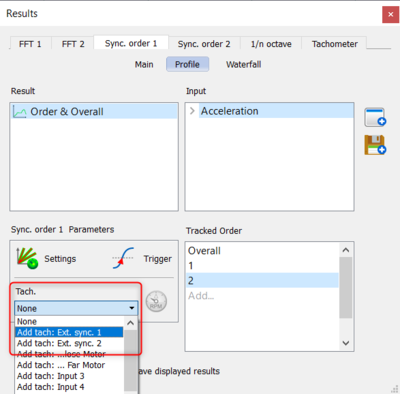
We will now need to add and declare the tachometer. To do so, select Add : Ext. Sync. 1 under Tachometer :
And set the threshold, coupling and Pulse/rev as recommended for your sensor :
Please visit the external sync tachometer page for more details.
Displaying the recorder
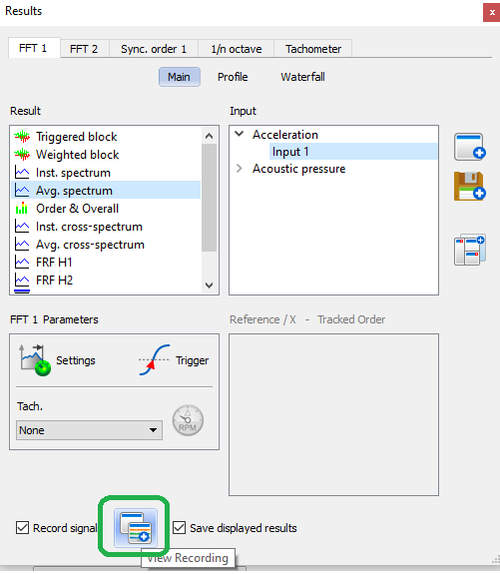
In order to have a complete view of the measurement, you can display the recording of the raw signals by clicking on View recording .

Performing and saving the measurement
We will now perform the measurement during a run-up of the motor. To do so, put the motor at its lowest speed, start the acquisition by clicking on  , and then stop it with
  once you reached the top speed. You will see the graph updating with the last result.
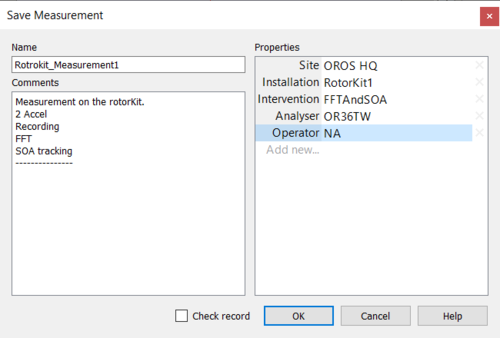
The save measurement window will then be opened. You can fill it with the maximum of information to help ease archiving and the sharing of the data:
Project manager
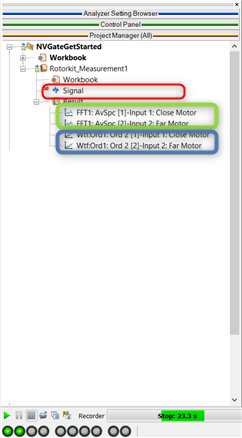
And you can find the saved data under the Project name in the Project Manager :
The red area represents the recorded temporal raw data, the green area the FFT results and the blue area the Order tracking results.
Display
The acquisition is now complete and the results are displayed .
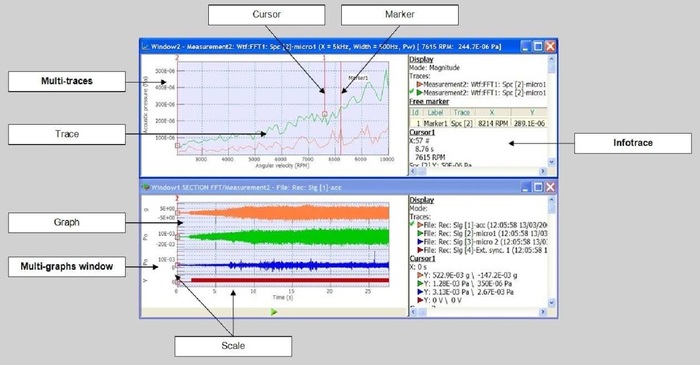
Display overview
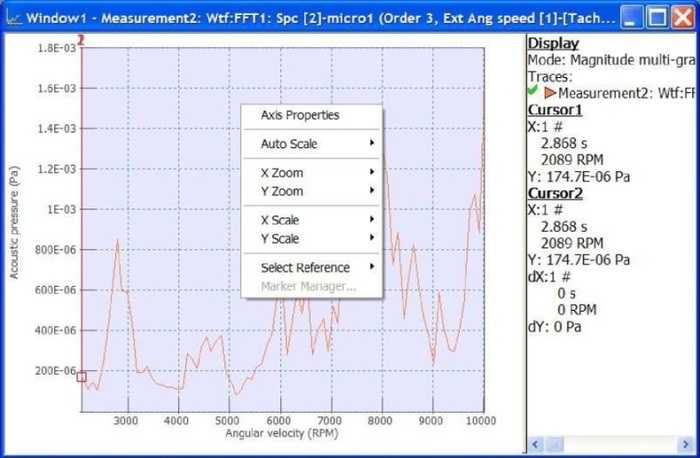
Right click on the graph provides access to the scale, zooms and X/Z axis references of the current graph.
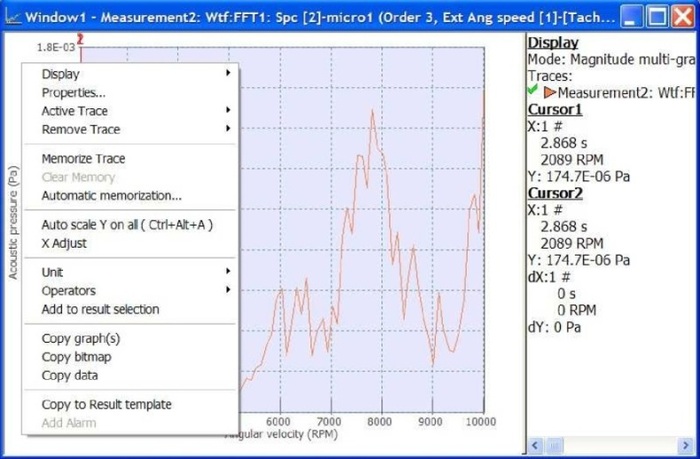
Right click on the window to access the local windows properties and actions on the contained traces.
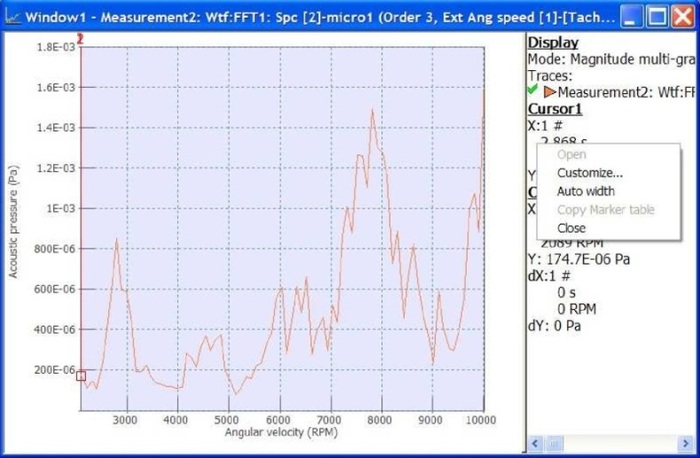
Right click on the infotrace allows customization of the displayed information.
Conclusion
Congratulation you have done you're first measurement with NVGate.
The home tab, let you a quick access to all this settings, and more! :

![]() to display the graph in the current layout.
to display the graph in the current layout.

![]() , and then stop it with
, and then stop it with ![]() once you reached the top speed. You will see the graph updating with the last result.
once you reached the top speed. You will see the graph updating with the last result.