NVGate Ribbons: Home Tab
The goal of the Home tab is to make a user friendly tab for doing a measurement.
You can load a project, create a setup (using the "go to results" group), start an acquisition, see your data, the disk space and change the user.
In fact for a lot of every day application you can stay on this tab, no need to check the other one.
Go to result group
Online mode
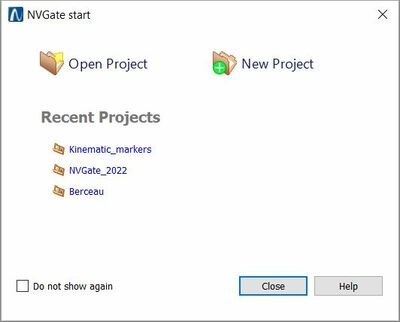
| Start...: Opens the NVGate start dialog which is dedicated to make the first steps in the software.
Note: The NVGate start dialog is also displayed at each NVGate Start except if the user checks the option Do not show again in the dialog.
| |||||||
| Online to Post-analysis: This button is used to switch from Online mode to Post-analysis mode. This will open the Select Signal window which lists all the recorded signals available. The selected signal will be then playback and can be re-injected into any plug-in analyzer (Monitor, FFT, 1/n Octave...). It is also possible to play back a recorded signal through the Output during Online analysis.
See player page for more details. | |||||||
| Select inputs: Opens the Inputs selection dialog which allows activating and setting-up the dynamic inputs in a fast and smart way. | |||||||
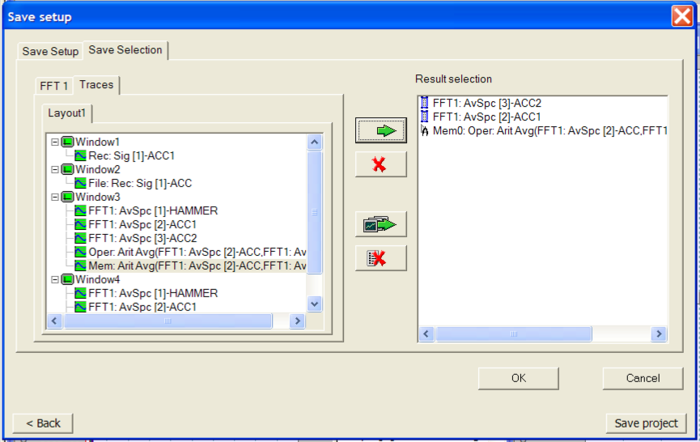
| Show results: Opens the Results dialog which allows displaying and saving results without connecting inputs or tracks to the plug-in analyzers in advance. | |||||||
| Results overview: Opens the Results overview table which summarizes all the displayed and saved result (i.e. present in the Save Selection list) |
Post-analysis mode
Measurement group
Note that another Run/Pause/Stop button is always available in the status bar (bottom left)
Save group
Setup group
| Load setup: Open the Load setup dialog, which allows loading setups from Models, Measurements and Projects or creating setups for online or post-analysis. | |
| Save as model: Enable to save the current setup as a Model. | |
| Active model: Display the name of the loaded Model. This Model will remain active until a Reset setup is applied or another setup is loaded. | |
| Reset: Close the active Model and set all parameters to the default values. |
Data group
Attachment: Enable to quickly identify if files (reports, pictures, videos....) are attached to the current project. Note: if the "Default project" is active, the Attachment button is greyed.
| |||||
| Filter projects: Open the Filter Project dialog, which enables selecting the projects to be visible in the Project manager. |
Disk group
| Record: Display and enable selecting where the recording is performed (analyzer's disk or computer disk) or to stop temporarily the recording (off). | |
| Used space: Give a visual overview of the space available on the disk. | |
| Download: Open the Disk manager dialog, which lists the signals available on the analyzer's disk and enables selecting the signals to be downloaded on the pc. |
User
User: This button allows selecting the current user. Note: changing from one user to another one will reset the current NVGate analysis configuration to the default one defined by the new user.
old to delete !!
Start Group
This group gathers the entry points for setup selection or building tools as well as the access to the different software modes (measurements editor, post analyze, model load).
Start… Open the NVGate Start dialog which is dedicated to make the first steps in the software. The start dialog is also displayed at each NVGate Start until the user deactivated the option in the bottom left of the dialog.
- Entering in a project
While launching NVGate or click on this button, operator is invited to select or create a project. This step allows reloading or defining the context.
Selecting Open Project opens the Open Project dialog which behaves as the single Item selection.
Select your project and click Open button.
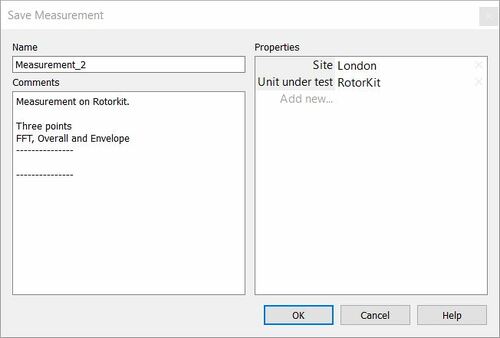
Selecting New project opens the following dialog:
Fulfill the necessary properties and comment to describe the context of this project and click on Ok button. This bring you to the setup
Select Inputs
Available from both the bottom bar and Home\Start\Select Inputs this window allows selecting the inputs to be used and setups their acquisition.
See the GoToResult page for more information.
Post analysis
This button is used to playback recorded signals that can be computed in post analysis mode. In this way you can re-inject the recorded signals into any plug-in analyzer (Monitor, FFT, 1/n Octave...). It is also possible to play back a recorded signal through the Output during On-line analysis.
Press the Post Analyze button. This will display a selection of signal files available for post-analysis:
See player page for more details.
Edit Measurement
The Edit measurement allows reviewing the measurements for comparison, modification or report. An edited measurement comes as a foreground layer on the top of the current analysis one.
Measurement edition is available from the ribbon Home/Start/Edit Measurement.
When a Measurement is edited it is possible to update it and/or to make a report.
Please see the "Edit DOF" video :
Setup Group
In both above open project cases, the project is opened, no setup is loaded. The Setup is loaded further this first action. There are few ways to load a setup prior being ready for acquisition and analyses.
Check the Load setup box in the open project dialog in order to select the setup while exiting the Open project one.
Use the Home/Setup/Load ribbon button.
The load setup dialog behaves as a single Item selection. It allows loading setups from Models Measurements and Projects or creating setups for on-line or post-analysis:
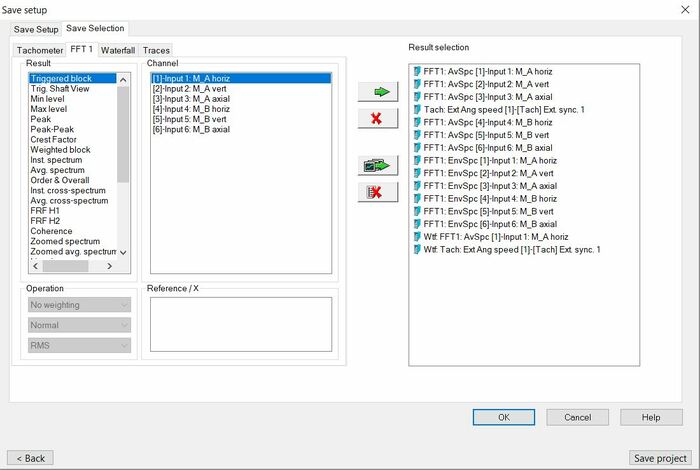
While in Model or Measurement load, the details section (right bottom side) shows which results are saved by the selected setup.
Load a Model: Loaded Models offer additional features;
- Model properties will inherit to the measurements
- Loaded Model name reminded in the Ribbon; Home/Setup with the icon. This Model will remain active until a reset setup is applied or another setup is loaded.
- When the measurement are shared out of NVGate or collated to NVGate the associated model will be transferred with the measurement.
- Loaded Model can be modified to adjust to current situation. The modified setup is saved in the Measurement, but the original Model remains unmodified. This allows providing predefined setups which are not modified by specific usage (adjustments, operator's error, etc.) ensuring reproducibility.
- You can modify and save the setup with the Home/Setup/save as model button . Associated model properties will be proposed in the save as model dialog. This allows updating an existing Model keeping its properties.
Load a Measurement's setup: The setup used to generate the results of the selected Measurement will be reloaded.
This feature allows reproducing faithfully exiting measurements for prototyping fine tuning or trend analyses. OROS recommend saving all repeated measurements in the same project.
Create a setup from scratch: This sis available for on-line or post-analysis. Both options will reset the current setup to default values before building the new setup.
- On-line opens the Channel selection dialog as usual.
- Post-analysis will first require selecting a file to be analyzed with the Select signal dialog. Similarly to select model one the right side of the dialog shows the Measurement properties. This information allows rapidly finding the searched signal.
Pre-defined setups
OROS provides various predefined models that contains basic and advanced setup examples of analysis. These setups are available from the Load Model dialog.
This setup contains customized items:
- Front-end setup
- Analysis setup
- Layouts
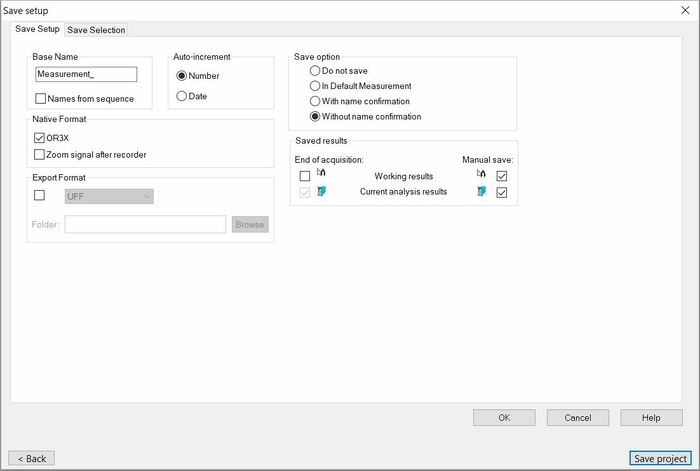
- Save setup
- Control panel
Select the Tree view in the Load setup dialog to see the directories using the Flat/tree button
Tree view
Quick directory contains setups of the instrument for either post-processing or on-line analysis.
The mapped directory is the quick directory in the workbook library which is defined in the NVGate Environment paths. Default is: C:\OROS\NVGate data\Workbook Library\Quick\. It is possible to add additional models in this directory according to your organization chart.
Quick Models name defines the characteristics of the corresponding analyses:
AAA_M_W_N
- AAA is the analysis mode (FFT, REC, ORD, etc..)
- M is the mode: O=On-line, P=Post-analysis
- W is present for waterfall results (profile, 3D)
- N is the number of channels
Advanced Models
This directory shows applications-oriented examples.
The mapped directory is the advanced directory in the workbook library which is defined in the NVGate Environment paths. Default is: C:\OROS\NVGate data\Workbook Library\advanced\.
User’s models
This directory holds the Models saved by the users of the NVGate installed in the current PC.
Working set
Even if the Share/Collate features allow reducing the number of data directly available in the working set (NDLR the NVGate environment), it is useful being able to reduce the visible Items to the current concern. The Filter Project provides such selection.
Filter project
This function selects what is visible in the working set. It is available from the ribbon: Home/Working Set/Filter Project.
Use the filter and columns sorting to select which set of Project/Measurements will be visible. Click on Filter to view only selected Items, select No Filter to view all Items.
The visibility filtering applies on all Item Selection Browsers, Set Selection Browsers and Project Manager.
Workspace: show/Hide the workspace windows that contains the Analyzer Setting Browser (ASB), the Project Manager (PM) and the Control Panel (CP).
Only one panel is displayed at a time. The user may switch between panels by clicking on the title bar of the desired sheet.
Log window: This windows track all changes in the analyzer. Logs are arranged in 3 separate tabs:
- Analyzer settings: Display all users’ and dependencies related changes in the ASB.
- Warning: Displays dynamic warnings related to the current setup (ex A & C acoustic filters are no more available when the sampling frequency is lower than 25.6 kHz). Raising a warning will automatically show the log window during 3 sec.
- Macro trace: log window for macro execution and debugging.
Recommended location: Bottom, Docked
Status: Displays the current status of the plug-ins (see chapter 1 ASB for details). General statuses are displayed in the bottom status bar, the Status window is made to show advanced status for accurate control of the acquisition/analyses. To add the statuses in this window, right click in the selected plug-in and select View states
Recommended location: Bottom, Docked
Example for the FFT plug in you may display:
- Block Overload: corresponds to the instantaneous overload indication within 1 FFT trigger block, for instance during a few milliseconds overload occurred, the current trigger block indicates overload, the following trigger block may not have any overload so indication "no overload" will be seen
- Analysis Overload: corresponds to overload indication over the measurement period. It means that during the whole measurement period there was (or not) an overload.
For instance: during a measurement, a short overload occurs, Block Overload will indicate "Overload on Channel x", Analysis Overload will indicate "Overload on Channel x", after overload occurred, Block Overload will indicate "No Overload", Analysis Overload will indicate "Overload on Channel x".
When pressing run again, Block Overload and Analysis Overload status will be reset.
When using Automatic overload rejection in FFT, Analysis Overload status take into account any occurring overload despite FFT block rejecting them for FFT calculation, the user will anyhow keep a trace of occurred overload.
These windows can be docked or floating. Environment windows are to be displayed temporarily for advanced setup. It is recommended to hide these windows for standard measurement/analyses.
Preferences group
These buttons provide direct access to the user’s preferences.
The user’s preferences are gathered in one unique dialog with multiple tabs. It is possible to navigate in these tabs from any of the entry point (the described buttons).
SeeUser Preferences for details
- File:Reports Tools Ribbons 238.png General: Enter the preferences setting at the 1st tab. It allows customizing the scales font size, the refreshing speed as well as default specialized modes
- File:Reports Tools Ribbons 239.png Units & Quantities: Open the physical quantity tabs of the user’s preferences. It allows creating, modifying and removing the units and physical quantities used by the NVGate interface.
Reminder: NVGate process SI units. The selected Units with are used for display only, the data are not modified by the units changes.
- File:Reports Tools Ribbons 240.png Data Management: Open the measurement properties setup. This tool allows managing the default and user defined properties. These property values are saved with the measurement and used to qualify it. Later, they may be incorporated into reports and for search functions.
This function transfers Projects, Measurements, Models and associated attachments from the NVGate Data to a common directory and reciprocally.
These transfers operate in both direction; Share data from the NVGate PC to a common base ; Collate the data from a common base to the PC. The target/source directory can be in the PC, on the LAN or on an external device.
Most of transfer conflicts and errors are automatically managed especially the merge of Projects, Measurements and Attachments. Most of them are solved automatically.
In case of ambiguous conflicts, operator is asked to provide the action in a Windows style .
When possible, source and target directory are accessible through the hyperlinks.
Data Traceability Each transfer (share and Collate) generates a report in 2 ways:
The Datasets are shareable from the ribbon Home/Dataset:
The Share Dataset dialog behaves as multi-selection featuring the following extra settings:
1. The path of the target directory. Shared Items will be deposited at the root of this directory for the Project/Measurement hierarchy. Models will be deposited in a subfolder named "Folder".
Used targets are memorized and made available with the down arrow at the right.
2. Selection of what will be shared.
- Project/Measurements will transfer selected Projects and Measurements. The Models associated with selected Measurements will also been carried on.
Used to share measurement data with their setups. - Models: Only the selected Models will be transferred.
Used to spread Models to the measurement teams.
3. Define how to transfer:
- Copy keeps the data on the NVGate data locally while transferring a copy of selected ones
- Move, first copies the dataset and then delete the copied from the NVGate data.
- Include signals carries on the time series files when selected. Leave the time series files on the local NVGate data when unselected.
Note: In order to avoid data loss, the Include signals is forced to "select" when Move is chosen.
Note: that Share can also be used for dataset backup on the NVGate PC, an external disk or on the network.
Collate Datasets
Collate [kəˈleɪt] verb. To gather together information from different sources in order to study it carefully
Sharing data means recovering those data in local NVGate instances. The Collate function allows selecting and gathering dataset from common directories to the local NVGate data.
Collate dataset is available from the ribbon Home/Dataset:
Main difference is that the searched path is not limited at the Source level. The Collate function will take in account in depth hierarchy of the source directory among all its subdirectories.
This allows having a directory structure on the data set common base and being able to search in with the properties only for ones that do not know the directory organization.
Import
Disk group
PC and Mobi-Disc management tools
- Active Disk: Select the active disk. The active disk is the one which is mapped by the project manager. The disk where a signal file is located must be the active one in order to load it on the player (play back, post process, exploration).
The active disk can be:
- The PC one. Available in office mode only.
- One of the Mobi-disk connected through a USB cable. Available in office mode only.
- The Analyzer disk (Mobi-Disk or fixed). Available in connected mode only.
- File:Reports Tools Ribbons 246.png Manage: Open the disk manager in order to manage the signal files saved on it. See "Disk management" topic from Chapter 3: "Hardware Management" for details.
- File:Reports Tools Ribbons 247.pngFormat: Format the active disc. Attention all saved data on the formatted disk will be definitely deleted. Not available when PC disk is selected. See "Disk management" topic from Chapter 3: "Hardware Management" for details.
- File:Reports Tools Ribbons 248.png Download: Select available signal file on the active disk that match the project present on the project manager. To recover signal files from a record session made with another PC use the manage button. See "Disk management" topic from Chapter 3: "Hardware Management" for details.
User group
NVGate operates with users’ preferences and authorizations. Personalized profiles can be memorized and recalled while starting the software.
A user profile contains:
- Default display preferences (colors, scale type, mode, units, etc..)
- Saving modes (default name, incrementing, confirmation mode, data protection and visibility)
- Waterfall (view, default reference, colors, extractions, filling and type)
- Marker (colors, limits, interpolation)
- Report colors palette
- Units for each physical quantity
- Export modes
- Floating/docked windows location and visibility
The User group allows managing NVGate users’ profiles.
- File:Reports Tools Ribbons 249.pngUser button Part 1: It allows selecting the current user. Attention changing from one user to another one will reset the current NVGate analysis configuration to the default one defined by the new user.
- User button Part2: It allows creating and deleting users from the active .usr profile files.
- New: Used to create a new user
First name: First name of the user may be left empty. The first name is automatically formatted so that the first character is in upper case and the others are in lower case letters.
Last name: Last name of the user must be filled in. The last name is automatically formatted in letters.
Password: If selected, the user will have to enter his password to launch NVGate.
Access level
-Full: The user is not limited within NVGate
-Restricted: The user is not authorized to access to all the functions of NVGate. The main characteristics of this type of user are:
| Authorized actions | Unauthorized actions |
|
|
- Administrator: Allows Switching to a non-restricted user profile for administration of the current restricted user rights. In this case the current analyzer setup is not modified.
- Password: Used to change the password. If necessary, the user must enter his current password and then enter the new password twice
Warning: Due to the GUI modifications, the restricted user profile limitations do not apply on NVGate version 7.00 and further until new notification. It is possible to run NVGate7 with the Legacy V6.00 interface to benefit from the restricted user capabilities. For such purpose runs NVGate7 with the following parameter: -legacy
By default the user is named ’Default user". User
The user profiles are saved in a file called NVGate.usr located in the NVGate.exe directory. This file is automatically created at NVGate start when it is absent. Attention: deleting the NVGate.usr file delete all users’ preferences including the default setting proposed by OROS.
It is possible to temporary change .usr file for special applications. To start NVGate with .usr different from the default one (NVGAte.usr) add the following to the command line: -usr=myfile.
Transducer
D-Rec group
This group manages D-rec (Direct recording) setups. D-rec allows recording signals with the analyzer without any PC or connection.
Read D-rec dedicated page for more info


