NVGate Software overview
Starting NVGate
Starting the analyser and NVGate
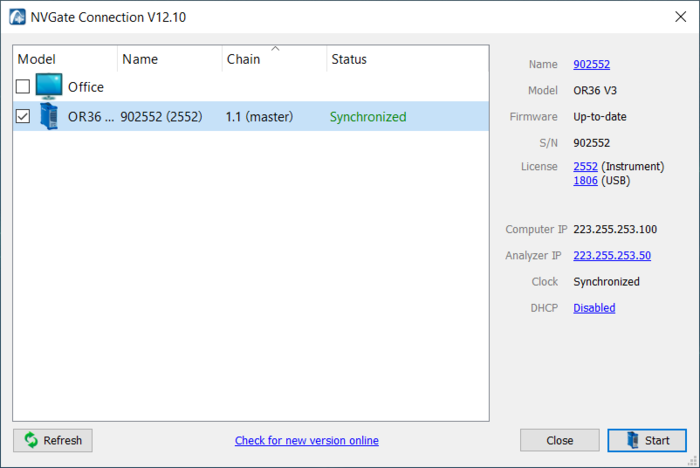
First of all, connect your analyser to the computer and power it on. Then double-click on the NVGate Icon from your desktop. The connection dialog appears. Select operation mode (Connected, Office or multi-instruments).
Select the analyser and click on start.
The NVGate splash screen will automatically appears.
Open/create a project
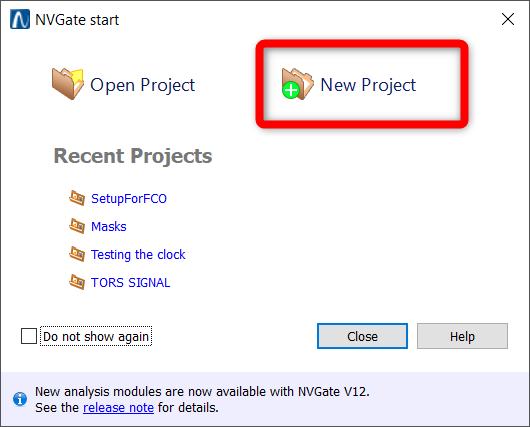
NVGate will start and the Start dialog is proposed:
Here we will create a new project :
This window is also accessible from the NVGate Ribbon.
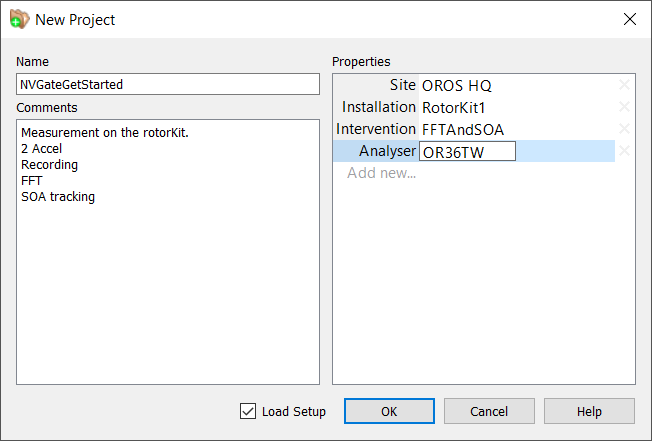
This will open the "New Project" definition window. Fill up the necessary properties and comment to describe the context of this project. Check the Load setup box and click on the Ok button.
Load the configuration
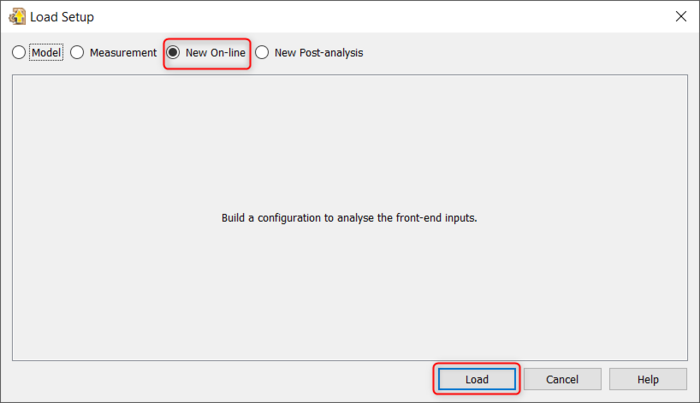
This will open the Load setup window. This window allows you to load the configuration from a pre-saved model, a previous measurement, create a new setup or opening a signal for post-analysis. Here we want to setup a new configuration, we will select New On-Line :
Select the inputs
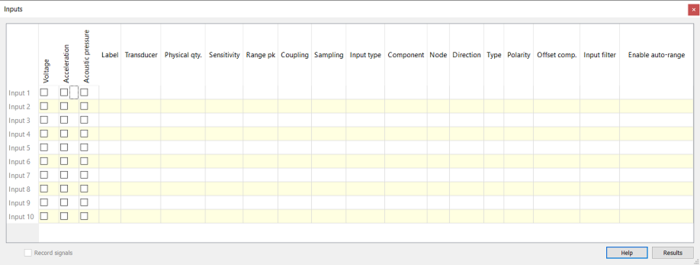
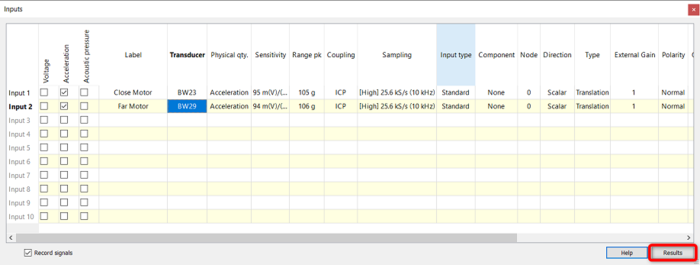
Once you click Load, the input setup window appears :
This window can be called anytime from the GoToResult. See Input selection for the detail of the parameters.
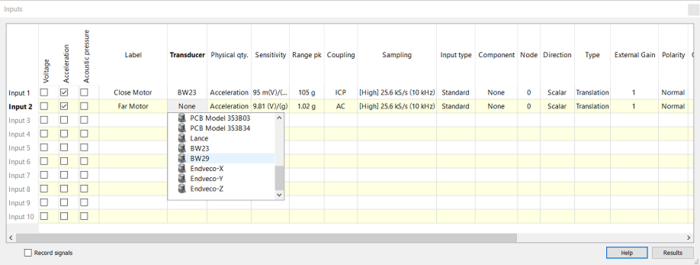
As we use 2 accelerometers, select check the "Acceleration" boxes for inputs 1 and 2, and select the appropriate sensors in the "Transducer" column for each inputs. If you don't see your specific sensors, please fill your transducer database.
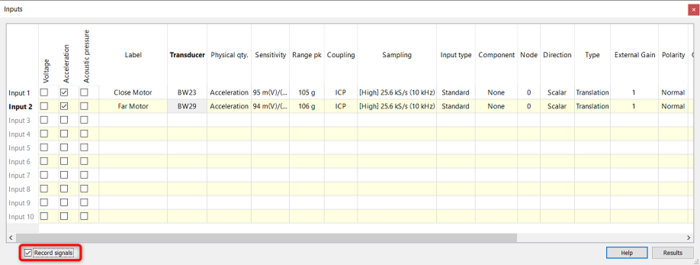
To add the inputs into the recorder, check the Record signals box :
By doing this, any inputs (even if added later) will automatically be connected to the recorder plug-in. This box is also available from the NVGate Ribbon.
Edit the Sampling Rate
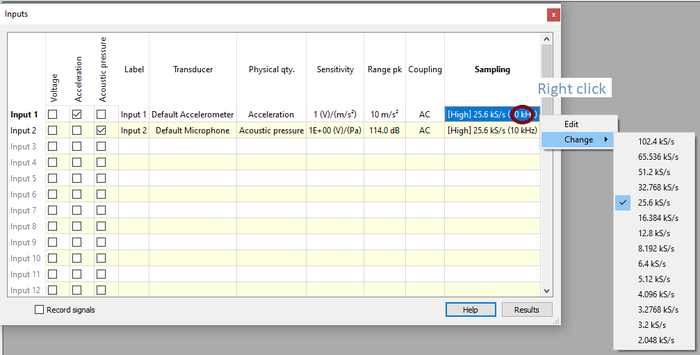
The sampling rate is the rate to which the signals will be sampled by the analyzer. This will define the maximum frequency that can be analyzed during the online analysis or in post-analysis on the recorded signals. However, a higher sampling rate will need more computational power. You may choose a sampling rate that is twice the highest frequency you want to analyze.
To edit the sample rate, do a right click on the sampling case.
Here we have a 25,6kS/sec that allow us to analyze the data up to 10kHz.
Setup the analysis
Once the inputs are correctly declared, click on Results to setup the analysis :
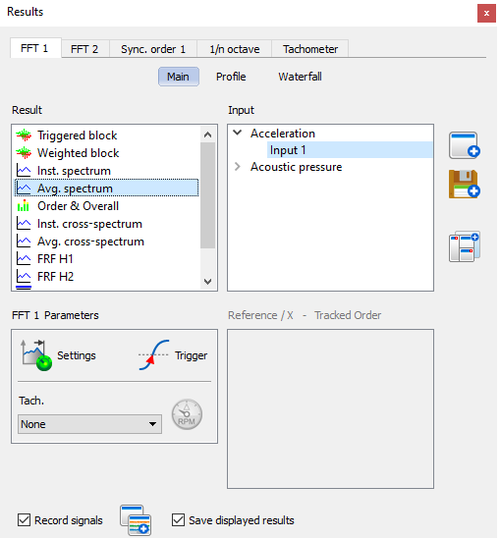
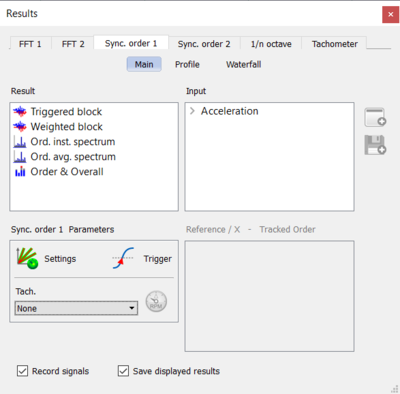
This will open the Results window :
This window can be called anytime from the GoToResult icons. See the Show result section for detail about this window.
Displaying the FFT analysis
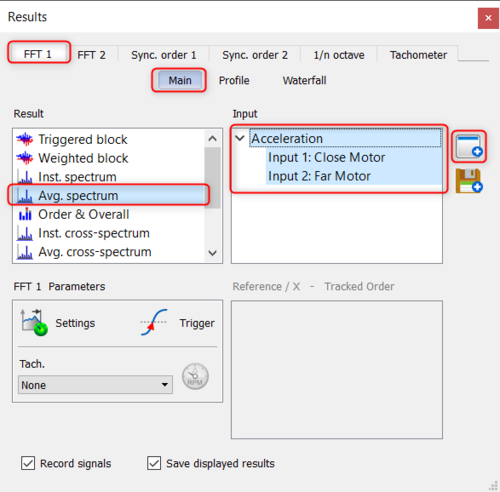
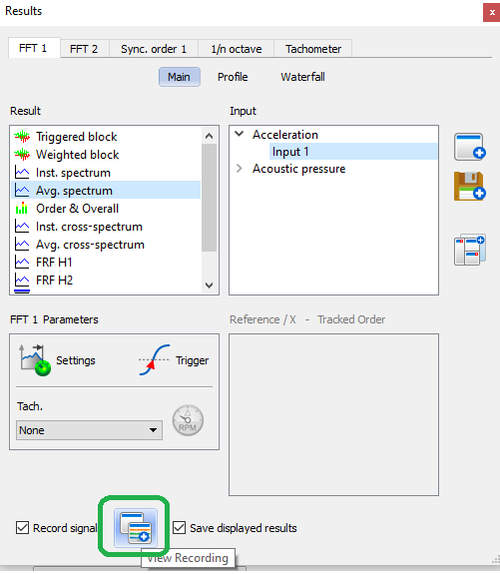
We will now display the average spectrum for the two inputs :
Once you selected the result you want to display, click on ![]() to display the graph in the current layout.
to display the graph in the current layout.
Make sure you checked the box Save displayed results to save the result at the end of the measurement.
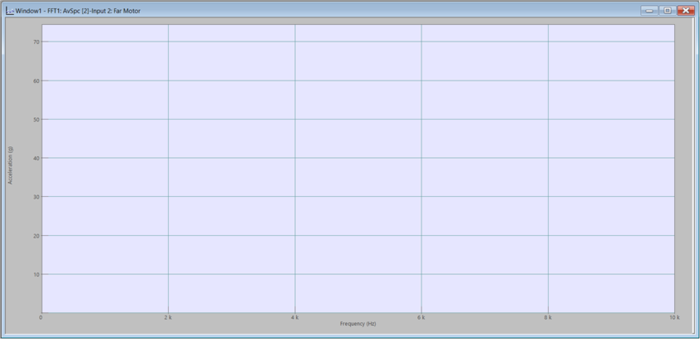
The FFT graph window now appear in the current layout :
.
Setting up the FFT analysis
We can now setup the FFT to optimise the analysis. To access to the setup parameters, click on settings in the Show result window :
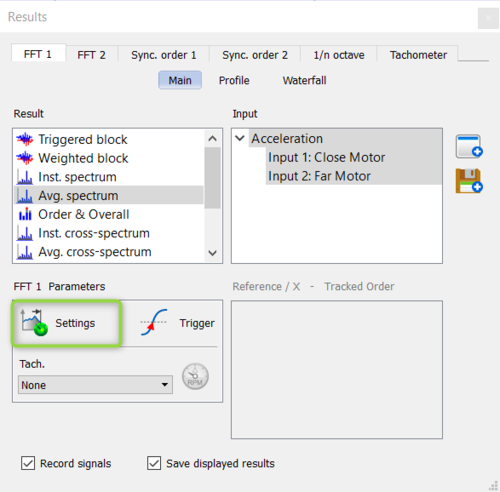
Here, the maximum speed of the motor is 2000RPM. That make the first order at 2000/60 = 33Hz and the tenth order at 330Hz. In order to optimize the computation, we will then limit the FFT bandwidth to 5kHz, the overlap to 67% and the number of lines to 1601 to have a correct precision.
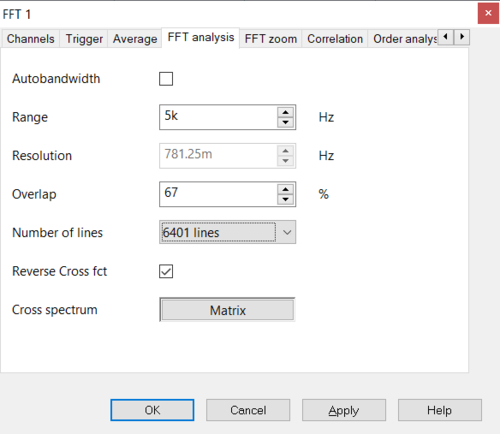
You can then press OK to close this window. For details about the parameters, please visit the NVGate FFT Analyzer page.
Adding Order Profile
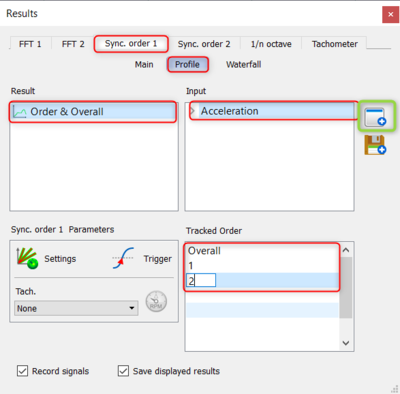
We can now setup and display the order profile. To do this, select the Sync. order 1 tab of the Result window.
Here, we want to display the first two orders profile for each input. To do so, select the profile tab, and select Order & Overall under Result and Acceleration (that will select the 2 acceleration channels) under input. To track the 2 first orders, you can simply enter 1 and 2 under the Tracked Order section.
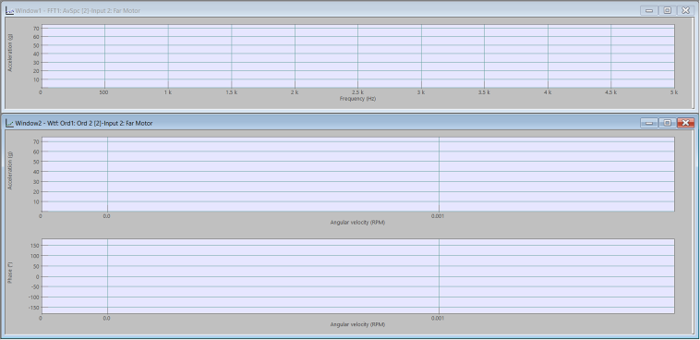
The profile graph is now displayed on the current layout along with the FFT spectrum graph :
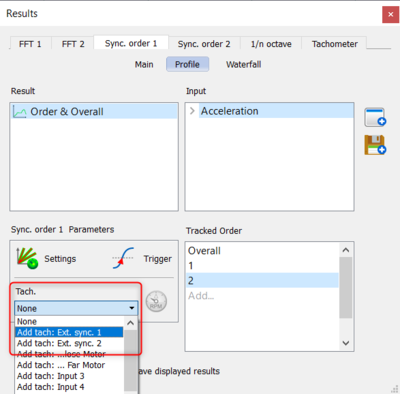
We will now need to add and declare the tachometer. To do so, select Add : Ext. Sync. 1 under Tachometer :
And set the threshold, coupling and Pulse/rev as recommended for your sensor :
Please visit the external sync tachometer page for more details.
Displaying the recorder
In order to have a complete view of the measurement, you can display the recording of the raw signals by clicking on View recording .
Performing and saving the measurement
We will now perform the measurement during a run-up of the motor. To do so, put the motor at its lowest speed, start the acquisition by clicking on ![]() , and then stop it with
, and then stop it with ![]() once you reached the top speed. You will see the graph updating with the last result.
once you reached the top speed. You will see the graph updating with the last result.
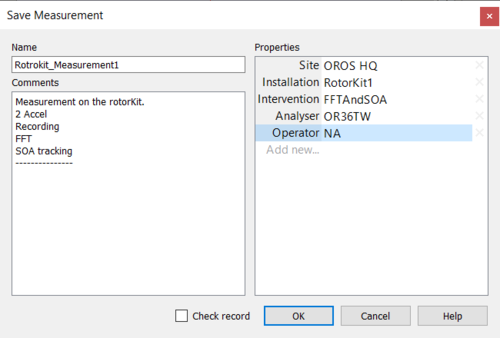
The save measurement window will then be opened. You can fill it with the maximum of information to help ease archiving and the sharing of the data:
The acquisition is now complete and the results are displayed :
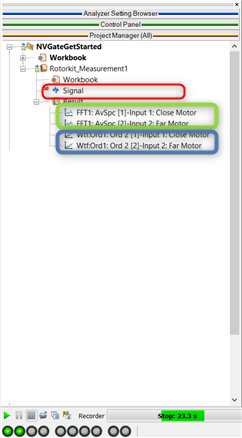
And you can find the saved data under the Project name in the Project Manager :
The red area represents the recorded temporal raw data, the green area the FFT results and the blue area the Order tracking results.
Conclusion
Congratulation you have done you're first measurement with NVGate.
The home tab, let you a quick access to all this settings, and more! :

Interface description
Analyzer Settings
The Log Window shows all the changes made to the modules (Front-end, Filter builder, Monitor, FFT x, etc.) in the ASB.
Some setting values need to be adjusted when another setting value is modified. So when you change a setting value in the ASB (new value: ...) which may affect another setting value, the Log window marks the changes made by the analyzer (adjusted to: ...).
1. Right click on this area:
2. Select Copy (to paste a setup in a text document for example)
3. Clear the display in the Analyzer Settings tab.
Warning
The Warning tab shows any unauthorized operations you have carried out or errors reported by NVGate®.
1. Right click on this area:
2. Select Copy (to paste a setup in a text document for example)
3. Clear the display in the Warning tab.
Macro Trace
The Macro Trace tab shows the operations (the start and stop macro execution, errors) made in the macro mode.
Warnings do not stop macro execution but major errors will.
1. Right click on this area:
2. Clear the display in the Macro Trace tab.
Tip: double clicking on the error icon in the Macro Trace tab will open the Macro Editor on the failed command.
Workspace
The workspace is a dockable tab on the left part of the NVGAte interface it holds 3 main themes of the analyzer interface.
Analyzer Setting Browser (ASB)
The analyzer is controlled through a tree of settings called the Analyzer Setting Browser (ASB). This tree consists of a set of modules that allows to setup the signal acquisition, play back and processes.
Note: The "information" icon File:Usersmanual 134.pngmay be found next to a setting. It means you cannot change the setting value.
Tip: When using the right click on any item from the ASB, you can copy the value(s) contained in the selection (it can be a module, collection, sub-module or just a setting) and paste it (them) into another item which contains compatible value(s). It is also possible to drag and drop a scalar type setting File:Usersmanual 135.pngfrom the ASB to a displayed window (for example the center frequency of the FFT Zoom).
Ways of editing a setting
Right click on an item and select Properties. You can check your setup and also change the settings in real time by double-clicking on the cell you want to change. The drop-down menu or the mouse wheel can also be used.
A setting can be set to its default value by right-clicking on it and by selecting Set to default.
Analyzer states
In the analyzer Setting Browser, you can find the analyzer states icons. They were made to show you visually the state of each plug-in analyzer at the same time. Follow the icon descriptions:
File:Usersmanual 137.png The plug-in analyzer is stopped
File:Usersmanual 138.png The plug-in analyzer is running
File:Usersmanual 139.png The plug-in analyzer is paused
File:Usersmanual 140.png The plug-in analyzer is recording
File:Usersmanual 141.png The plug-in analyzer is waiting for a trigger: defined Event or Manual ( File:Usersmanual 142.png )
File:Usersmanual 143.png The plug-in analyzer is waiting for the user answer: Accept ( File:Usersmanual 144.png ) or Reject ( File:Usersmanual 145.png ) the signal
File:Usersmanual 146.png The plug-in analyzer is failed (the analyzer is not able to do the data acquisition anymore; a warning message will appear)
Modules
There are 4 types of modules:
File:Usersmanual 147.png The sources that acquire store and play back signals
File:Usersmanual 148.png The resources that provide events, filters, weighting windows, and tachometers to the plug-in analyzers
File:Usersmanual 149.png The plug-in analyzers that process independent analysis modes
File:Usersmanual 150.png The Waterfall that synchronizes the results computed by the plug-ins
The modules contain different functions located on sub-modules.
A collection File:Usersmanual 151.png is a box that contains a group of sub-modules of the same type (inputs, filters, channels, etc.). The sub-modules of collection can be active (visible) or inactive (hidden). Right click on it to add/remove channels.
The settings are inside the sub-modules. The ASB has a maximum depth of 3 levels: module, sub-module and setting. In the case of multiple similar sub-modules (inputs for example), the user sets his analyzer simply by changing the settings. The settings are grouped in families:
- The scalar settings
File:Usersmanual 152.png are every numerical value which can be entered from the keyboard.
- The label settings
File:Usersmanual 153.png are every character string which can be entered from the keyboard.
- The enumerated settings
File:Usersmanual 154.png are a selection of an item from a list (items are character strings or numbers).
- The Table setting is a group of values
- The Matrix setting is selection of a matrix’s intersections
- The Boolean setting
File:Usersmanual 155.png allows activating or deactivating functions (inputs, auto-calibration, zoom…)
Project Manager
The Project Manager is used to store all your projects, results and measurements…. There are several display options that enable you to show or hide certain items.
Tip: you can drag and drop any type of result from the Project Manager to the windows top to display the result window.
The Project Manager is made up of 3 main parts: the Workbook, the Project and the Measurement.
Workbook
Project
Measurement
In front of the projects and measurements item, 2 small icon may be present: e.g: File:Usersmanual 159.png
- The icon File:Usersmanual 160.pngindicates if a project/measurement contains a signal file.
- The icon File:Usersmanual 161.pngindicates if a project/measurement contains results.
Control panel
The configurable Workspace area provides quick access to settings and/or ASB status. It looks similar to the "Favorites" in Internet Explorer. The settings can be classified into customizable tabs.
Tip: a setting from the ASB can be added to the Control Panel by right clicking the setting in the ASB and select Add to Control Panel.
Customization
The control panel is a part of the Workspace. It is used to control the measurement process. It is user-customizable and saved in the current project. Customization can be reached by right clicking on the Control Panel or from the Tools tab and Customize.
Tip: Use drag and drop to add a setting from a place to another. The destination tab must be compatible with the setting you try to add to.
Displays
Different windows which contain one or several graphs or traces can be created. You can also add or remove some information in the Infotrace using the Infotrace properties. Manage all the display settings using the right click on almost any area. For each result type there are different available options using the right click.
Multi-graphs windows
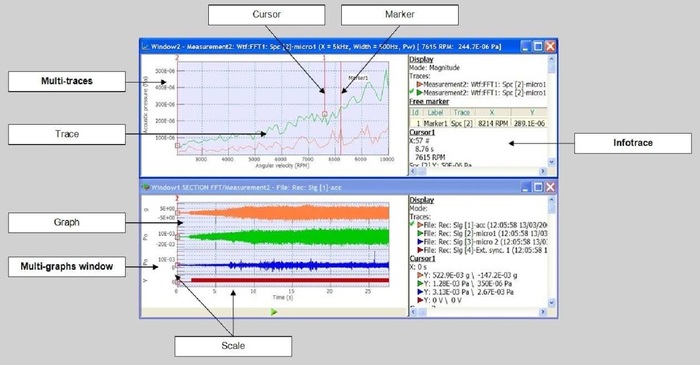
A graph is the area where traces are displayed. A multi-graph window contains several graphs which display signal from the same source or plug-in analyzer. The graphs can be displayed with different physical quantities.
Multi-traces
You can display several traces in the same graph. You can also display in multi-trace 3D mode.
Multi-traces display is not available for Waterfall displays.
The trace represents a signal or a result.
Cursors
The cursor is displayed when cursor mode is selected: Used to move the cursor by left clicking and dragging.
Select File:Usersmanual 166.pngfrom the Measurement tab in the Graphs group in order to activate the cursor mode.
Markers
Select a type of marker from the Display/Graphs tab in the Markers group in order to activate the marker mode.
To add a marker on a graph, double click on the graph. Obtain information about a trace by using the marker table.
Scales
The scale displays the magnitude and the grid of the graph.
Infotrace
Displays information about the graph:
Graph mode: magnitude, real…
List of traces with their status: available or not/displayed in all areas or not/not displayed. You can move into the infotrace to select a specific trace and to follow cursor’s value of this trace. Memorized traces are also displayed in the list.
- Overall levels: displays the RMS level in 2D windows containing spectra or time signals
- Cursor information: x,y, order, dx, dy if available
- Marker arrays
Using keyboard arrow up/down, you can select the active trace in the infotrace.
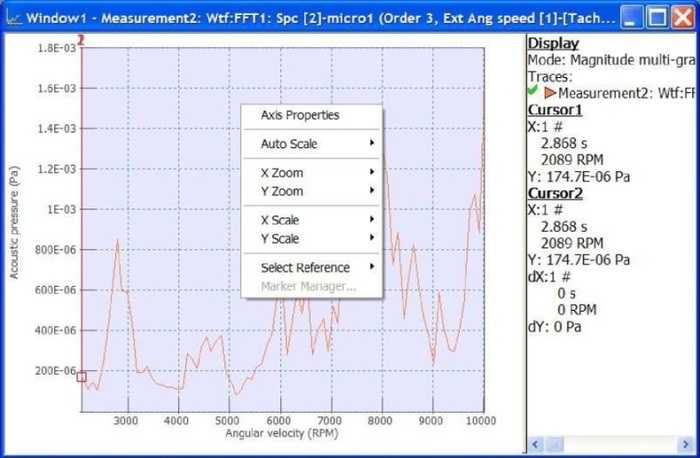
Right click on the graph provides access to the scale, zooms and X/Z axis references of the current graph.
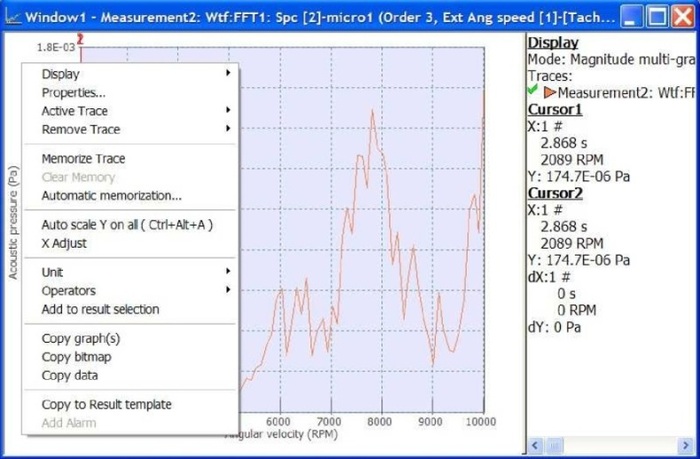
Right click on the window to access the local windows properties and actions on the contained traces.
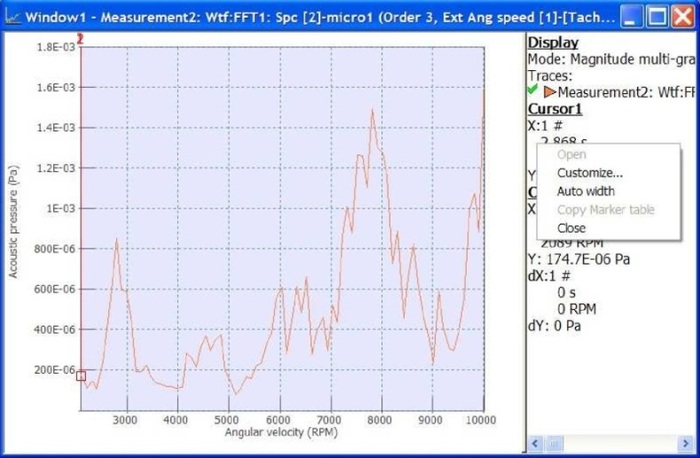
Right click on the infotrace allows customization of the displayed information.
