Sound Power Manual
The Sound Power Level generated from a source is the value used to quantify its sound emission properties. Because this result should be comparable from one test place to another, the measurement should be created following a particular test procedure. This procedure is defined by international standards, which are selected depending principally on the source type, the test environment, and the accuracy required. The OROS SOUND POWER Solution has been designed to let you achieve that type of test in the most efficient and accurate way.
The "getting started" on-line help explains in detail the three main steps:
- Setup
- Measurement
- Report
It is using an applied approach where explanations are given as questions in case you have any during a standard measurement process. The "getting started" on-line help will let you get the most out of your Sound Power Solution and set you on the right track.
Sound Power Environment
Starting with Sound Power Software
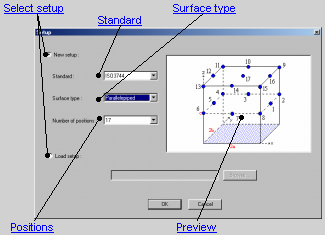
When Sound Power starts, the following window is displayed. You can select to open an existing Setup or begin with a new one that you setup in this dialog:
User Management
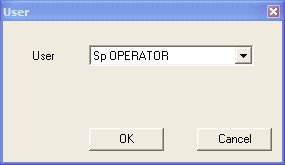
The Sound Power Solution uses predefined users. There are two predefined users: the "SP OPERATOR" and "SP MANAGER". The SP Operator runs the application in a standard way.
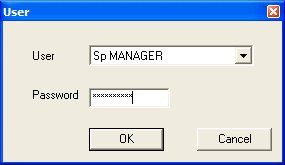
In case the application needs to be customized, the user can log itself as "SP Manager". In this case, a password will be requested: the password is "soundpower". Logging in as SP Manager will let the user modify the "Sound Power" project in NVGate.
Warning: Modifying the "Sound Power" project could create problems in the operation of the application. In such a case, the default "Sound Power" project should be kept as a back up and restored. Otherwise the Sound Power application should be reinstalled.
Functioning Modes
There are three main steps to carry out a measurement process.
Setup
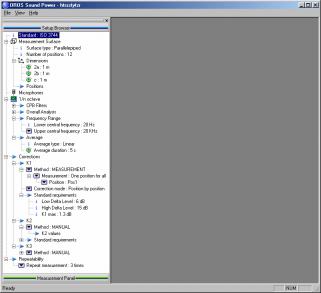
Using the Sound Power Software, the first step of the measurement is the configuration of the test setup. The setup browser will let you define the measurement surface, microphone positions, input connections and measurement steps. Then, the analysis parameters such as the test duration will be described. The final step of the test setup configuration concerns the corrections and validity tests described by the international standards.
You should have a display like the following one:
Measurement
During the second step, a test setup can be reloaded and a measurement panel displayed. Only at this stage can the measurement be started. The data is obtained and Sound Power results are automatically calculated, giving straight away calculated corrections and standard validation.
Report
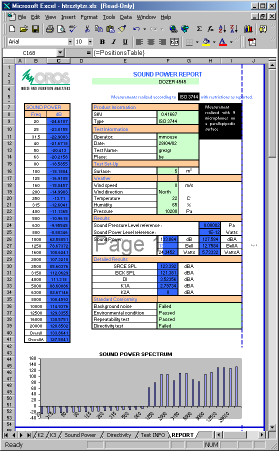
The third and last step is the automatic generation of the Sound Power report as a customized document in Microsoft Excel®.
Create a New Setup
The Setup creation is based on the use of a template. Create the new Setup from the first "Setup" window, then you can find the information from Sound Power in the Setup Browser tab in the workspace:
Note: The icon means the setting is only for user information, it cannot be changed.
Open a Setup
When you choose to open a Setup, Sound Power allows you to select an Excel® file template. You can select a default template to open or you can choose to open one of your saved ones. This action avoids you having to redo your settings each time you begin a measurement process.
Setup Browser
Dimensions
In the Setup Browser tab from the workspace, enter the dimensions of the surface in meters (double click on a setting to get it).
Note: For the hemispheric surface, just enter the radius value.
Positions
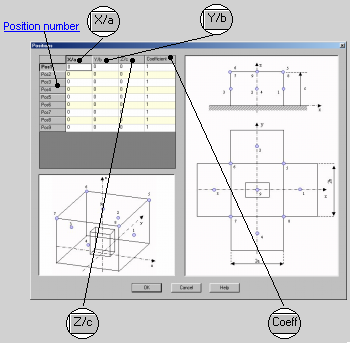
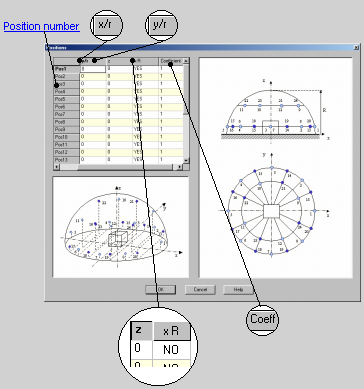
Set-up the microphone positions by entering the value in the table. To access the table, double click on Position from the Source module in the Setup Browser tab from the workspace.
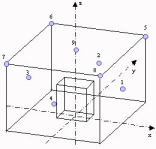
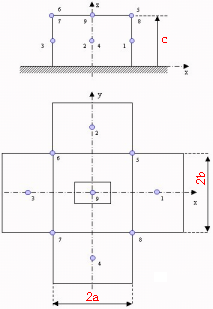
For a parallelepiped surface type, the following table is displayed:
For a sphere surface type, the following table is displayed:
Microphone Settings
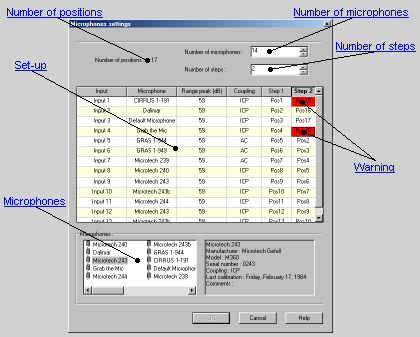
In the Setup Browser tab from the workspace, double click on the Microphones module, and the following window is displayed:
Note: By default all the inputs are set to Default microphone in the Microphone column. So if you do not have any microphones in your transducer database, enter the new microphones from NVGate® (click on the following button to see how to do it). Then from Sound Power software, click on Update transducer database from the Tools menu.
Tip: Double click on the Coupling column header and select a parameter in order to assign this parameter to all the inputs.
Analysis
1/n Octave
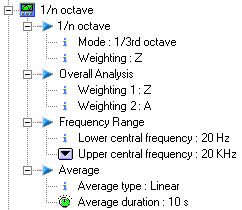
The 1/n octave module allows you to setup the analysis. You can only change the Upper central frequency and the Average duration. All other settings are for user information.
1/n octave: The analysis is done in the 1/3 octave mode with no weighting process.
Overall Analysis: The results of the overall analysis are given as Z weighted levels and A-weighted levels. Refer to measurement screen configurations for details on levels display.
Frequency Range: The analysis can be done between two available frequency bands:
[20 Hz; 10 KHz] or [20 Hz; 20 KHz]. The lower frequency is fixed.
Average: Set the measurement average duration.
Standard conformity
Corrections
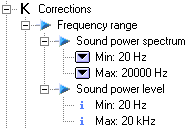
Frequency range
The Frequency range sub-module allows you to set the frequency range into which you want the correction to be done.
Sound power spectrum: Frequency range where the correction is applied on the sound power spectrum.
Sound power level: Frequency range where the correction is applied on the sound power level. This range corresponds to the one set in the 1/n octave module.
K1 correction
This type of correction is about the background noise.
There are three methods to define the K1 correction factor (Manual, File or Measurement).
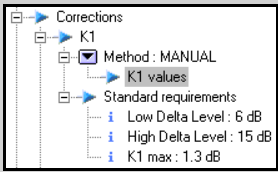
K1 manual determination
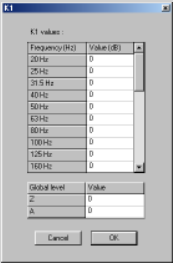
The manual method allows you to enter the K1 value for each frequency between [20 Hz; 20 KHz] or [20 Hz; 10 KHz] according to the frequency range you have selected.
The Standard requirements are for user information (given by the selected standard).
Double click on the K1 values setting, the following window is displayed:
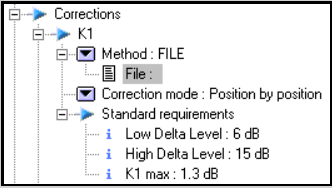
K1 file determination
The file method allows you to load the K1 value from a saved setup.
The Standard requirements are for user information (given by the selected standard).
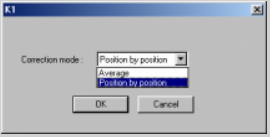
Double click on the Correction mode setting, the following window is displayed:
Average correction mode: source average in relation to the background noise average.
Position by position correction mode: each source position in relation to its background noise equivalent.
K1 measurement determination
The measurement method allows you to measure the K1 value.
The Standard requirements are for user information (given by the selected standard).
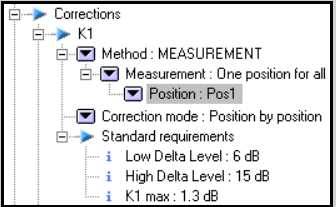
You have two possibilities to do the Measurement:
One position for all: determines the K1 only for one position then the value is assigned to all positions (select the position number).
All positions: determines the K1 for each position.
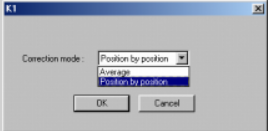
Double click on the Correction mode setting, the following window is displayed:
Average correction mode: source average in relation to the background noise average.
Position by position correction mode: each source position in relation to its background noise equivalent.
K2 correction
This type of correction is about the measurement environment.
There are five methods to define the K2 correction factor (Approached method, File, Manual, Reference source or RT 60).
The File and Manual methods are explained in the K1 topic.
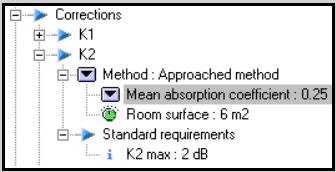
K2 Approached method determination
This type of method is mainly used for the room tests.
The Standard requirements are for user information (given by the selected standard).
Enter the values of the mean absorption coefficient of the room (depends on the type of material constituting the room) and the room surface by double clicking on the settings.
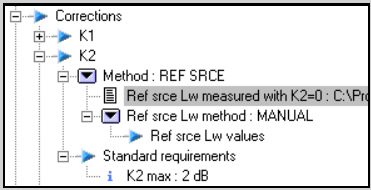
K2 Reference source determination
The reference source method allows you to load the K2 value from a file.
The Standard requirements are for user information (given by the selected standard).
This method means that the sound power of the source with K2=0 was previously measured and saved in a file (get the file by double clicking on Ref srce Lw measured with K2=0).
Ref srce Lw method (Manual or File): select the reference source measurement method in the measurement environment.
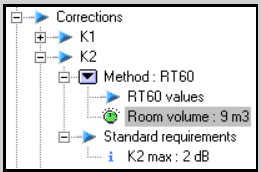
K2 RT 60 determination
This type of method is mainly used for the room tests with known RT60 values.
The Standard requirements are for user information (given by the selected standard).
Enter the values of the RT60 of the room and the room volume by double clicking on the settings.
K3 correction
This type of correction is an additional correction.
There are two methods to define the K3 correction factor (File or Manual). The File and Manual methods are explained in the K1 topic.
Repeatability
The repeatability module allows you to make the measurement either 1 time or 3 times. If you select 3 times, it means that the average is calculated between the two results which have a difference less than 1 dBA. If the three results have a difference of less than 1 dBA, the average is calculated between the two higher results.
Double click on Repeat measurement to access it.
Manage your Setup
Manage your setup from the File menu. There are 4 ways to manage your setup:
New Setup: allows you to load a new template among those suggested by default.
Load Setup: allows you to load a saved template or to load a default template from a folder.
Save Setup: saves the current setup.
Save Setup As: saves the current setup with a name you specify.
Measurement Panel
Background Noise
Background Noise Correction
To carry out the background noise process click on the Measurement panel tab from the workspace.
The background noise can be measured in the case where "Measurement" is selected as a K1 method (in the Setup browser). Then you should click on the ![]() button in order to initialize the background noise process (the background noise measurement does not start by clicking on this button). The Setup browser tab becomes Setup viewer, which means that you cannot change any setting.
button in order to initialize the background noise process (the background noise measurement does not start by clicking on this button). The Setup browser tab becomes Setup viewer, which means that you cannot change any setting.
Notes:
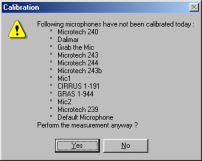
• a dialog appears if the transducers that you are using have not been calibrated.
• if the K1 method is set to File or Manual, the button above will be grayed.
Your screen is split in two parts: Sound Power (the controller) and NVGate® (the display).
During the background noise setup, NVGate® creates 2 layouts:
- LEVELS (shows all the A weighted input levels)
- SPECTRA (shows average 1/N octave signals and Z weighted global levels)
Notes: the number of traces in the layout display can change according to the K1 measurement setting ("One position for all" or "All positions").
You can also switch from one layout to the other during the run.
When the software is ready to start the background noise measurement, the following tool appears at the bottom of the Measurement Panel:
Background Noise Measurement
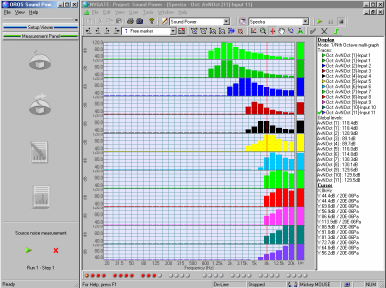
1. To start the measurement, click on the button from the Measurement Panel (the status bar indicates "Running..."). You should have a display like the following one:
2. Wait few seconds for the results (the status bar indicates "Getting results...")
Source Noise
The source noise process is started from the Measurement panel tab from the workspace.
Click on the ![]() button in order to initialize the source noise process, NVGate® software updates the input connections (the source noise measurement does not start by clicking on this button). The Setup browser tab becomes Setup viewer, which means that you cannot change any setting.
button in order to initialize the source noise process, NVGate® software updates the input connections (the source noise measurement does not start by clicking on this button). The Setup browser tab becomes Setup viewer, which means that you cannot change any setting.
When the software is ready to start the source noise measurement, the following tool appears at the bottom of the Measurement Panel:
Source Noise Measurement
1. To start the measurement, click on the "RUN" button from the Measurement Panel (the status bar indicates "Running..."). You should have a display like the following one:
The number of runs depends on the number of steps you have selected in the microphones dialog in the setup browser and on the number of repeatability you have selected (1 or 3 times).
Tip: For example if you have selected 3 times for the repeatability and 2 steps in the microphones you will have to click the run button 6 times:
| Run1 - Step1 | Run1 - Step2 |
| Run2 - Step1 | Run2 - Step2 |
| Run3 - Step1 | Run3 - Step2 |
2. Wait few seconds for the results (the status bar indicates "Getting results...")
Report Edition
Fill out your report
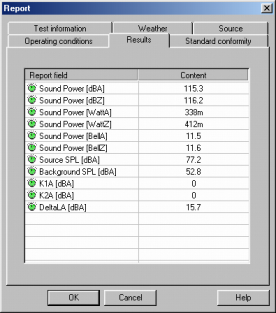
When the measurement is finished, click on the ![]() button from the Measurement Panel in order to fill out the report and check the calculated results, such as Sound power (dB and dBA), etc.
button from the Measurement Panel in order to fill out the report and check the calculated results, such as Sound power (dB and dBA), etc.
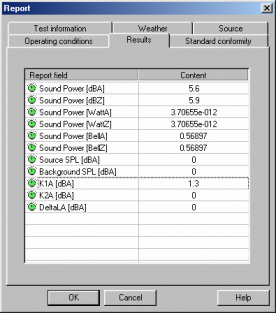
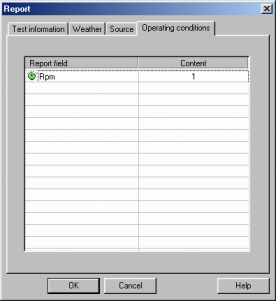
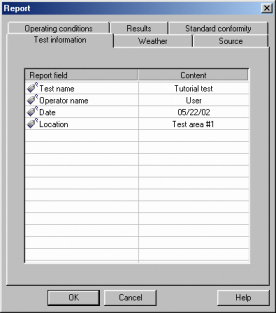
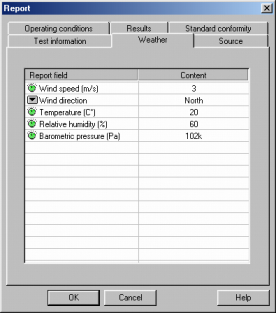
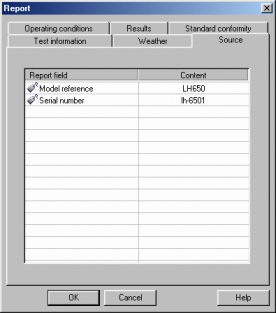
You have three tabs containing fields that you can fill out (double click on a cell to get the field) in order to make your report properly:
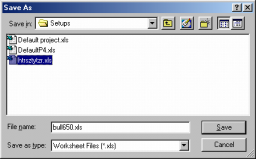
Once it is finished, click on OK, you can select to save the measurement or not. If you select to save the measurement, the following window appears:
Specify the file name and click on Save.
Results
The Results tab shows the information about the correction factors (K1, K2) and indicates the calculated results, such as Sound Power in dBZ and dBA, etc.
You cannot enter any data into these fields.
Standard conformity
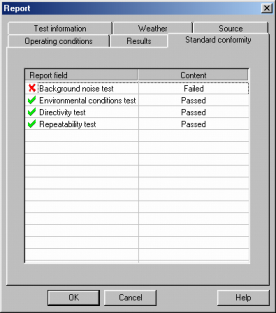
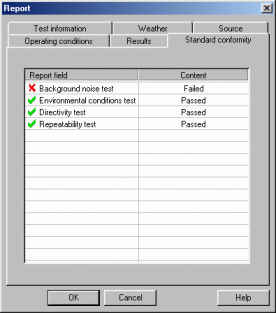
The Standard conformity tab shows you the information about:
Background noise test: this test is only about the "Low Delta Level". If the difference between the source level and the background level is up to the "Low Delta Level" given by the standard, the test is failed.
Environmental conditions test: this test is only about the K2 correction factor. If the K2 values are up to the one given by the standard, the test is failed. If the test is failed, the K2 values set in the report will be the K2 max given by the standard.
Directivity test: the directivity calculation is made between the maximum and minimum levels measured in dBA. If the difference between the max and min is up to the position number, the test is failed (cf. standard ISO 3744). So it is recommended that you do another measurement process with a greater position number.
Repeatability test: this test is significant if you have selected a 3 time repeatability test. The average is calculated between the two results which have a difference less than 1 dBA. If the three results have a difference less than 1 dBA, the average is calculated between the two higher results. The test is failed if the three results have a difference up to 1 dBA.
You cannot enter any data into these fields.
Report Preview
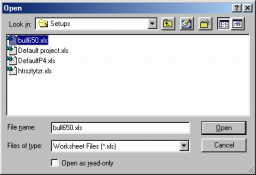
When the report is filled out, click on the ![]() button from the Measurement Panel in order to open the report you want to see. The following window appears:
button from the Measurement Panel in order to open the report you want to see. The following window appears:
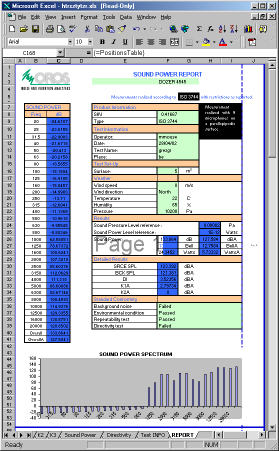
Select the saved setup and click on Open (an Excel worksheet is displayed containing all the information about your setup and measurement). Your report should look like the following one:
Report Customization
You have the possibility to choose what information you want to display in the "Report" dialog from the Sound Power software. If you want the modifications to appear each time a user loads a SETUP, customize it in Excel first. To do this:
1. From the Measurement Panel, click on the ![]() button in order to open the Setup you want to modify.
button in order to open the Setup you want to modify.
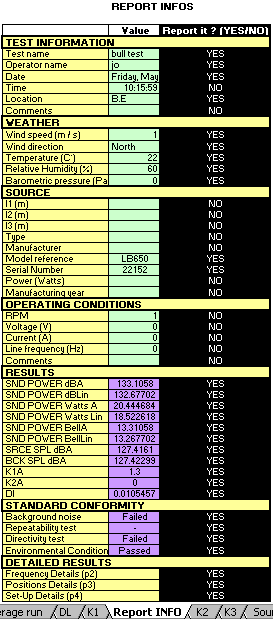
2. Once the Setup is opened in Excel, select the "Report INFO" tab, so you should see the following sheet:
Legend:
From this sheet, the titles of each part are displayed as tabs from the "Report" dialog in Sound Power (Test Information, Weather, Source, etc...). |
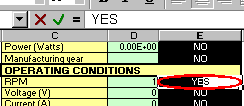
3. Click on the cell corresponding to the data you want to see in the report. For example, the RPM data, and type YES.
4. Click on the green cell corresponding to RPM and then click on the label cell.
5. When RPM is highlighted, press CTRL+c to copy the value (be careful to do not change the value) and then click on the Report tab.
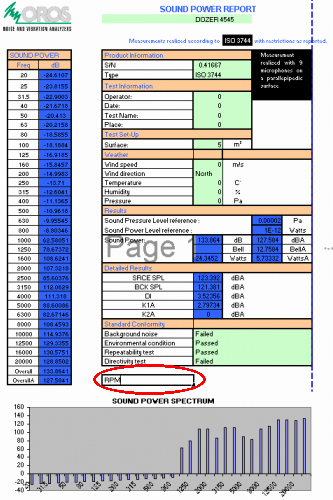
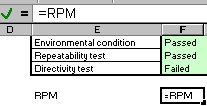
6. Click on a free cell and type RPM as a title for the data you are about to insert as described in the following picture.
7. Click on the cell next to the previous one then type = and press CTRL+v in order to paste the label previously copied.
Press Enter to apply the computation.
8. Save your Setup from Excel. The next time the Setup will be loaded, the RPM field will be activated, so the user will be able to enter a value for the RPM.
9. The result of this procedure is available from Sound Power in the Measurement Panel by clicking on the
![]() button.
button.
Tutorial
Welcome to the tutorial
This tutorial is designed to teach you quickly how to use the Sound Power software. Along the way, you will learn the basic steps of building a Setup.
These quick and easy lessons take you step by step through the process of displaying traces, creating a setup, saving a setup etc.
The First lesson
You will learn how to create and save a setup.
The Second lesson
This lesson will teach you to load a saved setup and to make a measurement.
First Lesson
Context:
The aim is to create and prepare a setup to study the noise of a construction vehicle, like a bulldozer for example. The idea is to re-load the created setup afterwards, making the software operation easier for the daily user.
Suppose that you need 12 positions to make your measurement according to the standards and you have only 6 microphones at your disposal. The standard you have to select is the ISO 6395 with a sphere surface.
Preliminary step (create the microphones needed)
This step explains how to create the 6 microphones that you need to carry out the measurement process (this is made from NVGate® software).
1. From the Start menu, select Programs, NVSolutions then start Sound Power On-line Help in order to read the Sound Power HTML Help from NVGate®.
2. Switch to NVGate® software.
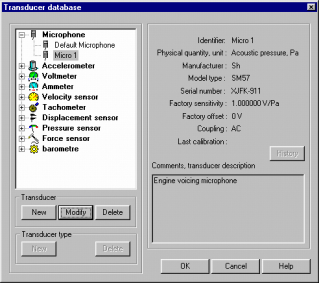
3. From the Tools menu, select Transducers then Definition and the following window is displayed:
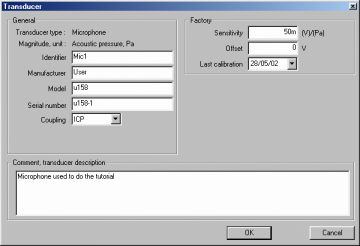
4. Select Microphone, and click on New from the "Transducer". The following window is displayed:
Identify the first microphone by naming it "Mic1". Feel free to fill out the "Manufacturer", "Model" and "Serial number" fields as you like.
For the "Coupling", select ICP and enter 50m(V)/(Pa) for the microphone sensitivity. Click on OK when finished.
Note: If you have LEMO connectors on your hardware, select AC for the coupling setting instead of ICP.
5. Repeat step 4 for each microphone. Identify the 6 microphones by Mic1, Mic2, ..., Mic6. Only change the "Identifier" and "Serial number" fields for each microphone.
6. When you have created the 6 microphones, click on OK from the "Transducer database" window and then switch back to Sound Power software.
7. From the Tools menu, select Update transducer database.
Create a Setup
This step shows you how to load a default setup and create a new one.
1. Select New Setup from the File menu.
2. From the Surface type, select Sphere and number of positions = 12. Click on OK. You can choose whether or not to save the current setup.
3. In this case, the radius of the sphere must be 32 meters (this value is used for the hemisphere surface computation), so double click on the Dimensions setting and enter 32. Click on OK.
4. Double click on Positions from the Setup Browser and take a look at the positions coordinates in order to place your microphones, click on OK.
5. Double click on Microphones from the Setup browser. Set the Number of microphones to 6. The number of steps is adjusted to 2. Suppose that the measured levels are close to 100dB, so you have to set the range peak closer to this value. Type 100 in each Range peak cell of the inputs (the value is automatically adjusted taking into account the microphone sensitivities).
6. Set the positions in the Step 2 column like in the following table and click on OK:
| Step 1 | Step 2 |
| Pos1 | Pos7 |
| Pos2 | Pos8 |
| Pos3 | Pos9 |
| Pos4 | Pos10 |
| Pos5 | Pos11 |
| Pos6 | Pos12 |
7. In the 1/n Octave module from the Setup Browser, set the Upper central frequency to 20KHz and the Average duration to 15s.
8. Knowing that all positions can be measured only in two steps in this particular case and that it is not necessary to measure the background noise for all the positions, we choose to measure it only at the position 1. To achieve that, we do the setup as it is described below.
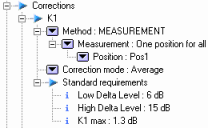
In the Corrections module, set for K1:
| Method: Measurement Measurement: One position for all Position: Pos1 Correction mode: Average |
9. Taking into account that the measurement is carried out outdoors, we consider that the environmental correction K2 is null.
For K2:
| Method: Manual |
Double click on K2 values and set all the values to 0dB. Click on OK.
10. Taking into account the method accuracy required, no weather correction should be implemented, so the K3 correction factor will not be displayed in the Setup Browser.
11. Double click on Repeat measurement from the Repeatability module, set the value to 3 times.
Save a Setup
1. From the File menu, select Save Setup as.
2. Name the Setup Tutorial_setup1 and specify the location: the directory C:\Program Files\OROS\OR38\NVSolutions\SoundPower\Setups is the one installed by default, but you can choose any other location.
Second lesson
The aim of the second lesson is to go through a realistic measurement process (load a setup, display traces, measurements and results, generate a report).
Switch to the Measurement Panel tab from the workspace.
Load a Setup
You are going to load the Setup saved in the first lesson.
1. From the File menu, select Load Setup.
2. Select Tutorial_setup1 and click on Open.
Measurement process
There are several steps during the measurement: the transducer calibration, the background noise measurement and the source noise measurement.
1. Start the background noise measurement process by clicking on the ![]() button. A dialog is displayed that warns you in case your microphones have not been calibrated today.
button. A dialog is displayed that warns you in case your microphones have not been calibrated today.
Click on No.
2. Calibrate your microphones
3. When the calibration is OK, click on the ![]() button in order to initialize the background noise measurement process (the background noise measurement does not start by clicking on this button).
button in order to initialize the background noise measurement process (the background noise measurement does not start by clicking on this button).
4. To start the measurement, click on the ![]() button from the Measurement Panel (the status bar indicates "Running..."). The measurement lasts 15 seconds (as defined in the first lesson of the tutorial). When the averaging is finished, wait for the results to download (the status bar indicates "Getting results...").
button from the Measurement Panel (the status bar indicates "Running..."). The measurement lasts 15 seconds (as defined in the first lesson of the tutorial). When the averaging is finished, wait for the results to download (the status bar indicates "Getting results...").
5. Click on the ![]() button in order to initialize the source noise measurement process (the source noise measurement does not start by clicking on this button).
button in order to initialize the source noise measurement process (the source noise measurement does not start by clicking on this button).
6. To start the measurement, click on the ![]() button from the Measurement Panel (the status bar indicates "Running...") until the end of the measurement (Run1-Step1, Run2-Step1, Run3-Step1, Run1-Step2, Run2-Step2, Run3-Step2).
button from the Measurement Panel (the status bar indicates "Running...") until the end of the measurement (Run1-Step1, Run2-Step1, Run3-Step1, Run1-Step2, Run2-Step2, Run3-Step2).
Note: As you have selected 2 steps (it means that you do not have enough microphones to do the measurement in one step) in the measurement process, you will have to change either the microphone positions or to move the source between the 2 steps.
Fill out and generate a report
Fill out your report before printing in order to find all the information about the weather conditions, user name and the many other features.
1. When the measurement is finished, click on the ![]() button from the Measurement Panel in order to fill out the report like the following one:
button from the Measurement Panel in order to fill out the report like the following one:
2.
3.
4.
5.
In this case for example, the Background noise test has failed. It means that you may have to go once again through a measurement process until all the tests will be positives.
6. Click on OK.
Save the measurement
The "Save" dialog is displayed, then select Yes. Name the Setup: Tutorial_measurement1. Specify the location (in order to avoid mixing your measurement results with setup templates, place it in another location than the "Setups" and "Templates" directories). Click on OK.
Preview your report
Click on the ![]() button from the Measurement Panel in order to visualize the report corresponding to the measurement you have made: the last saved measurement file will be proposed by default.
button from the Measurement Panel in order to visualize the report corresponding to the measurement you have made: the last saved measurement file will be proposed by default.
