Modal Shortcuts
Modal validation, MAC & COMAC
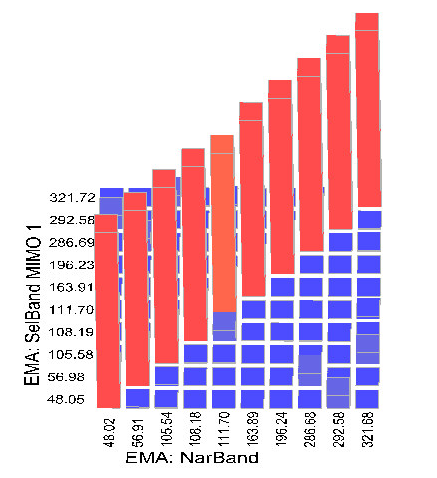
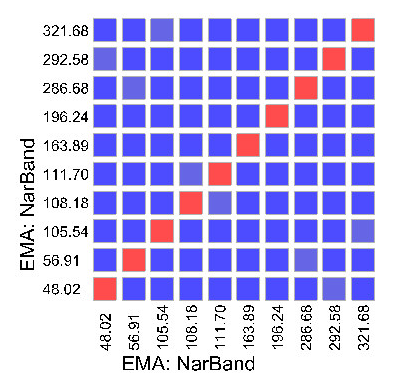
Modal Assurance Criterion (MAC) values can be used to compare two arbitrary complex vectors. The MAC value between two vectors who have linear relationship is near to one. The MAC value between two linearly independent vectors will be near zero. MAC calculation has two applications in the modal analysis.
First, it can be used to compare two mode shapes obtained from two different modal parameter estimation processes on the same test data. Two similar mode shapes have a high MAC value, and two same mode shapes have a MAC value of 1.
Second, it can be used to check the orthogonality of mode shapes when weighted by the mass matrix. Even when no exact mass matrix is available, the orthogonality of mode shapes is approximately satisfied. We can use it to validate the modal result.
The MAC value table can also be showed by the right click popup menu.
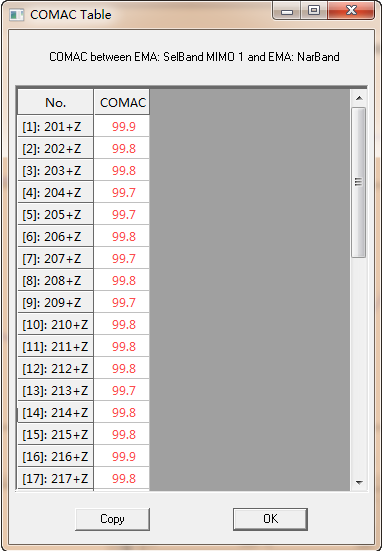
Coordinate Modal Assurance Criterion (COMAC) is an extension of Modal Assurance Criterion (MAC). COMAC attempts to identify which measurement degrees of freedom contribute negatively to a low value of MAC. COMAC is calculated over a set of mode pairs, analytical versus analytical, experimental versus experimental or experimental versus analytical. In Modal, COMAC between modes from different identification algorithms or imported modes can be calculated.
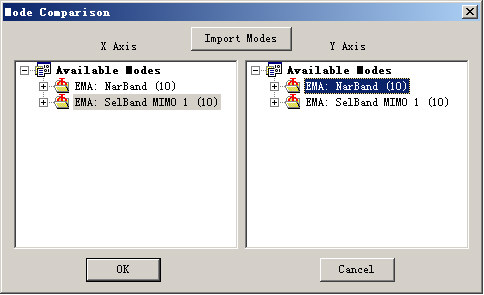
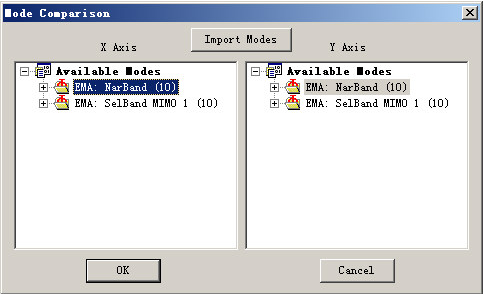
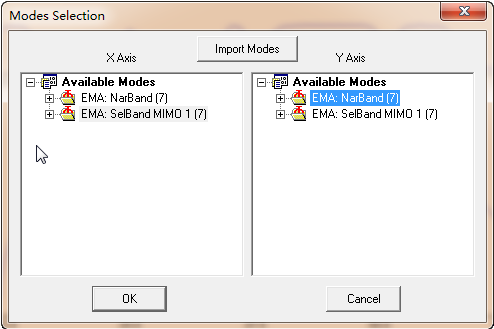
To calculate COMAC, the first step is to set the two sets of modes you want to be compared.
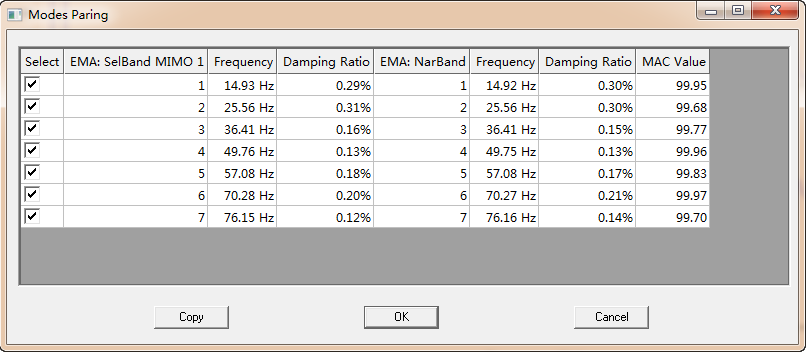
In the second step, the mode pairs should be determined. The process of modes paring will be done by Modal automatically, according to the MAC values between each modes in the two sets. You are also allowed to select part of the mode pairs.
Then the COMAC values table will be displayed.
Import / Export
Data and all kinds of results can be exported or printed, which provides you great convenience to write a report or give a presentation. These functions include: Importing data, exporting data, m exporting table,export graphics, exporting animations, print preview and print].
Import
Geometry
You can import geometry information from UFF 15/82/2412 files and IGES files
Data Files
UFF
You can import measurement data in frequency domain (including Frequency Response Functions and Coherence Functions) or time domain (time histories) from the UFF 58/58b files.
- Response Type
The type of response to be imported. Generally we use accelerometers, so we specify the type as "Acceleration" here.
- Data Type
The type of data to be imported. There are three types here: 1) frequency response functions (and coherence functions) for EMA analysis, 2) time histories for EMA analysis, and 3) time histories for OMA analysis.
If FRFs which have been applied with exponential windows are to be imported, you need fill the content of "Exp. Window Coef." to modify the increasing damping caused by the exponential window.
If time histories are to be imported, you need specify the marker to distinguish excitation signal from response signal. Here you have two options: reference DOF (REFDOF) or the unit of Y Axis. When the marker is REFDOF, the measurement information of excitation signal should be defined in the field the reference node and direction. While the marker is the unit of Y Axis, software take the signal block with the unit you specified as excitation signal.
- Setup Name and UFF Data Files
Then you can specify or modify the "Setup Name" and "UFF data files" for each setup. The wildcards (’*’ or ’?’) is allowed to refer to multiple UFF files. If many files are included, you are recommended to use wildcards manually. The common definition of wildcards is employed: "*" to represent any multiple characters, and ’?’ to represent a single character. For example, the "*.unv" represents all the files whose extension names are "unv" in the same directory of this configuration file.
Note (very important): if you want to import time domain UFF data files for EMA, you’d better use the wildcard. You must put the measurement data of one test (for example, in the IMRT, one test means the measurement of one point) into one UFF file. If you have 20 nodes to measure in an IMRT, then you should have 20 UFF files, such as node01.uff, node02.uff, ... node20.uff. Here you can use "node*.uff" to import all the 20 files.
- Buttons
Press the "Add/Change" button to confirm this operation, then these data files information will be stored for the specified setup. For an EMA test, you are only allowed to have one setup, no matter whether it is time domain or frequency domain. For an OMA test, you are allowed to add more setups.
Press the "OK" button to write these information to the current configuration file, and the new configuration file will be automatically reloaded to import the data specified.
The following interface will appear after the importing:
You can check or change the information of imported data here, such as the response nodes and directions. You can also unselect the data you don’t like. Click the header of each column, the current list will be sorted. In the right of this dialog, two filters are set for convenience.
OROS Format
You can import measurement data in frequency domain ("*.res", including Frequency Response Functions and Coherence Functions) or time domain ("*.oxf" or "*.oxl", time histories) from the OROS format data files.
The interface for importing OROS format data files is very similar with the one for importing UFF data.
To import the FRFs and COHs from the OROS ".res" files, you don’t need to specify the the "Exp. Window Coef." . Because this information is included in the ".res" file, and will be read by OM2 automatically.
The data files of one modal test may be stored in many different directories, so in this interface you should specify the "Searching Directory", but not the name of files. OM2 will search data files in the specified directory and all its subdirectories.
The same interface which allows you to check and change the information of imported data will appear after the configuration file is reloaded.
Equations
You can import the constrain equations from a ASCII format configuration file. The imported equations will be appended to the current equations list in the project. Please note that the sequence of equations is very important, which might lead to different animation effect.
Modes
You can import identified modes (including frequencies, damps, mode shapes, modal A and modal B) from UFF 55 files. An item called "Imported" will appear in the branch of "Data\Setup?\Mode" in the "Data" page of "Workspace" Panel.
Export
Data and all kinds of results can be exported or printed, which provides you great convenience to write a report or give a presentation.
Data
You can export the modes by corresponding toolbar of the mode list view or the right click menu.
All the mode can be exported to a UFF 55 file (".unv") or ASCII file (".asc").
Data such as input signals, output signal, frequency response functions, power spectrums, and coherences can be exported to UFF files or ASCII files in the "Data" tab page of Workspace shortcut panel.
All the data in the data table view can be exported to an ASCII file.
Table
The identified mode list can be export to Microsoft WORD as an table by the following steps:
- Copy the Mode List to Clipboard
’Copy’ button in the standard toolbar or ’Copy All’ item in the right click menu of the mode list view can be used to copy all the modes to system’s clipboard. If only part of the modes are needed, please select the items you wanted by ’Shift’ or ’Ctrl’ keys (just like the operations in the Windows’ Explorer), then click on the ’Copy’ item in the right click menu.
- Paste to WORD and Create the Table
Run WORD and create a new document, and paste the contents in the clipboard into it. Select the pasted lines, and use the Insert Table Command, the a new table containing the modes are created. To prettify this table, you can adjust it furthermore.
If you want to use these tables in Microsoft PowerPoint, you can create the table in WORD first, and then copy it to the PowerPoint.
Graphics
Everything in the main window, including the 2D curves, 3D graphics, data tables and so on, can be captured and saved as BMP or JPG graphic files by the ’Save Snapshot’ button in the standard toolbar.
You can also copy a snap into Windows’ clipboard by the ’Copy’ button in the standard toolbar, and then paste it to the document.
Animations
The animations of mode shapes or ODS in Modal can be saved as AVI media files according to the following steps:
- Make sure that the mode shape or ODS wanted is shown in activated.
- Press the "Record" button in the "3D Display" shortcut panel (or using the right click menu), and enter the wanted file name. The default name can be changed from the dialog of "Set Properties...".
- Saving progress will be displayed in the status bar. You can play this AVI file with some media player, or insert it to the WORD/PowerPoint documents.
- The AVI file is encoded with the CODEC you set in the dialog of " Set Properties...". Some CODECs might fail to work correctly. If this happens, please select another one in the dialog of "Set Properties..."..
- Different CODEC leads to different play quality and different file size, you can select the best after trying all.
Everything displayed in the main window, including the 2D curves, 3D graphics, configuration information, data tables and so on, can be previewed by button or printed by button in the standard toolbar. Of course, you can realize these operations by menu too.
Shortcuts operation
Many shortcuts are provided to help you operate Modal more conveniently. Your efficiency can be greatly improved by these shortcut operations employing the mouse and keyboard.
Shortcut Operations in the Explorer
| Double click on a ’.cfg’ file | Run Modal, and open this configuration file |
| Double click on a ’.wsp’ file | Run Modal, and load this workspace file |
| Drag a ’.cfg’ file to the software’s mainframe | Open this configuration file |
| Drag a ’.wsp’ file to the software’s mainframe | Load this workspace file |
Shortcut Operations in the General Interface
| Ctrl+N | Create a new configuration file |
| Ctrl+O | Open a configuration file |
| Ctrl+P | Print contents in the current window |
| Ctrl+C | Copy contents in the current window to the clipboard |
| Ctrl+V | Insert clipboard contents |
| Ctrl+Z | Undo the last action |
| Ctrl+Y | Redo the previous undone action |
| Ctrl+D | Locate to the setup list box in the standard toolbar, and switch between each setup |
| F1 | Show the online help manual |
| F5 | Reload the current configuration file |
| F12 | Begin a new session of OROSModal2 |
| Double click on a window tab | Close the relevant window |
| Middle click on a window tab | Close the relevant window |
Shortcut Operations in the 2D Curve Window
| Double click | Select the band between current cursors |
| Enter | Select the band between current cursors |
| Middle click | Delete the latest selected band |
| Backspace or Delete | Delete the latest selected band |
| Double middle click | Delete all the selected bands |
| Esc | Delete all the selected bands |
| Tab | Find the limits between current cursors |
| ← | Move the two cursors to the left simultaneously |
| → | Move the two cursors to the right simultaneously |
| ↑ | Move the two cursors outwards simultaneously |
| ↓ | Move the two cursors inwards simultaneously |
| Page Up | Increase the cursors’ moving step |
| Page Down | Decrease the cursors’ moving step |
| Home or End | Make the two cursors return to default positions |
| F2 + Mouse moving | Move the two cursors with the mouse simultaneously |
| F3 + Mouse click | Zoom in the range between the two cursors |
| F4 + Mouse click | Display the full band of current curve |
Shortcut Operations in the 3D Graphics Window
| Ctrl+M | Locate to the mode list box in the toolbar, and switch between each mode |
| Click and moving | Rotate the model |
| F2 + mouse moving | Translate the model or selected 3D objects |
| F3 + mouse moving up or down | Zoom in or out the model or selected 3D objects |
| F4 + mouse moving | Rotate the model or selected 3D objects |
| Mouse wheel scroll | Zoom in or out the model or selected 3D objects |
| Delete | Delete selected items (nodes, lines, polygons, 3D objects) |
| ← | Translate to the left |
| → | Translate to the right |
| ↑ | Translate to the top |
| ↓ | Translate to the bottom |
Shortcut Operations in the Dialog of ’Showed Series’
| Double click on the ’Available No.’ | Add the selected items to ’Selected No.’ |
| Double click on the ’Selected No.’ | Delete the selected items from ’Selected No.’ |
| Right click anywhere | Delete all the items in ’Selected No.’ |
| Middle click anywhere | Delete all the items in ’Selected No.’ |
