NVGate Waterfall
The Waterfall module is used to stack data from NVGate plug-ins, such as Spectra, 1/n Octave, RPM or DC values into on graph. Data into each slices are synchronized and can be sorted by references (time, RPMs or DC channel).
Overview
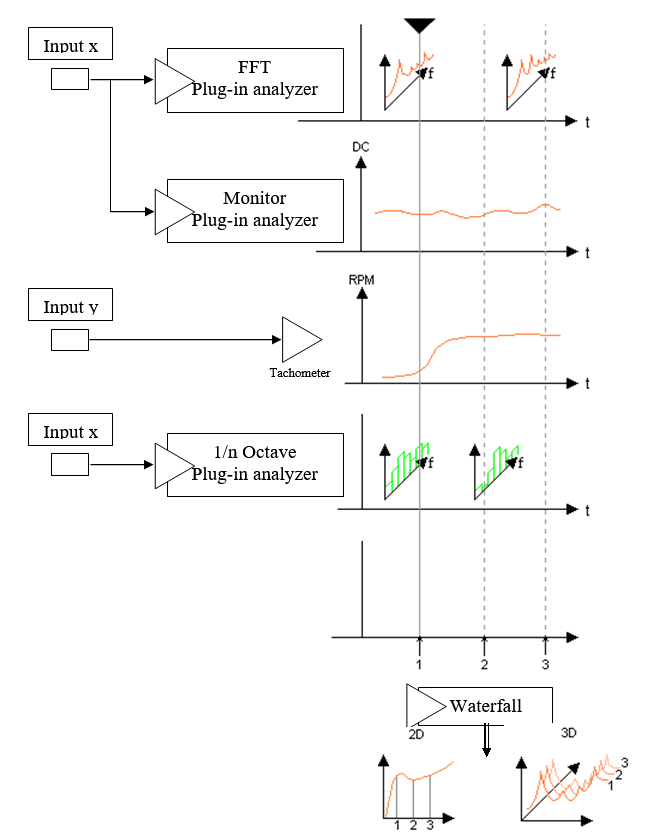
The following scheme describes the waterfall slices collection behavior. When selected event (trigger) occurs, the latest computed data from each associated plug-in are collected into the current slice. Then data can be displayed into 2D (for scalar) and 3D graph in function of each reference.
Stackable results
| 3D | 2D (profiles) | |
| FFT | * Triggered block * Weighted block * Inst. Spectrum * Average Spectrum * Inst. Cross Spectrum * Average Cross Spectrum * FRF H1 * FRF H2 * Coherence * Inst. Zoom Spectrum * Average Zoom Spectrum * Zoom Cross Spectrum * Zoom Average Cross * Zoom FRF * Zoom Coherence |
* Overall Power * Order x |
| Sync. Order | * Triggered block * Weighted block * Order Inst. Spectrum * Order Average Spectrum |
* Order x * Overall Power |
| 1/n Octave | * 1/n Octave * Average results: - AvNoct - MinOct - MaxOct |
* Overall level: OvrLin * Overall Weighted level: OvrWgt |
| Overall acoustic | - Lxypeak - Lxy inst * Lxy eq 1/8s * Lxy eq 1s * Lxy eq t X = Applied weighting (A or C), in case of Z selection (no weighting) X is not displayed. Y = Applied time filter (None, Fast, Slow or Impulse), If none is selected (no time filtering) Y is not displayed. t = Short time integration duration. T | |
| Tachometer | * Tach Angular Speed (ref) * Virtual Angular Speed (ref) * Ext Tach Angular speed (ref) * DC Tach speed (ref) * Combined tach speed (ref) * Fractionnal tach (speed) | |
| Front end |
| |
| Monitor |
| |
| Time domain |
| |
| N.A. |
|
Computation SPUs
Unlike other plug-in, the memory of the waterfall depend on the capacity of the PC and others applications running on it. The depth of the waterfall is function of the free memory of your PC, and is limited to around 3 millions samples per DSP.
Tutorial
Waterfall connection
This section will show the different way to add result into the waterfall.
From the Show Result window
The Show Results window is the most common way of adding a result in the waterfall. Here I will show you how to simply display a waterfall of the average spectrum for an acceleration input.
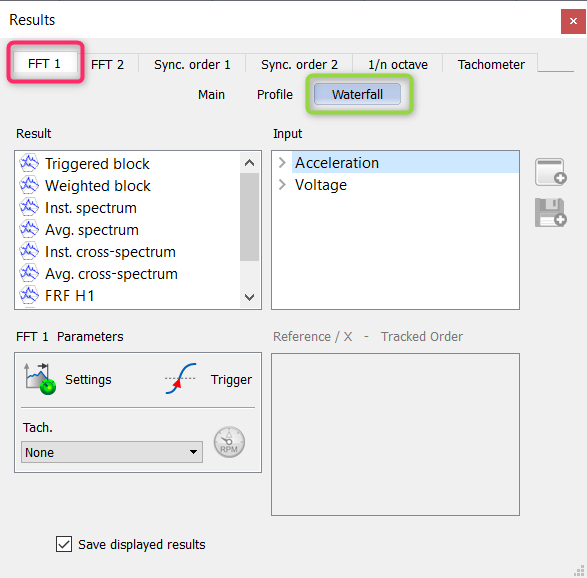
First, open the Show Result window, go in the FFT 1 tab, and reach the Waterfall section :
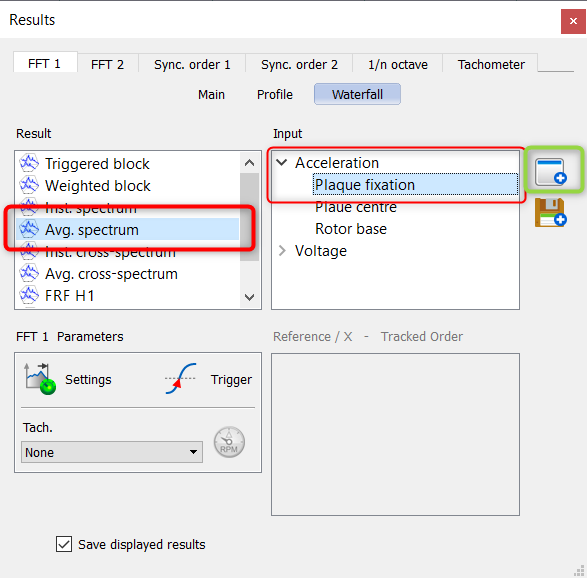
Then, select Avg. Spectrum and the fist input. Finally click on ![]() to display the waterfall :
to display the waterfall :
The 3D view of the waterfall is displayed.
For more detail please see NVGate Software overview.
From the graph window
This method will allow you to add the result from a currently displayed graph into the waterfall. This will work with any result of NVGate compatible with the waterfall. As previously, we will add the Average spectrum all the channels into the waterfall.
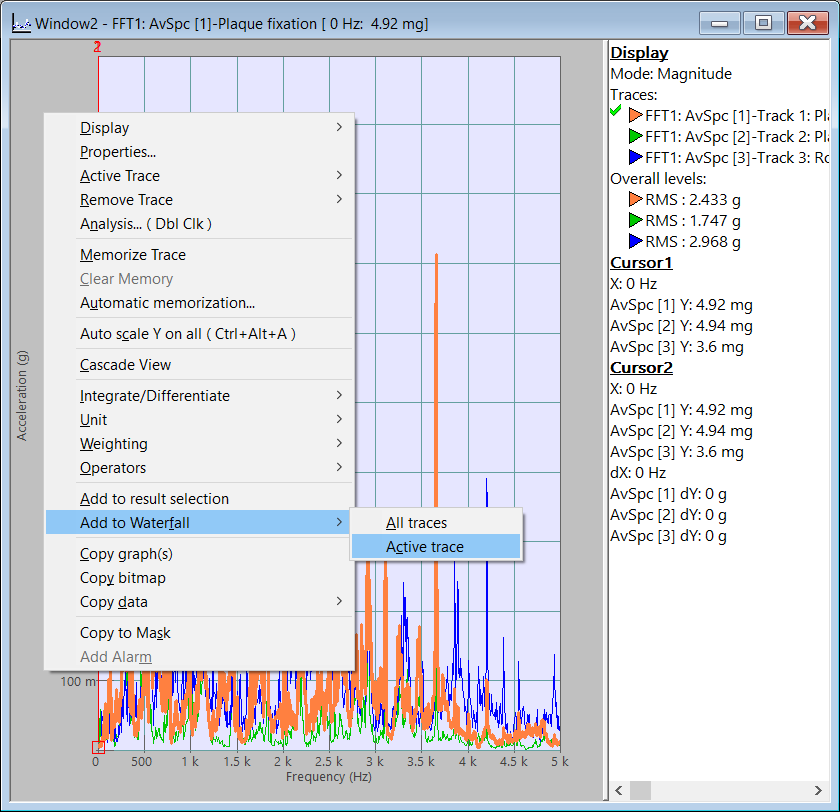
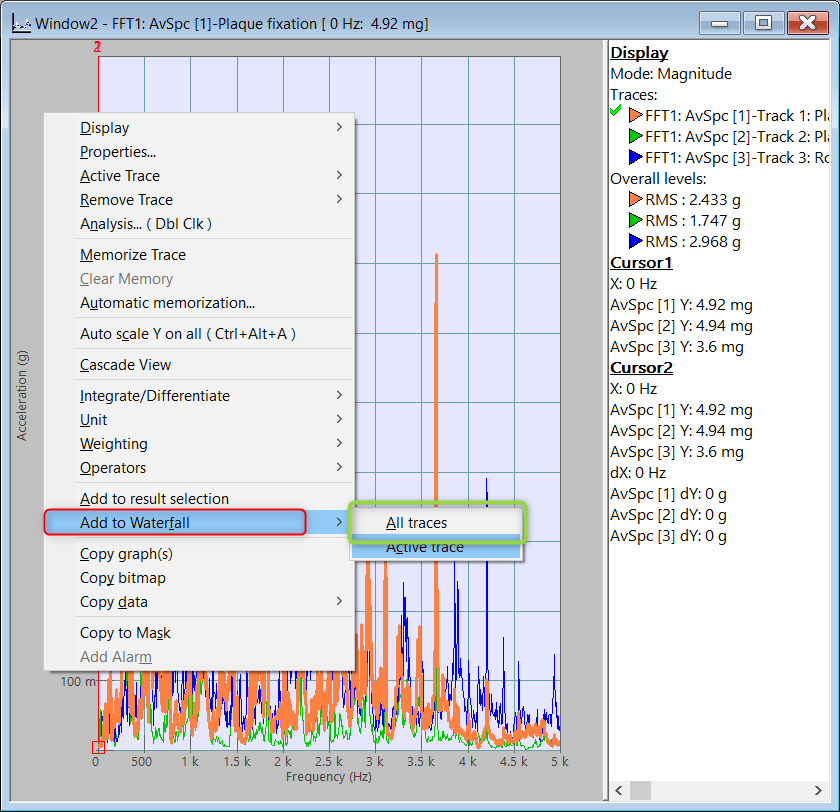
First of all, right-click on the grey border of the graph and go in the Add to Waterfall section :
- All Trace will add all the trace in the graph into the waterfall
- Active Trace will only add the active trace of the graph into the waterfall.
Here, we will select All Trace, as we want to add all the channels of the FFT plug-in.
All the traces have been added, and the waterfall can be displayed from the Add/Remove windows menu of theDisplay/Graphs tab of the Ribbon :
The 3D view of the waterfall is now displayed in the current layout.
Finally, results can be add into the waterfall directly from the waterfall menu. To do so, go into the Analyses tab of the NVGate ribbon, and click on  in the waterfall section :
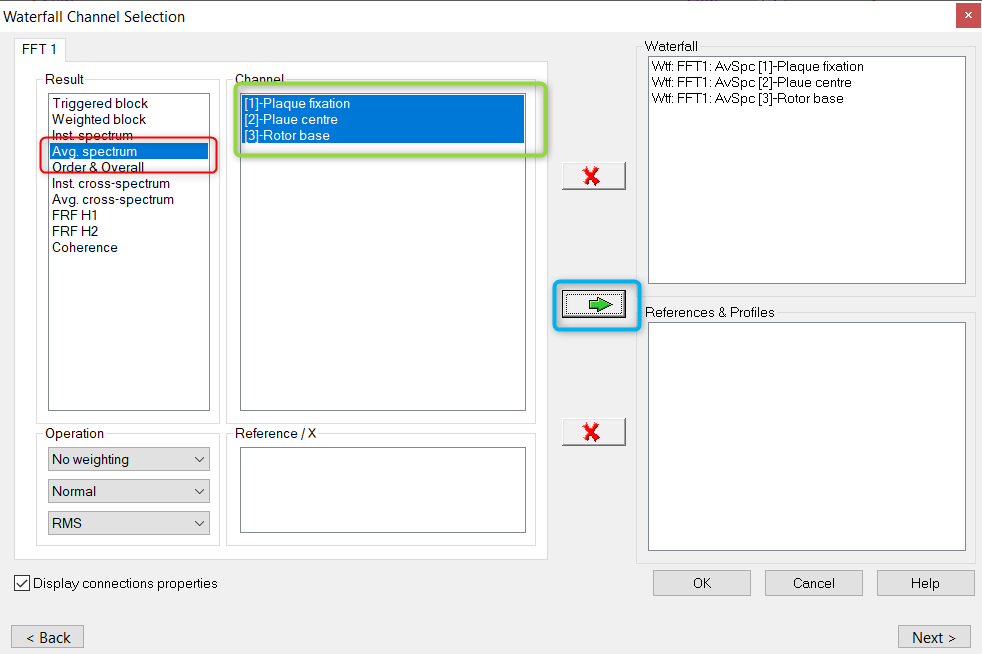
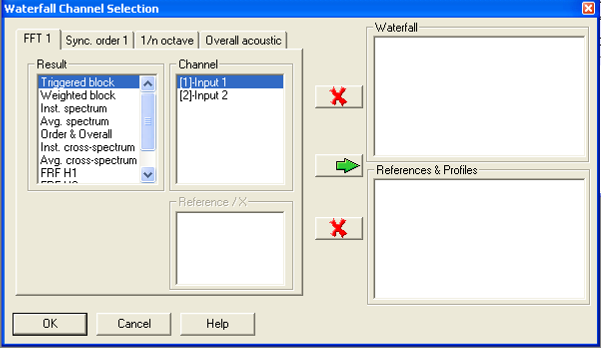
This will open the waterfall menu. Here, select the result (Avg. Spectrum), the channels you want to add (in that example, all the channels), and finally click on the green arrow ![]() :
:
Click on OK, the results have been added to the waterfall. You can now display it with the method described in the previous section.
Waterfall profile display
We saw in the previous section that a waterfall collect all-along the acquisition results from NVGate plug-ins, like a spectrum, in a single graph. Now if we connect to the waterfall a plug-in that is not delivering a complete trace, but a single scalar value, the collection during the acquisition off all these successive scalar values will result in a simple curve in the waterfall. This is what is called a Profile in NVGate.
In this section, I will show you how to display a profile of the Overall RMS level on a channel connected the the FFT 1 plug-in. I will present the three same method than presented in the previous section.
From the Show Result window
The Show Results window is the most common way of adding a result in the waterfall. Here I will show you how to simply display a Profile of the average spectrum for an acceleration input.
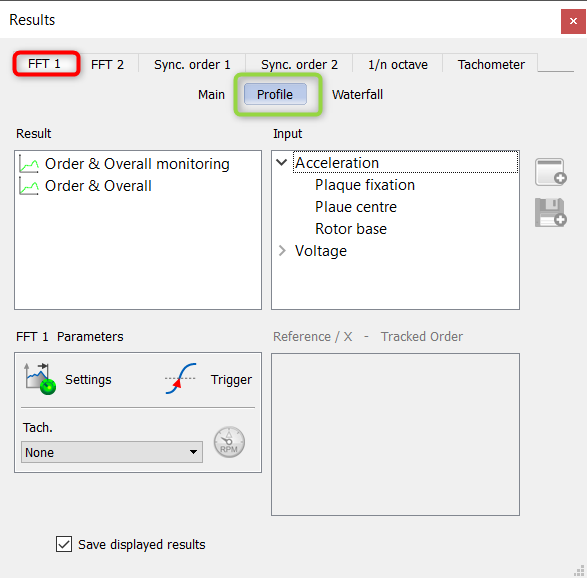
First, open the Show Result window, go in the FFT 1 tab, and reach the Profile section :
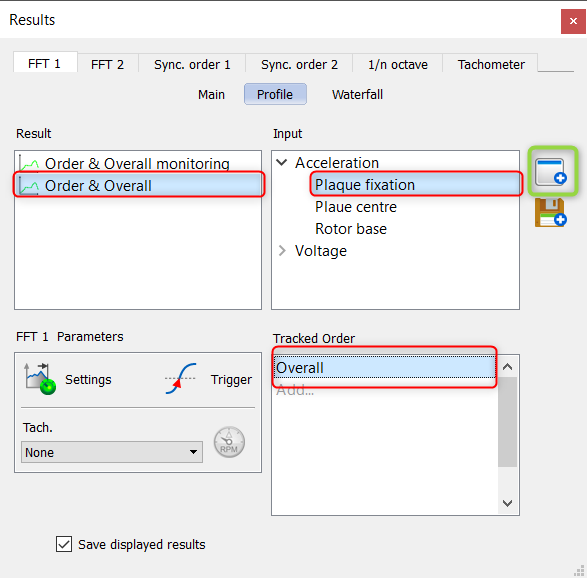
Then, select Order & Overall and the fist input. In the Tracked order section, select Overall. Finally click on ![]() to display the waterfall :
to display the waterfall :
The 3D view of the waterfall is displayed.
For more detail please see NVGate Software overview.
From the graph window
Waterfall Display
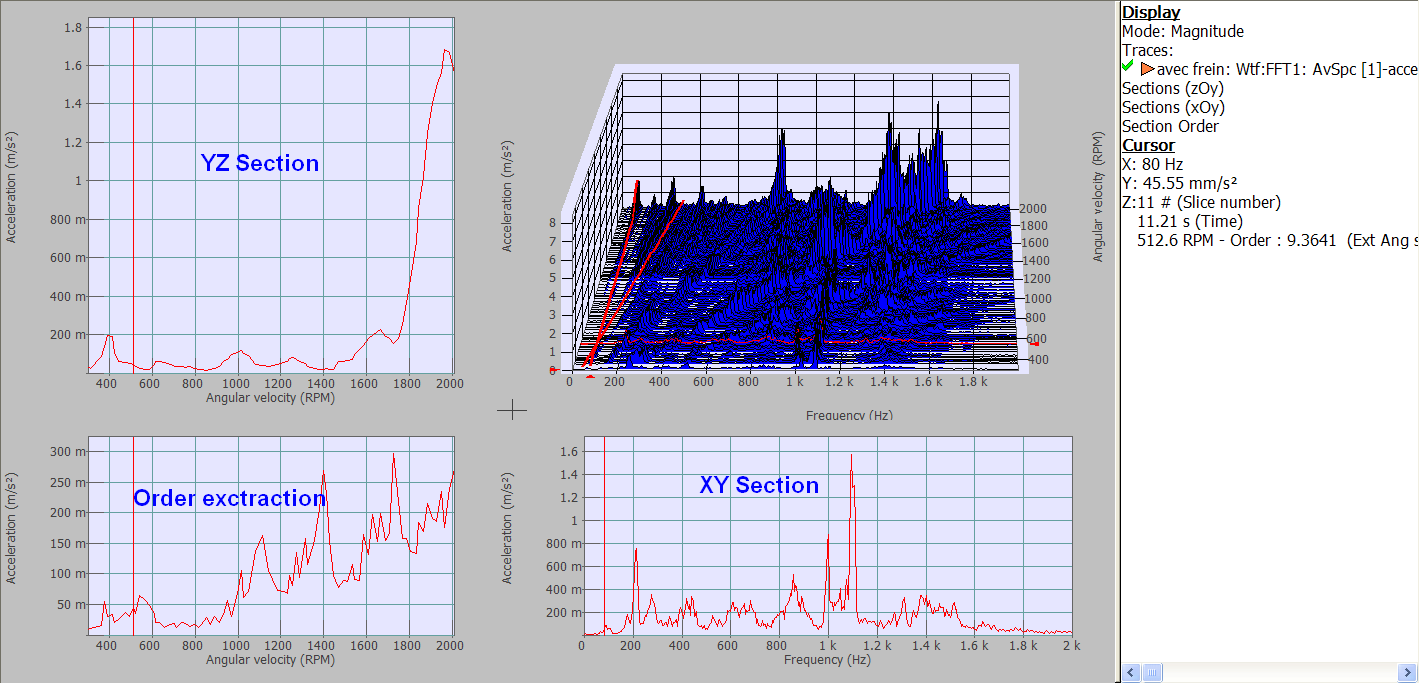
The Waterfall window offers a wide range of operation in order to go further in your measurement. It is possible to display XY and YZ sections as well as the extraction section.
Graphs
From the Display/Graph tab and the 3D group, select the graphs button:
The Waterfall window is composed of 4 mains area:
- 3D Waterfall graph or Colormap view
- XY section
- YZ section
- Extraction section (allows extracting orders from a spectrum with a tach or extracting a frequency from order spectrum with a tach).
Cursors give information about the displayed Waterfall trace (current X, Y and Z coordinates are available from the Infotrace).
Move the cursors either by using the drag & drop in the 3D view or by using the arrow pad of the keyboard (the cursor mode
must be selected).
Tip: Move the mouse over the cross in the middle of the window and click in order to resize manually the graph window.
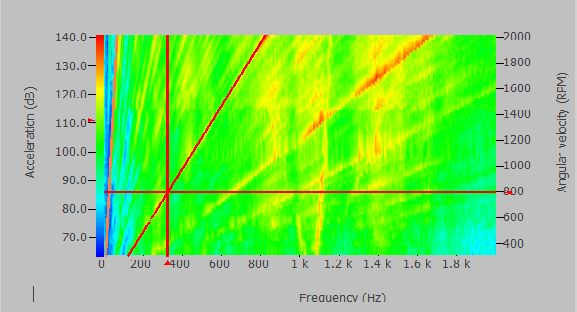
3D waterfall graph or ColorSpectrum view
3D Isometric
Freq/Time colormap
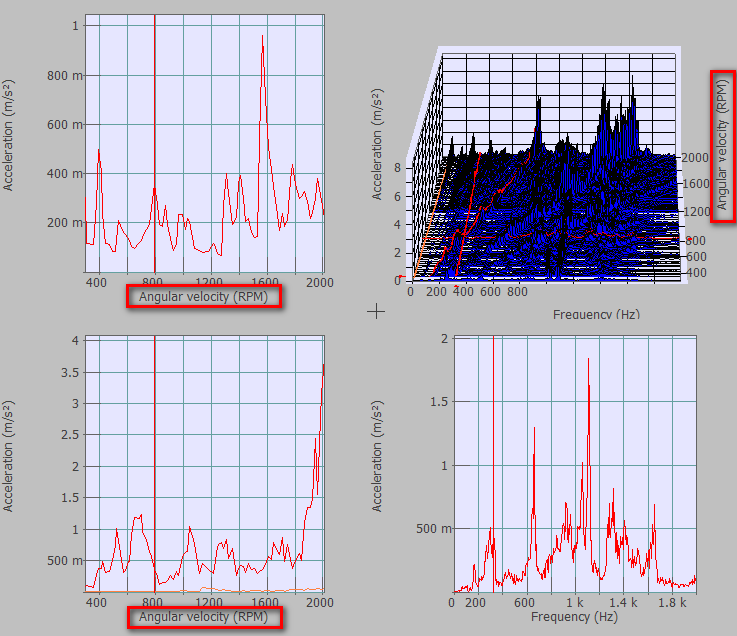
references
The waterfall data are arranged in accordance to the active reference. A reference is a scalar value (RPM, DC level, RMS, Parametric input) stored with the waterfall data
Right click on the grey part of the graph.to select the active reference
The displayed data are then sorted regarding the reference value.
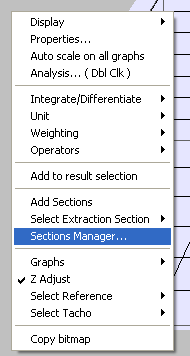
Section manager
You can fine tune the section parameters by using the section manager available by right clicking on the Waterfall window. For example, you want to visualize the first order.
Right click in the grey part of the graph and select Section manager.
Then choose Order extraction in the type list. Enter the order you want and click on Add.
Save results
This section gets you to select and save the Waterfall results.
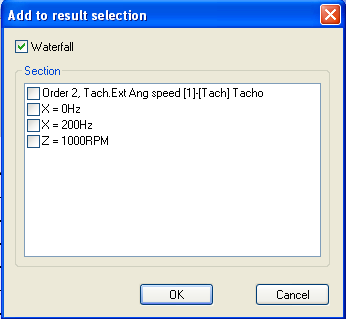
Right click on the Waterfall window and select Add to result selection. A window that allows you to select the results to be saved is displayed:
- The entire Waterfall results
- The extraction section (in this case it is the order 2 section) independently
- The XY section independently
- The YZ section independently
Click on OK.
Click on: Measurement/Save/ Save Measurement, your results selection will be automatically saved:
Settings
Glossary
This section will explain specific vocabulary of the Waterfall.
- Slice: this represents one acquisition of the Waterfall. A slice is a set of scalar and spectrum data acquired at the same time. The Waterfall is a stack slices.
- Depth: this is the maximum number of slices you can acquire on the Waterfall.
- Section: section at the current position of the cursor. The extraction section is created only if a tach has been selected in the Waterfall (see chapter 2 Display, Waterfall window menu).
- Reference: A scalar collected by the waterfall acquisition that can put in order the slices. The reference corresponds to the X-axis of the profiles and the Z-axis of the 3D graphs.
- Profiles or 2D Results: profiles of a scalar evolution in function of time or any reference associated with the waterfall
- Results 3D: spectra collected by the waterfall acquisition putted in order by a reference. These types of results are displayed in 3D graphs (3D, isometric or color-spectrogram).
Channel
The different channels are available by putting selected inputs in the plug-in.
It contains the results to be picked up by the Waterfall.
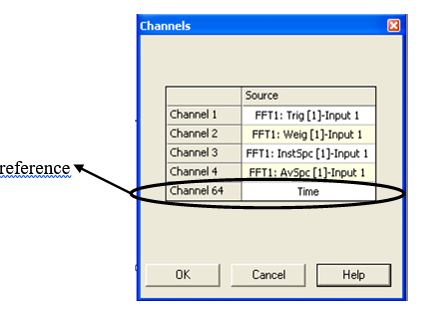
The following window let you select for each analysis plug-in, the channel related to the result.
- Source: In the ASB the channels are different from other ASB channels, the source of channel 1 and following are the results. The source of channel 64 and previous ones are the references. By default the time reference is always associated with a result source.
Trigger
Contains the settings related to triggering events and how to start and stop signal computation.
- Start: selects the event to start the waterfall acquisitions. This setting selects the event, which enable acquisition that is to say data collection does not operate while start event is no occurred. Any event can be chosen among the list of defined events. By default only the Free run and Manual events are available. Additional events can be defined in the "Event Definition" shared resource. The start time corresponds to the zero of the waterfall time scale. By default start is set to "free run" this allows waterfall acquisition to start immediately after run.
- Stop: selects the event to stop the waterfall acquisitions. This setting selects the event, which ends acquisition that is to say data collection, does not operate after stop event occurred. Any event can be chosen among the list of defined events. By default only the Free run and Manual events are available. Additional events can be defined in the "Event Definition" shared resource.
- Trigger: selects the event that trigs waterfall acquisitions. This setting selects the event which trig acquisitions that is to say a new data collection occur each time trigger event occurred. If trigger is set to periodic (period 20ms) the Waterfall acquisition will operate as fast as possible, this can hang user interface during acquisitions. The first time a source is selected for the Waterfall, if trigger = Periodic, then the event corresponding to the availability of the source results is assigned to the trigger. Ex: Setting FFT1 spectra into the waterfall plug-in will set Trigger to ’FFT1 result available’. By default the trigger is set to ’Periodic’ with a period of 20.
| List of events | Description |
| Manual | This event occurs when the user requests a manual trigger. |
| Events from Event module | see Event module |
| FFTx result available | This event is in the list if a signal is connected to an FFTx channel source. This event occurs when an FFT measurement starts. This event is generated at each calculation of a new spectrum in exponential averaging and at the end of averaging in linear. |
| Oct result available | This event is in the list if a signal is connected to an Octave channel source. This event occurs when an Octave measurement starts. This event is generated at each new spectrum calculated (every 256 samplings) for CBT, Fast, Slow, Impulse and exponential averaging. For the others averaging this event is generated at the end of averaging on t. |
| Order x result available | This event is in the list if a signal is connected to an Order x channel source. This event occurs when an Order x measurement starts. This event is generated at each calculation of a new spectrum in exponential averaging and at the end of averaging in linear. |
| Overall acoustic result available | This event is in the list if a signal is connected to an Overall acoustic channel source. This event occurs when an Overall acoustic measurement starts. This event is generated at each new spectrum calculated (every 256 samplings) for CBT, Fast, Slow, Impulse and exponential averaging. For the others averaging this event is generated at the end of averaging on t. |
| Periodic |
This event simplifies the instrument setup by shortcutting periodic event activation. Selecting periodic for the trigger will make appears the period setting. |
There is two ways to trigger the waterfall:
- The analyzer is running, it keeps in memory last measurements. Then with the waterfall you can select some specific results (for example for rpm or time).
- The plug-in triggering, at the end of each average the plug-in send an event. The plug-in put the rhythm into the waterfall. This mode is the default mode.
Mode
Contains the settings related to the Waterfall display mode.
- Mode:
Off: the Waterfall is inactive. This mode is useful to check your signal and your settings before the analysis.
One shot: the Waterfall is active between ’start’ and ’stop’, there’s only one acquisition (for example: coast downs or run ups). The Waterfall ends on stop or when the number of slices is full.
Continuous: this mode memorizes the n last slices (selected number of slices) before the stop event. This mode is similar to the ’time to stop’ mode of the recorder. This mode is different from the monitoring; the continuous mode is storage of measurement (for example: detection of ultimate strain).
- Number: the number of Waterfall slices (from 2 to 100 000). If the Waterfall trigger is a Delta RPM event, the "Event number" of this Delta RPM event is assigned to the number of Waterfall slices.
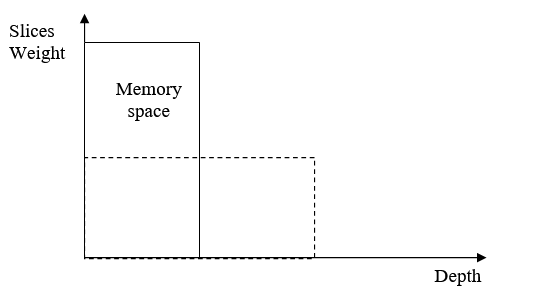
The waterfall depth is managed automatically, allowing the user to get the larger slices/points number depending on the current available physical memory on the PC running NVGate. This functionality protects waterfall or profiles acquisition from memory overloads. That means the depth of the Waterfall is a function of slices weight (which depend on the type of analysis).
The area is fixed. If the slices weight are important, then the depth would be small.
The area is function of the free memory space available when you select to use the Waterfall. The memory space has to be exactly the same during all the measurement that means the measurement could hang if you start another application on your computer during the measure.
The acquisition/display and save memory usages are managed separately and are sequenced. It result a larger of data managed by the waterfall and secured acquisition.
NVGate takes advantage of 64bits PC memory (> 2 GB) for larger memory allocation for the Waterfall. As NVGate remains a 32-bit application, PC memory is not used above 4 GB.
The following table summarizes the evolutions of the waterfall depth (for a given configuration: 32 ch 3,201 lines and PC):
For example a waterfall of 32 ch 3,201 lines handles up to:
| PC configuration | Slices |
| XP 32 bit 2GB RAM | 260 |
| Win7 64 bit 4GB RAM | 640 |
NB: In the stand-alone mode, the depth is limited (about 3 million samples per DSP) due to the analyzer memory size.
Notes:
- OVA: if the waterfall trigger selected were « OvA Leq result available », the slices number would depend on durations (average duration « T » and short duration « t ») from the sub module Average in Overall acoustic.
| Average type | Slices number |
| short Leq (t) | T/t |
| short Leq 1/8s | T/t |
| short Leq 1s | T/t |
| Linear, with repeat = End Of Averaging | T |
| Linear, with repeat != End Of Averaging | Independent |
- 1/N Octave: if the waterfall trigger selected were « Oct result available », the slices number would depend on durations (average duration « T » and short duration « t ») from the sub module Average in 1/N Octave.
| Average type | Slices number |
| Linear, with repeat = End Of Averaging | T |
| Linear, with repeat != End Of Averaging | Independent |
| Repeat | T/t |
| Exponential | Indepedent |
| Constant BT | Independent |
| short Leq 1/8s | T/t |
| short Leq 1s | T/t |
| Fast | Independent |
| Slow | Independent |
| Impulse | Independent |
The on line display uses more power and could slow displays but acquisitions and analyses remain real-time.
Waterfall status
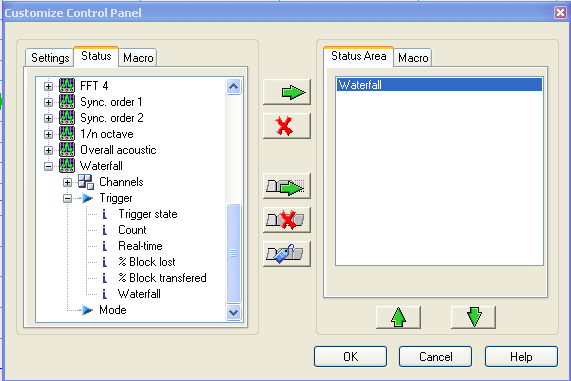
All statuses are available to add to the control panel
Waterfall
The current plug-in status is synthesized in a special progress-bar. This status bar is automatically displayed in the ’control panel’ when the plug-in is active (i.e. as soon as at least 1 input is connected to the Waterfall plug-in). This status is called ’Waterfall’ and it is available in the status ASB tree (see customize control panel).
This status displays the slice number acquired in the waterfall, the plug-in state (Run, Paused or Stop) and the real-time status.
The way the status bar is displayed, depends on the mode selected:
- ’One shot’ mode: the progress bar is filled from left to right.
- ’Continuous’ mode: the progress bar is filled from right to left with flashing until the end of the acquisition.
- ’Off’ mode: the progress bar is empty with the text ’Off’ inside.
The color of the bar and of the writing let you know what happens during the acquisition:
- Green background and white or black text: acquisition in real time.
- Red background and white or black text: the current acquisition is not real time.
- Green background and red text: the current acquisition is real time, but a previous acquisition was not real time.
Trigger State
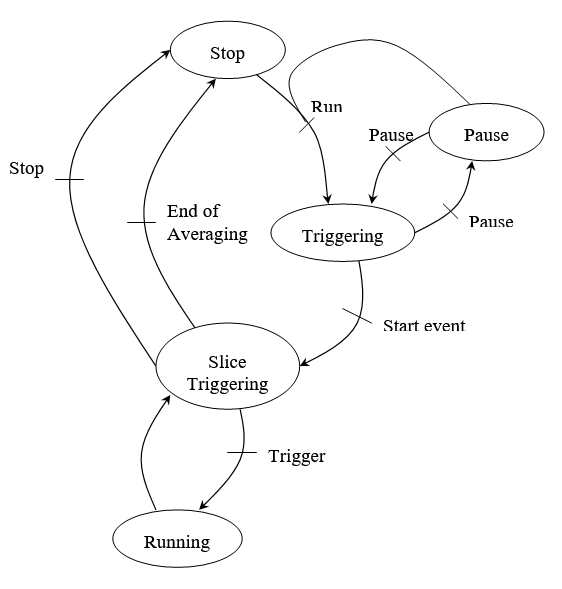
The following scheme describes the different states of the measurement:
By default the trigger state is on ’Stop’ and waiting for a ’Run’ (start or trigger). Then the state become ’Triggering’ and is waiting for a start event, the states become ’Block Triggering’ and is now waiting for a trigger event for being in the ’Running state.
The state is ’Stop’ after a stop event or at the end of averaging.
Count
This status displays the averaging count, that total number of slices already acquired.
Real-time
This status displays if the averaging is in real-time or not (i.e. the current block is analyzed or not). If the corresponding signal were not available at this time, the acquisition is not real-time. That means that the treatment is longer than the acquisition. There are three values for this state:
- ’OK’: The acquisition is real-time.
- ’No’: One previous acquisition was not real-time.
- ’-’: The acquisition is currently not real-time.
% Block lost
During an acquisition, results are stocked on the analyzer DSP in a buffer storage (limited to 4 MSample per DSP). If the depth of the waterfall is larger than this, then the PC must empty this buffer storage during acquisition (then the PC can store more results). The DSP to PC transfer takes place as soon as the waterfall acquisition starts depending on connection status (stand alone, poor quality). This process continuously empties the DSP memory. A block is lost if the DSP to PC transfer is not able to get it before the DSP memory is full.
In ’one shot’ mode and for depth smaller than X the acquisition is preferred to the displaying, i.e. the display takes place at the end of acquisition
In ’continuous’ mode or for depth larger than X, the displaying is preferred to the acquisition, in order to see quickly any change during the measurement, some block may be lost.
% Block transferred
This status displays the percentage of block that the PC could have recovered from the DSP buffer storage.
Note that: %Block lost + %Block transferred = 100%.
