Difference between revisions of "NVGate FFT"
(Created page with "====FFT==== This plug-in is used to compute the input signal FFT (you can also compute time signals in post analysis mode with the Player module). '''Available results''': W...") |
|||
| Line 1: | Line 1: | ||
==FFT== | |||
This plug-in is used to compute the input signal FFT (you can also compute time signals in post analysis mode with the Player module). | This plug-in is used to compute the input signal FFT (you can also compute time signals in post analysis mode with the Player module). | ||
Revision as of 17:59, 17 April 2020
FFT
This plug-in is used to compute the input signal FFT (you can also compute time signals in post analysis mode with the Player module).
Available results:
With Resolution being the value of the FFT x/FFT analysis/Resolution setting
| Type | Size | Dimension | Domain | Save |
| Filtered signal | 256 pt | 2D | time | Display only |
| Triggered block | (Resolution-1)*2,56 | 2D | time | Yes |
| Trigger Shaftview | (Resolution-1)*2,56 | 2D | Angle | Yes |
| DC | 1pt | 1D | Yes | |
| RMS | 1pt | 1D | Yes | |
| Min level | 1pt | 1D | Yes | |
| Max level | 1pt | 1D | Yes | |
| Peak | 1pt | 1D | Yes | |
| Peak-Peak | 1pt | 1D | Yes | |
| Crest Factor | 1pt | 2D | Yes | |
| Avg. block | (Resolution-1)*2,56 | 2D | time | Yes |
| Avg. Trigger Shaftview | (Resolution-1)*2,56 | 2D | angle | Yes |
| Weighted block | (Resolution-1)*2,56 | 2D | time | Yes |
| Spectrum | Resolution | 2D | spectral | Yes |
| Inst. spectrum | Resolution | 2D | spectral | Yes |
| Avg. spectrum | Resolution | 2D | spectral | Yes |
| Order & Overall | 1 pt | 1D | Yes | |
| Inst. cross-spectrum | Resolution | 2D | spectral | Yes |
| Avg. cross-spectrum | Resolution | 2D | spectral | Yes |
| FRF H1 | Resolution | 2D | spectral | Yes |
| FRF H2 | Resolution | 2D | spectral | Yes |
| Coherence | Resolution | 2D | spectral | Yes |
| Order profile | 2048 pt max | 2D | time | Display only |
| Zoomed spectrum | Resolution | 2D | spectral | Yes |
| Zoomed avg. spectrum | Resolution | 2D | spectral | Yes |
| Lissajou | (Resolution-1)*2,56 | 2D | Time Vs. time | Yes |
| Zoomed cross spectrum | Resolution | 2D | spectral | Yes |
| Zoomed avg. cross spectrum | Resolution | 2D | spectral | Yes |
| Zoomed FRF H1 | Resolution | 2D | spectral | Yes |
| Zoomed FRF H2 | Resolution | 2D | spectral | Yes |
| Zoomed Coherence | Resolution | 2D | spectral | Yes |
| Zoomed Cepstrum | Resolution | 2D | Yes | |
| AutoCorrelation | (Resolution-1)*2,56 | 2D | time | Yes |
| CrossCorrelation | (Resolution-1)*2,56 | 2D | time | Yes |
| Inst.AutoCorr | (Resolution-1)*2,56 | 2D | time | Yes |
| Avg.AutoCorr | (Resolution-1)*2,56 | 2D | time | Yes |
| Inst.CrossCorr | (Resolution-1)*2,56 | 2D | time | Yes |
| Avg.CrossCorr | (Resolution-1)*2,56 | 2D | time | Yes |
| Cepstrum* | 1/((Resolution-1)*2,56) | 2D |
Quefrency | Yes |
| InstCepstrum* | 1/((Resolution-1)*2,56) | 2D | Quefrency | Yes |
| AvgCepstrum* | 1/((Resolution-1)*2,56) | 2D | Quefrency | Yes |
| ZommedCepstrum* | 1/((Resolution-1)*2,56) | 2D | Quefrency | Yes |
- Filtered signal: This result is available if a filter is selected in the FFT x/Channel x/Input filter setting. It displays the input time signal after filtering.
- Triggered block: This displays the signal after being triggered by the event selected with the FFT x/Trigger/Trigger setting.
- * Results below are calculated from the triggered block results. The refresh & computation rate depend on the PC to analyzer connection availability (non real-time results)
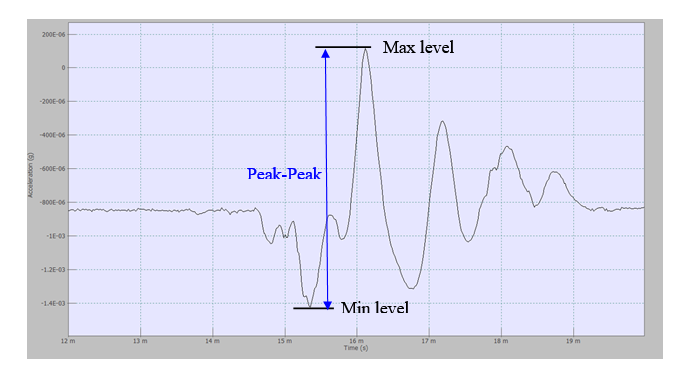
- Min level: displays the maximal value of the signal.
- Max level: displays the minimal value of the signal.
- Peak: displays the absolute value of Min level and Max level.
- Peak-Peak: displays the difference between Min level and max level. Peak-Peak level ≥ 0.
- Crest factor: displays the ratio Peak level/RMS level. Characteristics of the Crest Factor:
- Crest Factor ≥ 1
- DC level = 1
- Crest Factor of sinus =
- Max level =
N = number of samples in the triggered block = 2.56*lines number-1
- Avg. block: This result is available if the FFT x/Average/Domain setting value is Time. It the time signal block average.
- Weighted block: This result displays the signal after being weighted by the weighting window selected using the FFT x/Channel x/Weighting window setting.
- Spectrum: This result is available if the FFT x/Average/Domain setting value is Time. It displays the result of the FFT processing after time averaging.
- Inst. spectrum: This result is available if the FFT x/Average/Domain setting value is Spectral. It displays the FFT processing results.
- Avg. spectrum: This result is available if the FFT x/Average/Domain setting value is Spectral. It displays the instant spectrum average result.
- Order & Overall: It displays the result of the computation of the orders chosen with the FFT x/Channel x/Tracked order setting and the Overall level if the FFT x/Overall Analysis/Band power tracking is set to On.
- Inst. cross-spectrum: This result is not available if there is no cell checked in the FFT x/FFT analysis/Cross spectrum matrix. It displays the cross spectrum between the 2 channels selected.
- Avg. cross-spectrum: This result is not available if there is no cell checked in the FFT x/FFT analysis/Cross spectrum matrix. It displays the instant cross spectrum average results.
- FRF H1: This result is not available if there is no cell checked in the matrix of the FFT x/FFT analysis/Cross spectrum matrix. It displays the Frequency Response Function H1, see Appendix for details.
- FRF H2: This result is not available if there is no cell checked in FFT x/FFT analysis/Cross spectrum setting. It displays the Frequency Response Function H2, see Appendix for details.
- Coherence: This result is not available if there is no cell checked in the FFT x/FFT analysis/Cross spectrum matrix. It displays the H1/H2 ratio.
- Order profile: It displays changes in the Order & Overall result.
- AutoCorrelation: This result is available if correlation is selected in the FFT x/Correlation and FFT x/Average/Domain setting value is Time.
- CrossCorrelation: This result is available if correlation is selected in the FFT x/Correlation and FFT x/Average/Domain setting value is Time. This result is not available if there is no cell checked in the FFT x/FFT analysis/Cross spectrum matrix
- Inst. AutoCorr: This result is available if correlation is selected in the FFT x/Correlation and FFT x/Average/Domain setting value is Spectral or Frequency synchronous.
- Avg. AutoCorr: This result is available if correlation is selected in the FFT x/Correlation and FFT x/Average/Domain setting value is Spectral or Frequency synchronous.
- Inst. CrossCorr: This result is available if correlation is selected in the FFT x/Correlation and FFT x/Average/Domain setting value is Spectral or Frequency synchronous. This result is not available if there is no cell checked in the FFT x/FFT analysis/Cross spectrum matrix
- Avg. CrossCorr: This result is available if correlation is selected in the FFT x/Correlation and FFT x/Average/Domain setting value is Spectral or Frequency synchronous. This result is not available if there is no cell checked in the FFT x/FFT analysis/Cross spectrum matrix
- Zoomed spectrum: This result is available when the value of the FFT x/FFT zoom/Factor setting is different from None. It displays the FFT zoomed signal processing result. The minimum and maximum of the X axis are the values of the FFT x/FFT zoom/Min freq setting and FFT x/FFT zoom/Max freq settings respectively.
- Zoomed avg. spectrum: This result is available when the FFT x/FFT zoom/Factor value setting is different from None. It displays the zoom spectrum average result. The minimum and maximum of the X axis are the values of the FFT x/FFT zoom/Min freq setting and FFT x/FFT zoom/Max freq setting respectively.
- Lissajous: This result simultaneously displays the value of the channel chosen on the Y axis and the value of the reference channel on the X axis at the same time.
- Cepstrum: This result is always available. X scale is in quefrency (time equivalent) and Y scale is always in dB.
Cepstrum analysis can be used as a tool for the detection of periodicity in a spectrum, for examples families of harmonics with uniform spacing.
A high quefrency represents rapid fluctuations in the spectrum (small frequency spacings) and a low quefrency represents slow changes with quefrency (large frequency spacings). Note that the quefrency does not give information regarding absolute frequency, only about frequency spacings.
- Zoomed cross-spectrum: This result is available when the FFT x/FFT zoom/Factor value setting is different from None and if there is at least one cell checked in the FFT x/FFT analysis/Cross spectrum matrix. It displays the zoomed cross spectrum between the two channels selected. The minimum and maximum of the X axis are the values of the FFT x/FFT zoom/Min freq setting and FFT x/FFT zoom/Max freq setting, respectively.
- Zoomed avg. cross-spectrum: This result is available when the FFT x/FFT zoom/Factor value setting is different from None and if there is at least one cell checked in the FFT x/FFT analysis/Cross spectrum matrix. It displays the zoomed cross spectrum average result. The minimum and maximum of the X axis are the values of the FFT x/FFT zoom/Min freq setting and FFT x/FFT zoom/Max freq setting, respectively.
- Zoomed FRF H1: This result is available when the FFT x/FFT zoom/Factor value setting is different from None and if there is at least one cell checked in the FFT x/FFT analysis/Cross spectrum matrix. It displays the zoomed Frequency Response Function H1, see Appendix for details. The minimum and maximum of the X axis are the values of the FFT x/FFT zoom/Min freq setting and FFT x/FFT zoom/Max freq setting, respectively.
- Zoomed FRF H2: This result is available when the FFT x/FFT zoom/Factor value setting is different from None and if there is at least one cell checked in the FFT x/FFT analysis/Cross spectrum matrix. It displays the zoomed Frequency Response Function H2, see Appendix for details. The minimum and maximum of the X axis are the values of the FFT x/FFT zoom/Min freq setting and FFT x/FFT zoom/Max freq setting, respectively.
- Zoomed Coherence: This result is available when the FFT x/FFT zoom/Factor value setting is different from None and if there is at least one cell checked in the FFT x/FFT analysis/Cross spectrum matrix. It displays the zoomed H1/H2 ratio results. The minimum and maximum of the X axis are the values of the FFT x/FFT zoom/Min freq setting and FFT x/FFT zoom/Max freq setting, respectively.
- Zoomed Cepstrum: This result is available when the FFT x/FFT zoom/Factor value setting is different from None. It displays the zoomed cepstrum.
Computation SPUs:
| Bandwidth | Fdec | Resolution | Envelope | Zoom | SPU/Channel for Real-time |
SPU/Channel for non Real-time |
| 20k | 1 | 401 | No | No | 1 | 0,5 |
| 10k | 1 | 401 | No | No | 0,5 | 0,25 |
| Nk | 1 | 401 | No | No | =N/20 | =N/40 |
| 10k | 2 | 401 | No | No | 1 | 1 |
| 5k | 4 | 401 | No | No | 0,8 | 0,6 |
| 2k | 10 | 401 | No | No | 0,6 | 0,6 |
| 1k | 20 | 401 | No | No | 0,5 | 0,6 |
| Lower than 1k |
Higher than 20 |
401 | No | No | 0,5 | 0,5 |
| 20k | 1 | 401 and below |
No | No | 1 | 0,5 |
| 20k | 1 | 801 | No | No | 1,25 | 0,5 |
| 20k | 1 | 1601 | No | No | 1,5 | 0,5 |
| 20k | 1 | 3201 | No | No | 2 | 0,5 |
| 20k | 1 | 6401 | No | No | 3 | 0,5 |
| 20k | 1 | 401 | No | No | 1 | 0,5 |
| 20k | 1 | 401 | No | Yes | 2 | 1,5 |
| 20k | 1 | 401 | No | No | 1 | 0,5 |
| 20k | 1 | 401 | Yes | Yes | 3 | 3 |
=
=
Channel
Contains the settings related to the source input.
- Source: input source to be analyzed. It may come from the input Front-end or from the Player in the post analysis mode (see the post analysis chapter). In the post analysis mode, the tracks with a signal bandwidth lower than the range of the FFT cannot be plugged.
- Input filter: filter to be used for filtering the source before analysis. The Filters that are not compatible with the FFT range cannot be selected (see the Filter builder chapter). The A and C weighting on time domain are available in the NVGate® filter list.
These acoustics filters can be applied as all other NVGate® filters pass/stop band, high/low pass, and integrators.
Note: These weighting on time domain are no longer available for pass band higher than 25.6kHz and lower than 10kHz.
For filter characteristics, see the Appendix.
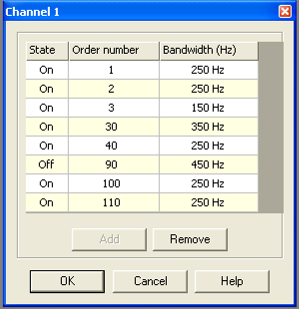
- Tracked order: orders to be tracked with the FFT Constant Band Tracking mode. Up to 8 different orders may be selected for each channel, and there are three settings for each order:
State: ON if you want the order to be computed
- Order number: Select the number of the order you want to track, from 0.001 up to 800.
- Bandwidth: Select the bandwidth used to compute the energy of the order from 3*FrequencyRange/(NumberOfLine-1) up to FrequencyRange with FrequencyRange being the value of the setting Range from the FFT analysis sub-module, and NumberOfLines being the value of the Resolution setting from the FFT analysis sub-module.
- Weighting window: window used to weighting the signal before the processing. There are six set windows: Uniform, Hanning, Hamming, Kaiser Bessel, Flat top, and three customized windows: Force, Response and Dual exp (see the Time Windows chapter). For the window characteristics, see the Appendix.
Trigger
Contains the settings related to trigger events and how to start, and stop signal computation.
- Start: defines the event to start the analysis. The user can choose any event among the list of defined events. By default only the Free run and Manual events are available. The user can define another event in the "Event Definition" shared resources and then use this event for the "Start" condition.
- Stop: defines the event to stop the analysis. The user can choose any event among the list of defined events. By default only the Free run and Manual events are available. The user can define another event in the "Event Definition" shared resources and then use this event for the "Stop" condition.
- Trigger: defines an event to compute the FFT on one block of time signal. After the computation, the plug-in waits for a new event to compute another block.
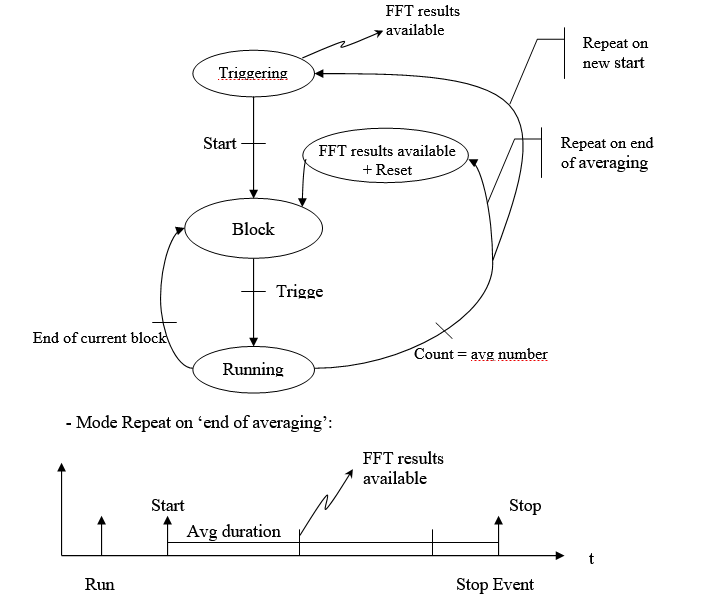
- Repeat: this setting is used to select a condition for the plug-in to be restarted. If an event is selected as a Start event, the option "New start" is available, and when this mode is selected each Start event restarts the plug-in. The "End of averaging" mode is available when the value of the FFT x/Average/Type setting is different than "Exponential" mode. This restarts the plug-in when the averaging is finished. For linear average when it is set to "End of averaging", the "Avg duration" gives the periodicity of the average restart. By default the Repeat mode is set to "Off".
The following scheme describes the repeat mode for the FFT analysis:
The ’Run’ corresponds to the start of the analyzer. The start is the beginning of average duration. At the end of the first average, the second average will start and so on till the end of the integration time (even if the last short time integration duration is not over). Each averaging has the same size, except the last that can be smaller.
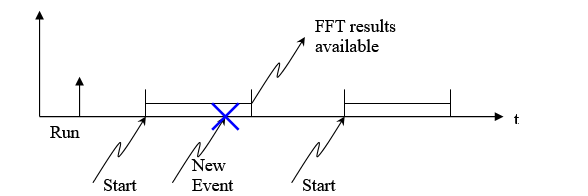
- Mode Repeat on ’New start’:
The ’Run’ trigger the analyzer, but the average begins at the start event (set in the event definition). This averaging stops at the end of average duration or at the stop event. Then the next averaging is waiting for the new start event to occur.
In case a new event occurs during a previous averaging, this start event won’t be effective because the previous average duration is not over, you can only set other event after the end of the previous one.
- Start delay: time delay applied to the time the start event occurs, or block percentage delay.
The delay in percentage is calculated as:
Start delay in % = [(Start delay in s) / (Block duration)] * 100
This value of start delay can be negative and also greater than 100 %.
Note: some settings (bandwidth, number of lines) are directly linked with the start delay, then by modifying any of these settings the last Start delay modified (time or %) would be fixed, and the other one will be automatically sets regarding modified settings. - Accept mode: used to select the method for rejecting signal blocks.
| Mode | Description |
| Normal | All the blocks are accepted |
| Manual | After the computation of each block, the plug-in is in the Waiting mode and waits for the user to push the accept or reject button |
| Overload rejection | Blocks with an overload are automatically rejected |
- Trigger Frequency: Adjust the synchronous frequency (for Frequency Domain Synchronous Analysis).
Hidden/fixed: The Trigger frequency is enabled when FFTx/Average/Domain is set to Frequency Synchronous.
Average
Contains the settings related to the type of averaging of the signals to be computed.
- Domain: You can choose between Spectral, Time or Frequency Synchronous.
| Domain | Description |
| Spectral | Calculates the average after FFT processing, |
| Time | Calculates the average before FFT processing. |
| Frequency Synchronous | Frequency domain Synchronous averaging (FDSA) uses one frequency band as the phase reference, and each FFT block is recomputed so that the phase of the frequency chosen with the FFT x/FFT analysis/Trigger Frequency setting is 0. Enables the Trigger frequency setting to be adjusted from FFTx/Trigger/Trigger frequency. |
- Size: The number of signal blocks used to compute the average, from 1 up to 1000000000.
- Duration: The duration of the signal used to compute the average. This depends on four other settings: Size from the same sub-module, and Range Overlap and Resolution from the FFT Analysis sub-module. BlockDuration = (NumberOfLines-1)/FrequencyRange
Duration = BlockDuration * (Size - (Size-1)*Overlap)
With BlockDuration being the duration of one block of signal, NumberOfLines being the value of the setting Resolution from the FFT analysis sub-module, FrequencyRange being the value of the setting Range from the FFT analysis sub-module, Size being the value of the setting Size from the same sub-module and Overlap being the value of the setting Overlap from the FFT analysis sub-module.
The average duration disappears when the trigger of the FFT is changed from "Free Run" to a different trigger (Manual, Ext.Sync., Delta RPM,…) as the elapsed time between two triggering is not predictable anymore."
- Type: The method of averaging the signal. There are four different averaging modes: Linear, Exponential, Peak hold, and Referenced Peak hold.
| Type | Description |
| Linear | Linear averaging of results is carried out on the value of the Size setting from the same sub-module. The FFT plug-in automatically stops when the given number of averages is reached. |
| Exponential | In this mode of computation, each new average is obtained by adding its previous value and the new FFT result divided by the value of the Size setting, and then subtracting its previous value divided by the value of the Size setting. |
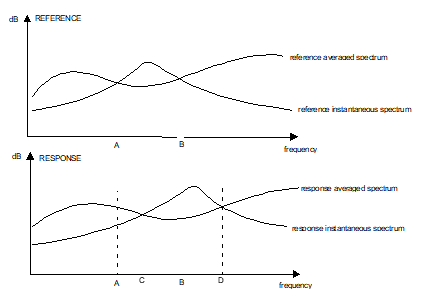
| Peak hold | This method processes the peaks found in their spectrum power density for each channel, and for a number of FFT analysis given by the value of the Size setting. The FFT plug-in automatically stops when a given number of averages is reached. For each frequency line, each time the value of the instantaneous spectrum is greater than the value of the averaged spectrum, the averaged spectrum value becomes equal to the instantaneous spectrum value. Otherwise, the average spectrum value is not modified. Note: in this case averaged spectrum doesn’t mean average value but hold value. |
| Referenced Peak hold |
|
Hidden/fixed: Peak hold and Referenced Peak hold are only available if the Domain setting from the same sub-module is set to Spectral.
- Reference channel: channel to be used as a reference in the Referenced Peak hold averaging mode. This setting is only available when this averaging mode is selected. You can choose between the channels that are plugged into the FFT plug-in, if ’None’ is selected the average processing is the same as the Peak hold mode.
FFT analysis
Contains the settings related to the type of analysis of the signals to be computed.
- Range: the FFT plug-in frequency range. The analyzer sampling frequency divided by 2.56 limits this range, and the minimum is obtained by dividing this limit by 50000. For example, if the analyzer sampling frequency is 51,2kS/s, then the max range is 20 kHz and the min is 400mHz. In post analysis mode, the Max Bandwidth setting from the Player plug-in provides the analyzer sampling frequency by multiplying the value by 2.56 (ex: if max bandwidth = 20 kHz then the analyzer sampling frequency is 51.2kS/s), otherwise, the analyzer sampling frequency is provided by the input sampling setting from the Front end plug-in input setting sub-module.
- Resolution: This is a fixed setting, for information only. It displays the frequency span between two points of a spectral result. The FFT resolution is obtained by dividing the FFT frequency range by the resolution minus 1. For example if the FFT Range is 20 kHz and the resolution is 401 lines, then the frequency span is: 20000 / (401 - 1) = 20000 / 400 = 50Hz.
- Overlap: Defines the amount of overlap of input signals between two successive FFT computations, from 0% to 99.99%.
- Number of lines: The FFT number of analyzed lines. There are seven possibilities: 101, 201, 401, 801, 1601, 3201 or 6401 lines.
- Trigger Frequency: This setting is only available when the FFT x/Average/Domain setting is "Synchronous". The value can be chosen from the FFT Frequency range; this frequency is the phase reference: each FFT block is recomputed so that the phase of the frequency chosen is 0.
- Reverse cross function: this setting allows calculating the cross function of the greyed part of the Cross spectrum setting. Default value is True except on cascaded mode (multiple hardware) as the number of reference spectrum to be carried between the analyzers may lead to a dramatic loss of performances.
- Cross spectrum: Matrix used for the selection of the computed cross spectra, Only the upper half of the matrix can be used, because when a box is checked, two cross spectra are computed with each of both channels being the reference. Selecting the cross spectra is necessary to have access to some results: instant cross spectrum, average cross spectrum, FRF H1, FRF H2 and coherence.
FFT zoom
Unlike the display zoom function; the analysis zoom function allows you to zoom into a selected bandwidth increasing the analysis resolution.
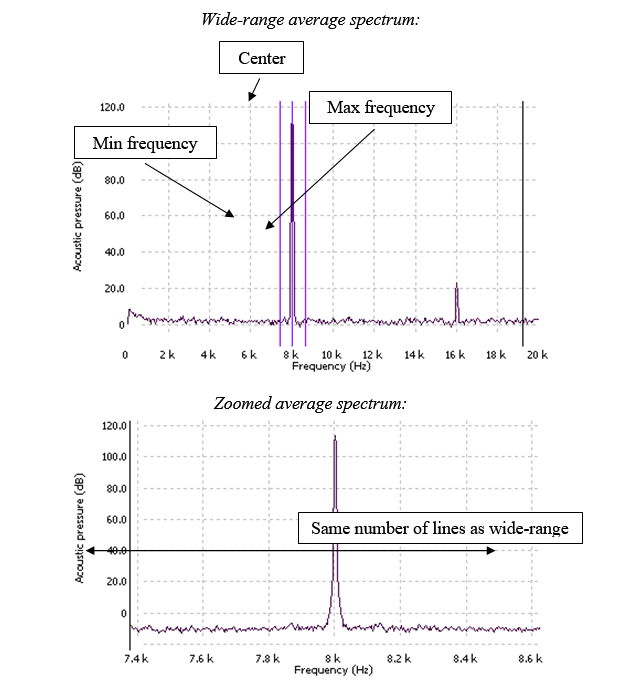
- Factor: Switch the FFT zoom on or off depending on its value. If the value is "None" there is no zoom result available. There are seven possible factors: x2, x4, x8, x16, x32, x64, x128. The value stands for the dividing factor to be used to obtain the frequency span of the zoom results. For example, if the FFT resolution is 401 lines and the Frequency range is 20kHz then the frequency span is 50Hz. If the zoom is activated with a x4 factor, the frequency span of the zoom results is 50 / 4 = 12,5Hz. The zoom results are Zoomed Spectrum, Zoomed Average Spectrum, and Zoomed cross spectrum, Zoomed Avrg cross spectrum, Zoomed FRF H1, Zoomed FRF H2, Zoomed Triggered Block and Zoomed Coherence if there is at least one cell checked in the FFT x/FFT analysis/Cross spectrum matrix. These results are available when the Factor is different from the None value.
- Center: The center frequency of the zoom. The value can be set directly, or automatically by changing the Min Frequency or the Max frequency settings.
- Min freq: The minimum frequency of the zoom. The value can be set directly, or automatically by changing the Center or Factor settings to match them.
- Max freq: The maximum frequency of the zoom. The value can be set directly, or automatically by changing the Center or the Factor settings to match them.
Note: These zoom settings are working as following:
- Set Factor and Center (min and max values are update automatically with the center frequency) if the zoom would be done around a central frequency well defined. By modifying Factor, max and min frequencies will be automatically set to define zoom limits.
- Set max and min frequencies (center and factor are update automatically) if the limits in frequency would be fixed on specific values.
- Envelope: FFT plug-in integrates as a standard an amplitude demodulation analysis that provides envelope results. Even demodulated time domain signal and envelope spectra can be handled for real time display, result saving and report generation.
Envelope demodulation is linked to the FFT zoom activation. When FFT zoom is different from none, the envelope demodulation can be activated through a simple click.
Then the envelope limits (range, modulating, frequency) are set by the zoom settings. It is then possible to get simultaneously the entire spectral and time information with the following displays:
Hidden/fixed: The envelope is available only if the zoom is active.
Note: All frequency setting, such as FFT zoom boundaries, start and stop sweep sine, filter limits, etc… can be directly controlled from a display. This is easily achieved by drag and drops the corresponding setting inside a compatible (with X-axis as frequency) graph.
As an example (see fig below) you can easily focus on spectra area using the zoom center setting as a cursor in the wideband FFT spectra. Then it is efficient to move the center of the FFT zoom from one peak to the order as a cursor. In cab also be useful to control pass-band filter limits, directly from the corresponding spectra. Try it when you use the monitor filter scalar values.
