Difference between revisions of "NVGate Time Domain Analysis"
| Line 1: | Line 1: | ||
[[category:NVGate]] | [[category:NVGate]] | ||
[[category:WikiOros]] | |||
The TDA plug-in is designed to get the most from the time domain signal completing the frequency/order analyses. This plug-in offers flexible signal overview and statistical extraction in parallel. | The TDA plug-in is designed to get the most from the time domain signal completing the frequency/order analyses. This plug-in offers flexible signal overview and statistical extraction in parallel. | ||
[[File:TDA_3.png|500px|right]] | [[File:TDA_3.png|500px|right]] | ||
Latest revision as of 11:50, 26 November 2024
The TDA plug-in is designed to get the most from the time domain signal completing the frequency/order analyses. This plug-in offers flexible signal overview and statistical extraction in parallel.
This TDA plug-in provides 2 types of results:
- Time views and associated extracted results. It’s an oscilloscope-like function, to view the time domain series. This does not record the time signal, only their statistical content.
- Statistical scalar result. The TDA computes the statistical content of the connected input on a specific time and average basis. These scalars levels are available as view meter or profiles (using the Waterfall Plug-in).
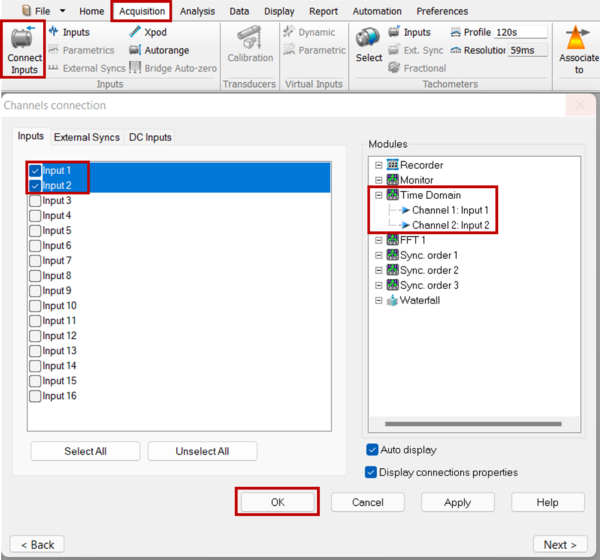
Connect channels
Click on connect inputs and drag and drop the channels on TDA plug in.
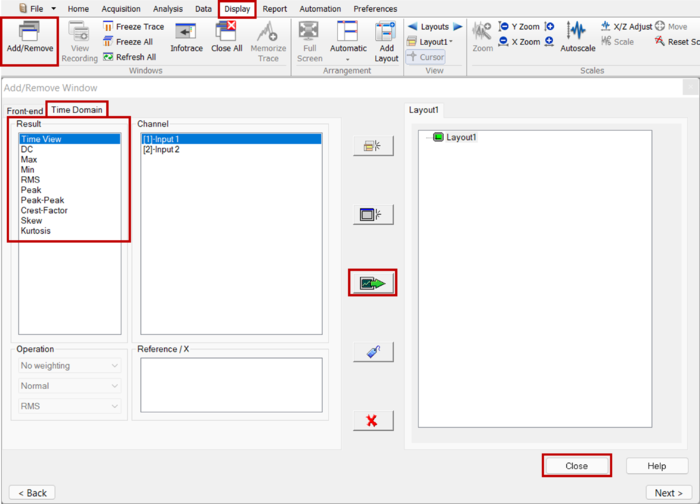
Available results:
The results can be display using the add remove windows:
| Type | Size | Dimension | Domain | Save |
| DC | 1pt | 1D | Yes | |
| RMS | 1pt | 1D | Yes | |
| Min level | 1pt | 1D | Yes | |
| Max level | 1pt | 1D | Yes | |
| Peak | 1pt | 1D | Yes | |
| Peak-Peak | 1pt | 1D | Yes | |
| Crest Factor | 1pt | 1D | Yes | |
| Kurtosis | 1pt | 1D | Yes | |
| Time View | 2048 pt max | Compressed Time | time | Yes |
- DC: the average DC value of the time signal
- RMS: the RMS value of the time signal (DC being removed)
- Min: the minimum level of time signal
- Max: the maximum level of time signal
- Peak: the absolute value of Min level and Max level.
- Peak-Peak: displays the difference between Min level and max level. Peak-Peak level ≥ 0.
- Crest factor: displays the ratio Peak level/RMS level. Characteristics of the Crest Factor:
- Kurtosis: the kurtosis value (4th order moment) of the time signal
- Time View
Profiles of scalar values (Max, Peak-Peak,...) can be displayed using the Waterfall Plug-in.
Display
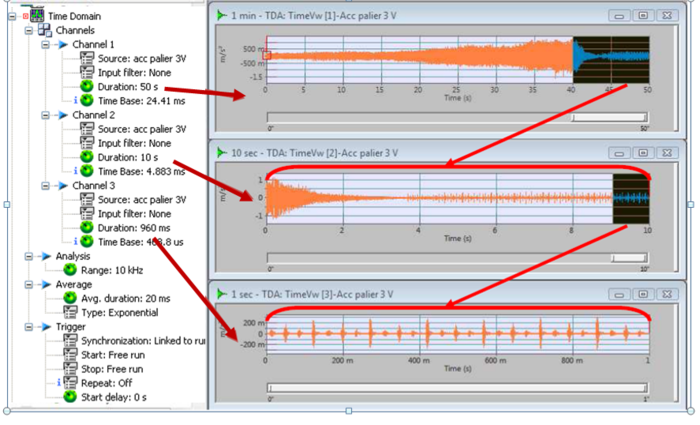
The Time view is an oscilloscope-like view of the time domain series which scrolls the signal on a user define duration. The duration of the viewed signal is independent for each channel. That is to say it allows monitoring the same signal on different durations.
It’s possible to display several TDA channels in same window even if the durations are different. The windows size will be set according to the larger duration.
X zoom is not available at Time View, display is fixed to multi graph.
This window handles 3 cursors:
- Main cursor where is retrieved the values displayed at infotrace
- Cursors 1-2 used for selection. The scalar values displayed in the infotrace are computed according to this selection.
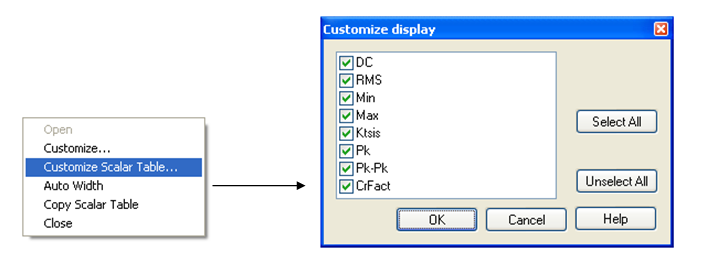
Scalar table may be setup to add / remove scalar that may be displayed:
Content of Scalar Table could be copy to export to another application.
The setup of the monitored duration determines the analysis steps. These steps are indicated in the Time base states. The Time base is the time interval for each new point in the Time view signal. The time view duration is settable from 320 ms to 100 000 s (27 hours) with a 20 kHz bandwidth.
The minimum duration depends on the plug-in bandwidth. For example at 20 kHz with a duration of 10.24 sec, the Time base is set at 5 ms. A new point in the Time view will occur each 5 ms and the maximum number of points in the graph will be 2048.
The X axis can be either absolute (real date/time) or relative (in buffer duration). It can be changed during acquisition. The default type is relative; it may be changed through the user’s preferences.
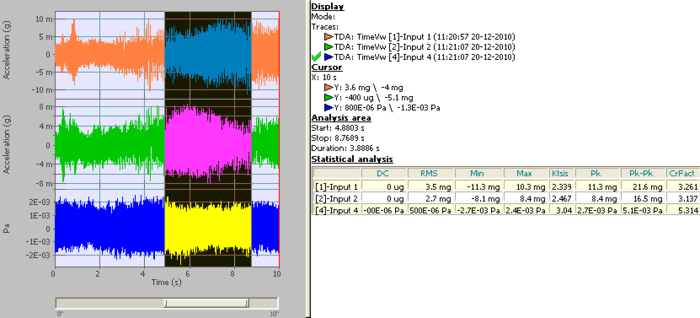
In addition to the signal overview, the Time view provides statistic extraction of a part of the displayed signal. The extraction takes into account the signal defined in the selected area (reverse video). The results of this extraction are available in the info trace. The following levels are computed in the selected area:
- DC
- RMS (root min square)
- Min. (minimum) lowest amplitude
- Max (maximum) highest amplitude
- Ktsis (kurtosis) 3rd order moment
- Pk (peak) absolute value of the largest amplitude
- Pk-Pk (peak-peak) largest excursion
- CrFact (crest factor) Pk-Pk/RMS
- Kurtosis
Settings
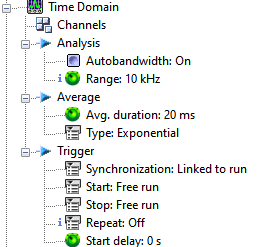
- Synchronization: Controls the plug-in synchronization with the general analyzer status:
- Linked to run: The plug-in is controlled by the general Run / Pause / Stop controls. It operates synchronously with the Other plug-in (except the Monitor)
- Free run: The plug-in runs continuously independently from the general Run/Pause/Stop. Note: The start/stop trigger continue to control the plug-in processing
- Range: Setup the analysis range for the plug-in. This value is maximized by the front-end sampling frequency divided by 2.56.
Note: Each plug-in feature an independent bandwidth. - Average: Setup Average type for the statistic extraction. It can be exponential with a sliding decay or linear. Multiple linear averaging are obtained by setting the TDA/Trigger/Repeat to : End of averaging
- Average duration: Setup the average duration. In Exponential mode it specifies the non decayed part of the signal. In linear mode, it specifies the complete duration. In Linear repeated mode, it specifies the short duration.
Channel
Contains the settings related to the source input.
- Source: input source to be analyzed. It may come from the input Front-end or from the Player in the post analysis mode (see the post analysis chapter). In the post analysis mode, the tracks with a signal bandwidth lower than the range of the TDA cannot be plugged.
- Input filter: filter to be used for filtering the source before analysis. The Filters that are not compatible with the TDA range cannot be selected (see the Filter builder chapter).
- Duration: duration of the viewed signal. Minimum value depends on TDA frequency range analysis (360ms for 20kHz bandwidth analysis) whereas maximal value can be up to 100000s. The duration of the viewed signal is independent for each channel.
This setting affects only the Time View, not the scalar results.
- Time Base: this read-only setting is the duration of one displayed point in the time view. Time view display is set to a fixed size of 2048 points. Time base is evaluated according to the formula:
| Time Base = Duration / 2048 | ||
| For a duration of 10 s , Time Base corresponds to 4.882812 m. | ||
Analysis
- Autobandwidth: manages the analysis and recording bandwidths automatically. The Inputs selection window allows the use of 2 different sampling rates for the dynamic inputs. It gathers inputs with the same physical quantity into groups, maintaining the same sampling into each group. When inputs are associated with the analysis plug-in, it adjusts its analysis bandwidth to match the inputs ones. Mixing input bandwidths in one analysis plug-in lead to set its bandwidth to the lowest one. Autobandwidth is set by default . When it is enabled in the plug-in, these settings "switch to informative status"
- Range: the TDA plug-in frequency range. The analyzer sampling frequency divided by 2.56 limits this range, and the minimum is obtained by dividing this limit by 50000. For example, if the analyzer sampling frequency is 51,2kS/s, then the max range is 20 kHz and the min is 400mHz. In post analysis mode, the Max Bandwidth setting from the Player plug-in provides the analyzer sampling frequency by multiplying the value by 2.56 (ex: if max bandwidth = 20 kHz then the analyzer sampling frequency is 51.2kS/s), otherwise, the analyzer sampling frequency is provided by the input sampling setting from the Front end plug-in input setting sub-module.
Average
- Average: Setup Average type for the statistic extraction. It can be exponential with a sliding decay or linear. Multiple linear averaging are obtained by setting the TDA/Trigger/Repeat to : End of averaging
- Type: The method of averaging the signal. There are four different averaging modes: Linear, Exponential, Peak hold, and Referenced Peak hold.
| Type | Description |
| Linear | Linear averaging of results is carried out on the value of the Duration from the same sub-module. The TDA plug-in automatically stops when the duration is reached. |
| Exponential | In this mode of computation, averaging is continuously updated each 256 samples. All scalar results DC, RMS, Min, Max, Peak, Peak-Peak, Kurtosis, are reset with a periodicity equal to the duration of results is carried out on the value of the Duration from the same sub-module. The TDA plug-in automatically stops when the duration is reached. |
event among the list of defined events. By default only the Free run and Manual events are available. The user can define another event in the "Event Definition" shared resources and then use this event for the "Stop" condition.
- Duration: The duration of the signal used to compute the scalar results available as result. Results are delivered each 256 samples.:This setting affects only the Time View, not the scalar results.
Trigger
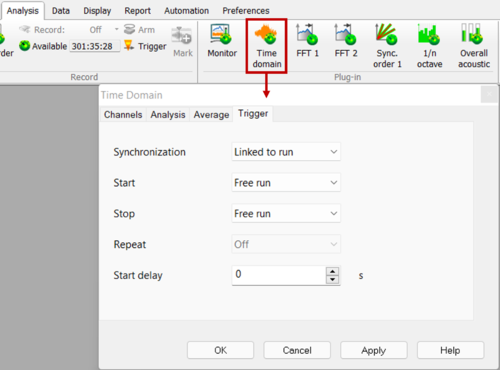
- Synchronization: Controls the plug-in synchronization with the general analyzer status:
- Linked to run: The plug-in is controlled by the general Run / Pause / Stop controls. It operates synchronously with the Other plug-in (except the Monitor)
- Free run: The plug-in runs continuously independently from the general Run/Pause/Stop. Note: The start/stop trigger continue to control the plug-in processing. In Free Run mode, the average is forced to Exponential.
- Start: defines the event to start the analysis. The user can choose any event among the list of defined events. By default only the Free run and Manual events are available. The user can define another event in the "Event Definition" shared resources and then use this event for the "Start" condition.
- Stop: defines the event to stop the analysis. The user can choose any event among the list of defined events. By default only the Free run and Manual events are available. The user can define another event in the "Event Definition" shared resources and then use this event for the "Stop" condition.
- Repeat: this setting is used to select a condition for the TDA plug-in to be restarted. If an event is selected as a Start event, the option "New start" is available, and when this mode is selected each Start event restarts the plug-in. The "End of averaging" mode is available when the value of the TDA /Analysis/Type is equal to "Linear" mode. This restarts the plug-in when the averaging is finished. For linear average when it is set to "End of averaging", the "Avg duration" gives the periodicity of the average restart. By default the Repeat mode is set to "Off".
- Start Delay: time delay applied to the time the start event occurs. The Start Delay could be a negative values to act as a pre-trigger. At default setting of 20kHz analysis, the minimum value for Start Delay is -635ms. The maximum value is 360000s.
TDA status
All statuses are available for the control panel. Statuses are refreshed all the time at roughly 10 Hz.
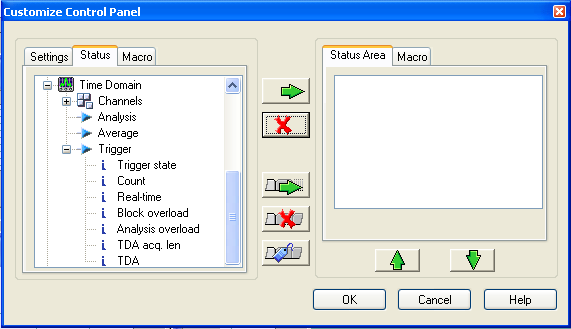
The current plug-in status is synthesized in a special progress-bar. This progress bar is automatically displayed in the bottom area when the plug-in is active (i.e. as soon as at least 1 input is connected to the TDA plug-in). This status is called ’TDA’ and it is available in the status ASB tree (see customize control panel).
This status displays the status and current time, the plug-in state and the real-time status.
- Run: the TDA plug-in is computing data and average it
- Stop: The TDA plug-in is stopped.
- Trig: The TDA plug-in is waiting for next block; i.e. next trigger event (block triggering) or first start event (triggering)
- Pause: The TDA plug-in averaging is paused
Notes: in exponential averaging mode the average counts stops increasing as soon as the set value is reached.
The way the status bar is displayed, depends on the type of averaging selected:
- ’Linear’: the progress bar is filled from left to right.
- ’Exponential’: the progress bar is filled from right to left with a flashing until the end of the acquisition.
The color of the background bar and of the text depends on real-time status:
- Green background and white or black text: acquisition in real-time.
- Red background and white or black text: the current acquisition is not real-time (current block is not analyzed).
- Green background and red text: the current acquisition is real-time, but since start not all the blocks were analyzed.
This status displays the progression of the measurement in duration
Trigger State
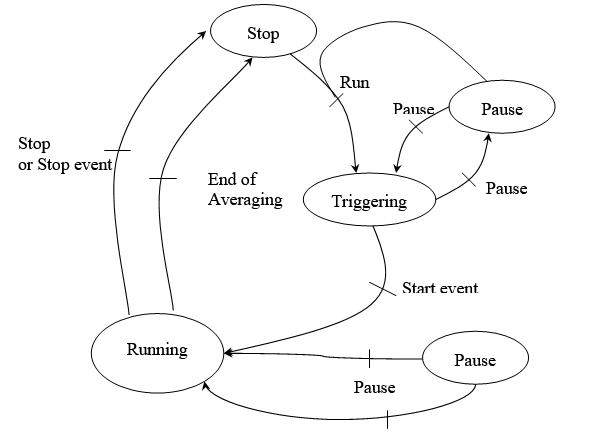
The following scheme describes the basic statuses evolution of the TDA measurement:
By default the trigger state is on ’Stop’ and waiting for a ’Run’ (start or trigger). Then the state become ’Triggering’ and is waiting for a start event, the states become ’Running’.
The TDA plug-in can run either in the standard plug-in synchronization or totally free run (see Synchronization setting in the TDA settings). While running in the free run mode, the TDA remain in the running mode (not displayed in the status) until the synchronization is changed.
Count
This status displays the averaging duration processed. This status is expressed in seconds.
Real-time
This status displays if the averaging is in real-time or not (i.e. the current block is analyzed or not). If the corresponding signal were not available at this time, the acquisition is not real-time. That means that the treatment is longer than the acquisition.
There are 3 values for this state:
- ’OK’: The acquisition is real-time (all block have been processed and averaged)
- ’No’: Acquisition was not real-time (some previous blocks are missing in the average).
- ’-’: The acquisition is currently not real-time (current block is not analyzed an averaged).
Block overload
This status corresponds to the instantaneous overload indication for TDA plug-in current block, for instance amplitude overload occurred in the current analyzed block.
Analysis overload
This status corresponds to overload indication over the measurement period. It means that during the whole measurement period there was (or not) an overload. It memorizes block overloaded.
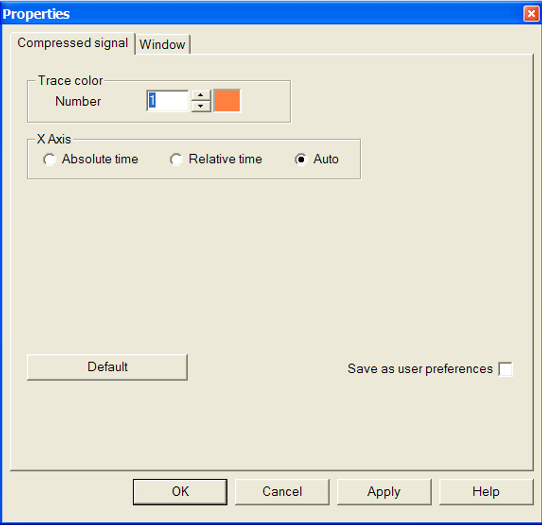
Properties
- Trace color
- Number: selects the trace number for color modification.
- Color box: click on this box to modify the color of the selected trace.
- X Axis
- Absolute time: displays the time from windows format.
- Relative time: displays the duration of the record. The beginning of the record is set to 0.
- Auto: selects absolute or relative time depending on the duration of the record. For records smaller than 2s, the relative time is displayed, for others, the absolute time is chosen.

