Difference between revisions of "NVGate GoToResult"
| (10 intermediate revisions by the same user not shown) | |||
| Line 1: | Line 1: | ||
[[category:WikiOros]] | |||
Available from both the bottom bar :[[Image:V11_release_08.png|framed|none]] | Available from both the bottom bar :[[Image:V11_release_08.png|framed|none]] | ||
and ''Home\GoTOResult'': | and ''Home\GoTOResult'': | ||
| Line 18: | Line 18: | ||
======Usage====== | ======Usage====== | ||
The ''Inputs selection'' window '''allows access to the other items of the NVGate''' '''interface''' (ex: ''check ICP, Autorange'', change sampling frequencies, graphs…) while it remains open. | The ''Inputs selection'' window '''allows access to the other items of the NVGate''' '''interface''' (ex: ''check ICP, Autorange'', change sampling frequencies, graphs…) while it remains open. | ||
The actions in this window apply immediately to the analysis, there is no possible cancel. In the same way actions in other parts of NVGate are immediately reflected in this window. | The actions in this window apply immediately to the analysis, there is no possible cancel. In the same way actions in other parts of NVGate are immediately reflected in this window. | ||
| Line 76: | Line 74: | ||
Unchecking this box just set the recorder to off. The inputs remain set in the recorder. This is helpful to '''temporarily pause the inputs recording'''; especially on setup fine tuning. | Unchecking this box just set the recorder to off. The inputs remain set in the recorder. This is helpful to '''temporarily pause the inputs recording'''; especially on setup fine tuning. | ||
A button "view recording" is available on step 2 to '''monitor temporarily or continuously the signal:'''. | |||
A button is available on | |||
======Access to all====== | ======Access to all====== | ||
| Line 130: | Line 126: | ||
* <u>Add a new window</u> in the current layout with the selected results by clicking the button | * <u>Add a new window</u> in the current layout with the selected results by clicking the button | ||
* Drag & Drop the button to an existing window of the current layout to <u>add the selected results in this window</u>. | * Drag & Drop the button to an existing window of the current layout to <u>add the selected results in this window</u>. | ||
======Add Layout====== | |||
[[File:Add__layout.PNG|40px]] Add Layout: Creates a new layout. A dialog box used to name the new layout is displayed by clicking on the button. A new tab is created and selected, corresponding to the new layout. | |||
Tips : [Ctrl+shift+space]: to change the different layouts. | |||
======View Recording====== | |||
[[File:viwe recording.PNG|50px]]view recording: will open the signal monitoring window on top of the current layout. In the case of this window is already open in another layout, it swaps to this layout. | |||
======References====== | ======References====== | ||
| Line 162: | Line 167: | ||
The bottom half of the window allows adjusting the selected plug-in parameters and triggering. | The bottom half of the window allows adjusting the selected plug-in parameters and triggering. | ||
[[ | [[File:GTR2022.png|400px]] | ||
1. This button opens the active plug-in properties. NB: it is also possible to access it from the ribbon while the window is open. Helpful with the directly available main settings. | 1. This button opens the active plug-in properties. NB: it is also possible to access it from the ribbon while the window is open. Helpful with the directly available main settings. | ||
| Line 170: | Line 175: | ||
3. Activate the plug-in tach with this combo box. The tachometer properties will be proposed just after selecting the tach. The corresponding input (dynamic, or ext. synch) is automatically activated. <br>NB: The selected tachometer is associated with the plug-in. For profile and waterfall results, the corresponding tachometer is showed as: XXX tach (ex. FFT1 tach, or SOA2 tach) | 3. Activate the plug-in tach with this combo box. The tachometer properties will be proposed just after selecting the tach. The corresponding input (dynamic, or ext. synch) is automatically activated. <br>NB: The selected tachometer is associated with the plug-in. For profile and waterfall results, the corresponding tachometer is showed as: XXX tach (ex. FFT1 tach, or SOA2 tach) | ||
4. | 4. Click on the engine tachometer icon will automatically change the waterfall trigger on mode : '''"delta RPM or periodic"'''. This will make the setup of NVGate much more easier for a rotating or run up application. | ||
This button also create the following events: | |||
* Create a Delta RPM event, source = the one activated in the "Tach.". Delta velocity : 10 RPM. | |||
* Create a Periodic event (0.5 sec) | |||
* Create a Combined event 1. mode: "Delta RPM OR Periodic 1" | |||
* Set waterfall Trigger to Combined event | |||
* Create of an RPM event (source = the one activated in the tach field) | |||
(This button is only available on profile or waterfall tab) | |||
5. Open the waterfall triggering dialog. This dialog allows selecting the trigger of by the waterfall plug-in (only available on profile and waterfall tab). | |||
=====Step 3 Results overview===== | =====Step 3 Results overview===== | ||
Latest revision as of 10:00, 26 November 2024
Available from both the bottom bar :
and Home\GoTOResult:
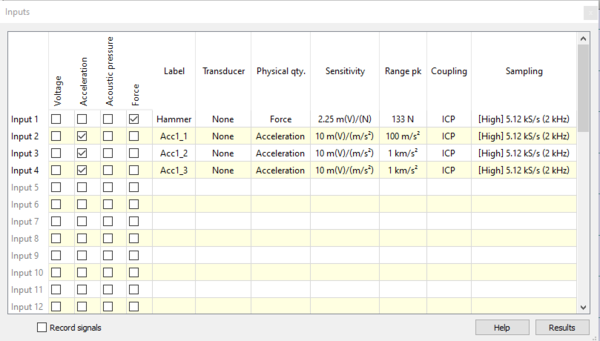
This window allows selecting the inputs to be used and setups their acquisition.
The 2 first buttons control the visibility of the corresponding windows Inputs selection and Show results. Click once to show the window, click again to hide it. The 3rd button only opens the Results overview.
These 3 buttons show the windows described below.
Step 1: Inputs selection
Usage
The Inputs selection window allows access to the other items of the NVGate interface (ex: check ICP, Autorange, change sampling frequencies, graphs…) while it remains open.
The actions in this window apply immediately to the analysis, there is no possible cancel. In the same way actions in other parts of NVGate are immediately reflected in this window.
This window manages dynamic inputs only. For using parametric, CAN or ext. synch inputs, one should use the acquisition tab of the ribbon.
Operations
The Inputs selection window allows activating and setting-up the dynamic inputs in a fast and smart way. Inputs are activated and set to a physical quantity when the corresponding check box is clicked.
Selection
This table allows selecting one or multiple cells in an Excel like mode, using mouse drag, keyboard arrows and SHIFT/CTRL keys. After editing, the focus is automatically set to the next cell for continuous operation with the keyboard:
| Exit key | Return | Tab | Left arrow | Right arrow | Up arrow | Down arrow |
| Next cell | Down | Right | Left | Right | Up | Down |
Edition
Editing a cell or a group of cells is direct, no need to double click, simply enter the values or initials for combo boxes. Hit the <Space> key to open the combo with the current selection. This allows using the keyboard only while setting cells in a column or a line.
Add physical quantities
The 3 basic physical quantities (Voltage, Acceleration and Acoustic pressure) used in noise and vibration are proposed as default. Changing one input physical quantity will add a new column with this physical quantity.
In addition to the basics and active physical quantity, the columns also show the physical quantities of deactivated inputs. This is useful to add default physical quantities to your models.
Transducers
The list of possible transducers is adjusted to the input physical quantity. Ex: if an input is set to acoustic pressure, only a microphones’ list is proposed.
Sampling & groups
The sampling setting is new. It defines the recording sampling and the analysis bandwidth for each group of inputs. The groups correspond to the inputs physical quantities. See the Autobandwidth chapter for more details
There are 2 samplings, High and Low. Each sampling can be adjusted from the table with Right click -> Change -> Select new sampling.
Changing the sampling of one input will apply to all input in the same group. For applying different samplings to inputs with same physical quantity, use the ASB.
Sampling settings are also available from the ribbon Measurement\Front-end\High Samp. and Low Samp. and from the Front-end Module in the Analysis Setting Browser.
Record signals
Check this box to ensure the recording of all active inputs. This includes the DC inputs (parametric), the Ext Sync. and the CAN ones.
Unchecking this box just set the recorder to off. The inputs remain set in the recorder. This is helpful to temporarily pause the inputs recording; especially on setup fine tuning.
A button "view recording" is available on step 2 to monitor temporarily or continuously the signal:.
Access to all
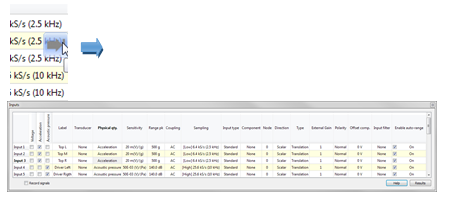
By default, the window shows only the basic settings. In order to get the full columns, flyover the right side of the table and click on the grayed arrow.
Same with the left arrow to return to the basic view.
Post-analysis
Inputs selection window works on both on-line and post-analysis modes.
Step 2 Show results
Call
Directly following the Inputs Selection window, this window allows displaying and saving results from activated inputs.
Hide the window by clicking on its control button closing the window (up-right red cross) or by clicking on its corresponding button in the NVGate bottom bar.
Usage
The Show results window allows access to the other items of the NVGate interface (Add/Change layout, Setup tachometer…) while it remains open.
The actions in this window apply immediately to the analysis, there is no cancel possible from this window. In the same way, actions in other parts of NVGate are immediately reflected in this window.
This window manages to connect and display result from FFTx, SOAx, OCT plug-ins only. (For results from TDA and OVA, one should use the ![]() Connect Inputs button followed by the |
Connect Inputs button followed by the |![]() Add/remove windows .
Add/remove windows .
Show results
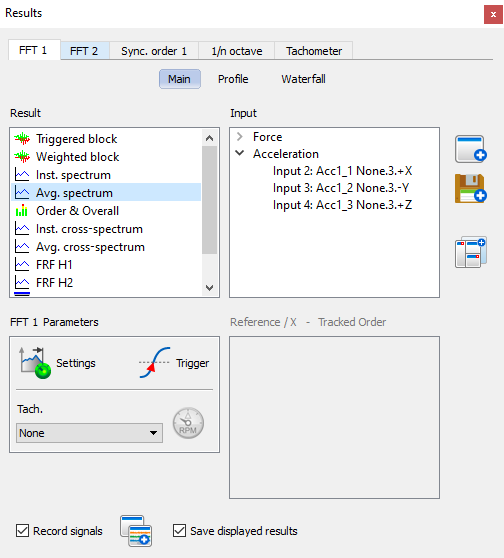
The Show results window allows displaying and saving results without connecting inputs or tracks to the plug-in analyzers in advance.
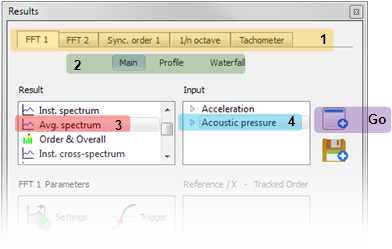
Results to be displayed are selected as follows:
1. Select the plug-in which calculates the results,
2. select the results’ familly between:
- Main is for results imediatelly provided by the analysis like the trigger blocks, RPM, spectra, FRFs, …
- Profile is for scalar profiles like order tracking, acoustic level, RPM profiles, …
- Waterfall is for 3D results.
3. Select the result type,
4. select the Inputs/Tracks to be displayed. This list gathers the sources in groups according to their physical quantities. One can develop the group for partial selection.
Go. Use the Show button to display your selection. This button operates in 2 ways:
- Add a new window in the current layout with the selected results by clicking the button
- Drag & Drop the button to an existing window of the current layout to add the selected results in this window.
Add Layout
Add Layout: Creates a new layout. A dialog box used to name the new layout is displayed by clicking on the button. A new tab is created and selected, corresponding to the new layout.
Tips : [Ctrl+shift+space]: to change the different layouts.
View Recording
view recording: will open the signal monitoring window on top of the current layout. In the case of this window is already open in another layout, it swaps to this layout.
References
Cross functions (FRFs, ORFs, Coherence, etc..) are selected through the bottom right area. The references are displayed as the inputs/tracks using the physical quantity group. There is no need to predefine the cross function from the Plug-in settings.
Orders and overall
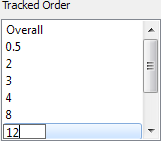
For order tracking, the Show results window features a fast and simple order selection mode. While selecting order-based result, one can enter the chosen orders in the bottom right area of the window.
Values are entered directly using the keyboard; The Enter and up/down keys will navigate to next or previous lines in the list.
If the plug-in channels show different orders to track for one line, "Mixed" will be displayed.
Save results
Results to be saved (i.e. added to the save selection list) are selected as for showing it.
There are 3 ways to save the results:
- Manually by using the save button. This will add the selected results to the save selection.
Automatically and continuously, by checking the Save displayed results check box at the bottom of the window. This will continuously add the displayed results to the save selection. Results remain in the save selection list, even if they are removed from the layout.
Automatically once by using Measurement\Save\Add All Results button from the ribbon. This button acts like the save all display result but only at once.
- This button is grayed when all displayed results are already in the save selection
- When the Save displayed results is active, this button shows
Parameters
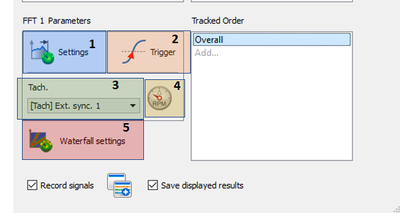
The bottom half of the window allows adjusting the selected plug-in parameters and triggering.
1. This button opens the active plug-in properties. NB: it is also possible to access it from the ribbon while the window is open. Helpful with the directly available main settings.
2. Click here to open the Events connection window, where one can associate event with plug-ins’ Start, stop or trigger.
3. Activate the plug-in tach with this combo box. The tachometer properties will be proposed just after selecting the tach. The corresponding input (dynamic, or ext. synch) is automatically activated.
NB: The selected tachometer is associated with the plug-in. For profile and waterfall results, the corresponding tachometer is showed as: XXX tach (ex. FFT1 tach, or SOA2 tach)
4. Click on the engine tachometer icon will automatically change the waterfall trigger on mode : "delta RPM or periodic". This will make the setup of NVGate much more easier for a rotating or run up application.
This button also create the following events:
- Create a Delta RPM event, source = the one activated in the "Tach.". Delta velocity : 10 RPM.
- Create a Periodic event (0.5 sec)
- Create a Combined event 1. mode: "Delta RPM OR Periodic 1"
- Set waterfall Trigger to Combined event
- Create of an RPM event (source = the one activated in the tach field)
(This button is only available on profile or waterfall tab)
5. Open the waterfall triggering dialog. This dialog allows selecting the trigger of by the waterfall plug-in (only available on profile and waterfall tab).
Step 3 Results overview
Call
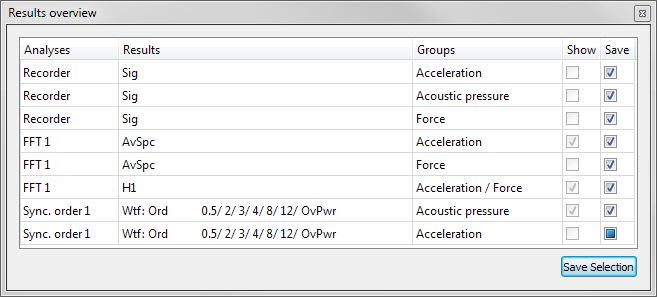
Available from the bottom bar. This window shows a synthetic table of the displayed and saved results. Close the window by clicking on its control button closing the window (up-right red cross).
Usage
The table summarizes all the displayed and saved result (i.e. present in the Save Selection list), by:
- Plug-ins
- Type of results
- Groups (i.e. Physical quantity)
The 2 columns at the right, indicate what is done with each set of results. Show for the displayed results and Save for the to-be-saved results.
The check boxes have 3 possible status:
![]() Checked, means all the inputs with these type and physical quantity, calculated by the plug-in are saved and/or displayed.
Checked, means all the inputs with these type and physical quantity, calculated by the plug-in are saved and/or displayed.
![]() Unchecked, means none of the inputs with these type and physical quantity, calculated by the plug-in are saved and/or displayed.
Unchecked, means none of the inputs with these type and physical quantity, calculated by the plug-in are saved and/or displayed.
![]() Partial, means only a part of the inputs with these type and physical quantity, calculated by the plug-in are saved and/or displayed.
One can check and uncheck the Save column boxes. Partial status boxes change to checked or unchecked only.
Partial, means only a part of the inputs with these type and physical quantity, calculated by the plug-in are saved and/or displayed.
One can check and uncheck the Save column boxes. Partial status boxes change to checked or unchecked only.
It is possible to check the results one by one with the Save Selection window by clicking on the corresponding button at the bottom-right of the window


