Difference between revisions of "User note: FFT averaging"
| (6 intermediate revisions by 2 users not shown) | |||
| Line 1: | Line 1: | ||
[[category:WikiOros]] | |||
NVGate provides many settings for averaging | NVGate provides many settings for averaging results. This document aims to describe these functions and parameters for averaging data results. This document focuses on averaging available at FFT modules. These are quite similar settings for SOA modules. | ||
===Why averaging?=== | ===Why averaging?=== | ||
| Line 6: | Line 6: | ||
There are many reasons that lead to average measurement to | There are many reasons that lead to average measurement to provide accurate results. | ||
FFT analysis is performed on an extract of time signal which is called "trigger block" | FFT analysis is performed on an extract of time signal which is called "trigger block" | ||
Averaging | Averaging enables compliance with the basics FFT hypothesis. | ||
* Get a analysis on a stationary signal data | * Get a analysis on a stationary signal data. | ||
* Reduce input noise, averaging increase the signal/noise ratio | * Reduce input noise, averaging increase the signal/noise ratio. | ||
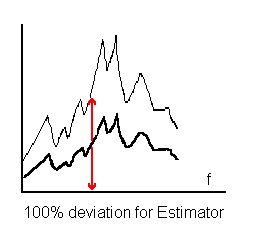
* By definition FFT estimator provides 100% standard deviation | * By definition FFT estimator provides 100% standard deviation. | ||
[[Image:Averaging_01.png|framed|none]] | [[Image:Averaging_01.png|framed|none]] | ||
| Line 43: | Line 43: | ||
It results complex data that can be displayed in Magnitude and Phase (or Real Imaginary). | It results complex data that can be displayed in Magnitude and Phase (or Real Imaginary). | ||
Time domain averaging makes sense for synchronous time block, it must be use with a trigger for block synchronization, | Time domain averaging makes sense for synchronous time block, it must be use with a trigger for block synchronization, otherwise the average will not make sense. | ||
This average is useful to avoid getting | This average is useful to avoid getting results from external sources. For example, in a noisy factory, setting a trigger linked to a specific machine will prevent from receiving noise from other machine. | ||
There is an additional average type named '''Frequency Synchronous '''or '''FDSA.''' This is based on Frequency domain average but it | There is an additional average type named '''Frequency Synchronous '''or '''FDSA.''' This is based on Frequency domain average but it acts as Time domain average. It uses one frequency line (specifies by user) as a phase reference, each FFT is recomputed so that the phase of this reference frequency is set to "0". | ||
This allows to focus on a specific phenomena even if there is no trigger available to perform Time domain analysis. | This allows to focus on a specific phenomena even if there is no trigger available to perform Time domain analysis. | ||
| Line 57: | Line 57: | ||
====linear average==== | ====linear average==== | ||
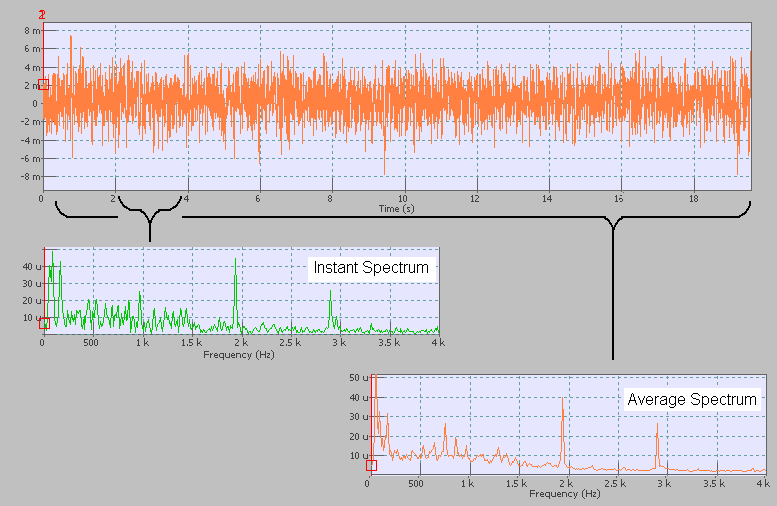
For the '''linear average''', each "n" spectrum | For the '''linear average''', each "n" spectrum gets the same weight for the averaging. Its usually set for long time averaging result. The result is according the global level of energy for each narrow band during the duration of measurement. | ||
[[Image:Averaging_05.png|framed|none]] | [[Image:Averaging_05.png|framed|none]] | ||
| Line 63: | Line 63: | ||
====Exponential Average==== | ====Exponential Average==== | ||
The '''Exponential Average''' is computed with a linear average for the last "n" spectrums whereas older spectrum | The '''Exponential Average''' is computed with a linear average for the last "n" spectrums whereas older spectrum have a lower weight. Exponential averaging provides an infinite sliding result. This is commonly used with a low value of average. As it keeps the student variation in memory for a short time, this is a good setting for monitoring or tracking non-temporary phenomena. | ||
[[Image:Averaging_06.png|framed|none]] | [[Image:Averaging_06.png|framed|none]] | ||
| Line 69: | Line 69: | ||
====Peak Hold average==== | ====Peak Hold average==== | ||
The '''Peak Hold average''' is not | The '''Peak Hold average''' is not a mathematical average. The peak hold provides a result that corresponds, at each band, for the maximal value of each the "n" spectrum. It is useful to get the maximal values as a worst case of measurement: | ||
[[Image:Averaging_07.png|framed|none]] | [[Image:Averaging_07.png|framed|none]] | ||
===Ref. Peak Hold average==== | ====Ref. Peak Hold average==== | ||
In the same way the '''Ref. Peak Hold average''' is | In the same way the '''Ref. Peak Hold average''' is not a mathematical average. | ||
It is basically same feature as the Peak Hold average. The main difference that it collects and holds the data of the spectrum according to a new peak on the reference channel. | It is basically the same feature as the Peak Hold average. The main difference is that it collects and holds the data of the spectrum according to a new peak on the reference channel. | ||
This technique is used for some modal | This technique is used for some modal tests with a shaker excitation to reject non-linear phenomena. In this case, the Ref. Peak Hold average is used as a tracking filter linked with excitation frequency.<br> | ||
[[ | We advice to read [[NVGate_FFT#Average|ref peak hold averaging]] on FFT page for more info. | ||
Latest revision as of 10:10, 26 November 2024
NVGate provides many settings for averaging results. This document aims to describe these functions and parameters for averaging data results. This document focuses on averaging available at FFT modules. These are quite similar settings for SOA modules.
Why averaging?
There are many reasons that lead to average measurement to provide accurate results.
FFT analysis is performed on an extract of time signal which is called "trigger block"
Averaging enables compliance with the basics FFT hypothesis.
- Get a analysis on a stationary signal data.
- Reduce input noise, averaging increase the signal/noise ratio.
- By definition FFT estimator provides 100% standard deviation.
Averaging parameters should be setup according analysis and tracked phenomena.
Averaging Domain
Averaging could be done in either Frequency or Time Domain.
Frequency Average
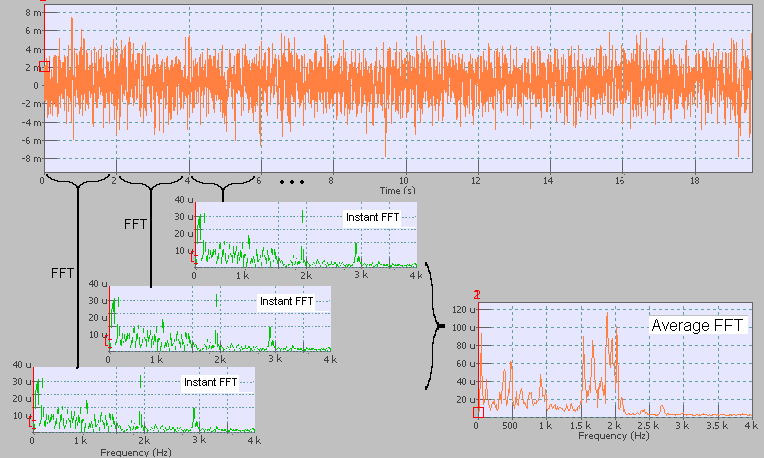
Each signal block generates an FFT, the average result is the average of the spectrum :
Data result is available for magnitude only. There is no information about the phase.
Time Domain
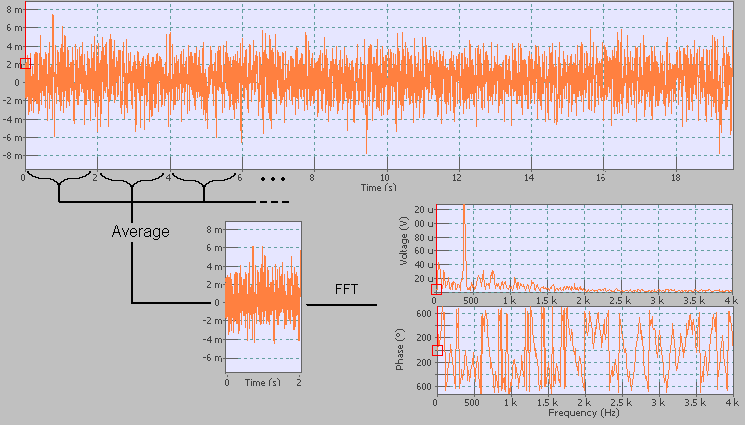
The average is performed in time domain, the FFT is computed on the average time signal data
It results complex data that can be displayed in Magnitude and Phase (or Real Imaginary).
Time domain averaging makes sense for synchronous time block, it must be use with a trigger for block synchronization, otherwise the average will not make sense.
This average is useful to avoid getting results from external sources. For example, in a noisy factory, setting a trigger linked to a specific machine will prevent from receiving noise from other machine.
There is an additional average type named Frequency Synchronous or FDSA. This is based on Frequency domain average but it acts as Time domain average. It uses one frequency line (specifies by user) as a phase reference, each FFT is recomputed so that the phase of this reference frequency is set to "0".
This allows to focus on a specific phenomena even if there is no trigger available to perform Time domain analysis.
Average Type
linear average
For the linear average, each "n" spectrum gets the same weight for the averaging. Its usually set for long time averaging result. The result is according the global level of energy for each narrow band during the duration of measurement.
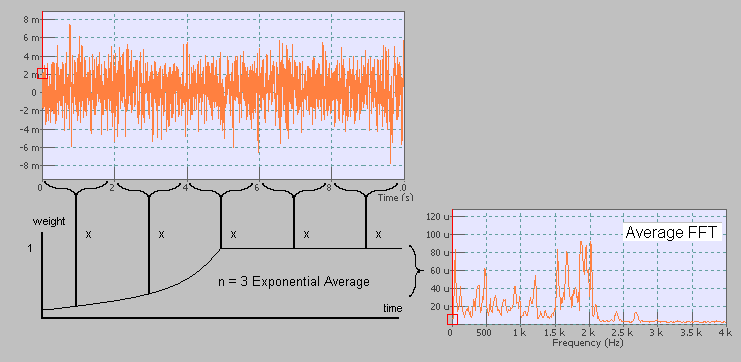
Exponential Average
The Exponential Average is computed with a linear average for the last "n" spectrums whereas older spectrum have a lower weight. Exponential averaging provides an infinite sliding result. This is commonly used with a low value of average. As it keeps the student variation in memory for a short time, this is a good setting for monitoring or tracking non-temporary phenomena.
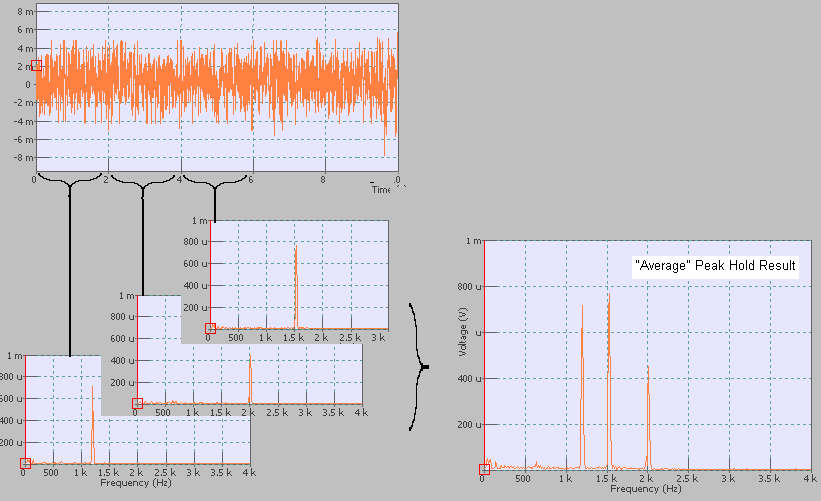
Peak Hold average
The Peak Hold average is not a mathematical average. The peak hold provides a result that corresponds, at each band, for the maximal value of each the "n" spectrum. It is useful to get the maximal values as a worst case of measurement:
Ref. Peak Hold average
In the same way the Ref. Peak Hold average is not a mathematical average.
It is basically the same feature as the Peak Hold average. The main difference is that it collects and holds the data of the spectrum according to a new peak on the reference channel.
This technique is used for some modal tests with a shaker excitation to reject non-linear phenomena. In this case, the Ref. Peak Hold average is used as a tracking filter linked with excitation frequency.
We advice to read ref peak hold averaging on FFT page for more info.
