Difference between revisions of "NVGate SOA and CBT techniques"
| (2 intermediate revisions by one other user not shown) | |||
| Line 1: | Line 1: | ||
This article | [[category:WikiOros]] | ||
This article compares Synchronous Order Analysis (SOA) method to the Constant Band Tracking (CBT) method. | |||
==Applications== | ==Applications== | ||
===Synchronous Order Analysis (SOA)=== | ===Synchronous Order Analysis (SOA)=== | ||
* Balancing / Phase default detection: | * Balancing / Phase default detection: Order 1 is being followed. Phase gives the unbalance<nowiki>'</nowiki>s position. | ||
* | * Coast Down using Bode Plot. Critical frequencies can be detected (Amplitude and Phase) | ||
[[Image:SOA_Vs_CBT_01.png|framed|none]] | [[Image:SOA_Vs_CBT_01.png|framed|none]] | ||
| Line 12: | Line 13: | ||
===Constant Band Tracking (CBT)=== | ===Constant Band Tracking (CBT)=== | ||
* Gear Boxes: shocks are numerous, spectra are noisy. Orders are not identified as clearly as they are in the case of large rotating machines such as turbines for instance. What is | * Gear Boxes: shocks are numerous, spectra are noisy. Orders are not identified as clearly as they are in the case of large rotating machines such as turbines for instance. What is interesting is their is more energy around one order rather than its amplitude. Computation is performed on a constant width frequency band. | ||
===Order Extraction from waterfall=== | ===Order Extraction from waterfall=== | ||
* For investigation. When people don<nowiki>'</nowiki>t know precisely what they are looking for (which order or frequency band to follow). The FFT waterfall can be used as a first step evaluation before using eventually SOA or CBT for in-depth analysis. | * For investigation. When people don<nowiki>'</nowiki>t know precisely what they are looking for (which order or frequency band to follow). The FFT waterfall can be used as a first step evaluation before using eventually SOA or CBT for in-depth analysis. | ||
<Youtube>https://www.youtube.com/watch?v=fdS2amoQ01I</Youtube> | |||
==Principles== | ==Principles== | ||
| Line 27: | Line 30: | ||
===CBT=== | ===CBT=== | ||
Constant Band Tracking consists | Constant Band Tracking consists of order analysis calculation based on energy summation from FFT data. Since the FFT module is used when tracking orders with the CBT feature, the trigger block duration is constant and no re-sampling is performed there. As a result, the number of rotations contained in one block depends on the rotating speed.<br> | ||
[[NVGate_CBT_principle_and_settings|See CBT page for more info.]] | [[NVGate_CBT_principle_and_settings|See CBT page for more info.]] | ||
| Line 36: | Line 39: | ||
* FFT trigger block for CBT has a constant time base defined by the frequency resolution. | * FFT trigger block for CBT has a constant time base defined by the frequency resolution. | ||
The example below shows, at two different rotating speeds of a swept sine | The example below shows, respectively the FFT trigger block and the SOA trigger blocks at two different rotating speeds of a swept sine. | ||
[[Image:SOA_Vs_CBT_02.png|framed|none]] | [[Image:SOA_Vs_CBT_02.png|framed|none]] | ||
| Line 48: | Line 51: | ||
This is different in the FFT module where the average time is the same for the whole range of speeds. | This is different in the FFT module where the average time is the same for the whole range of speeds. | ||
* The SOA averaging is done on the exact same number of revolutions at any time of the measurement whereas the CBT will average different number of revolutions at | * The SOA averaging is done on the exact same number of revolutions at any time of the measurement whereas the CBT will average different number of revolutions at a separate time of the test depending on the current rotating speed. | ||
==Swept sine setup emphasizing differences between SOA and CBT techniques== | ==Swept sine setup emphasizing differences between SOA and CBT techniques== | ||
| Line 93: | Line 96: | ||
The setup of the tachometer is very important for the accuracy of the phase results. Since different | The setup of the tachometer is very important for the accuracy of the phase results. Since different setups can lead to slightly different results, it is necessary to know what to pay attention to. The difference between AC and DC coupling will be here emphasized as one of those important settings. | ||
<u>Measurement setup</u>: one tachometer is connected to both Ext | <u>Measurement setup</u>: one tachometer is connected to both Ext Syncs 1 and 2 and both Inputs 1 and 2. The different signals are: | ||
* Train pulses with AC coupling (in black) | * Train pulses with AC coupling (in black) | ||
Latest revision as of 10:02, 26 November 2024
This article compares Synchronous Order Analysis (SOA) method to the Constant Band Tracking (CBT) method.
Applications
Synchronous Order Analysis (SOA)
- Balancing / Phase default detection: Order 1 is being followed. Phase gives the unbalance's position.
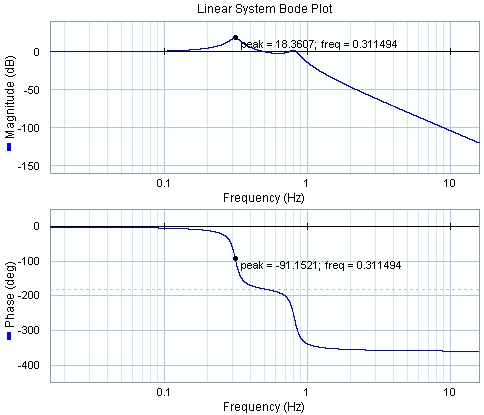
- Coast Down using Bode Plot. Critical frequencies can be detected (Amplitude and Phase)
- Orbit analysis / Angle analysis
- Torsional analysis / Crank Shaft Analysis
Constant Band Tracking (CBT)
- Gear Boxes: shocks are numerous, spectra are noisy. Orders are not identified as clearly as they are in the case of large rotating machines such as turbines for instance. What is interesting is their is more energy around one order rather than its amplitude. Computation is performed on a constant width frequency band.
Order Extraction from waterfall
- For investigation. When people don't know precisely what they are looking for (which order or frequency band to follow). The FFT waterfall can be used as a first step evaluation before using eventually SOA or CBT for in-depth analysis.
Principles
SOA
It is an order analysis method for which the sampling is synchronous with the rotating speed measured from the tachometer. Re-sampling filters are used on the raw signal to give constant angle sampling and a triggered blocks size independent from the rotating speed (the size corresponds to a fixed number of revolutions).
See SOA page for more info.
CBT
Constant Band Tracking consists of order analysis calculation based on energy summation from FFT data. Since the FFT module is used when tracking orders with the CBT feature, the trigger block duration is constant and no re-sampling is performed there. As a result, the number of rotations contained in one block depends on the rotating speed.
To sum-up:
- SOA trigger block is based on a constant revolution number defined by the order resolution and in sync with the tachometer pulses.
- FFT trigger block for CBT has a constant time base defined by the frequency resolution.
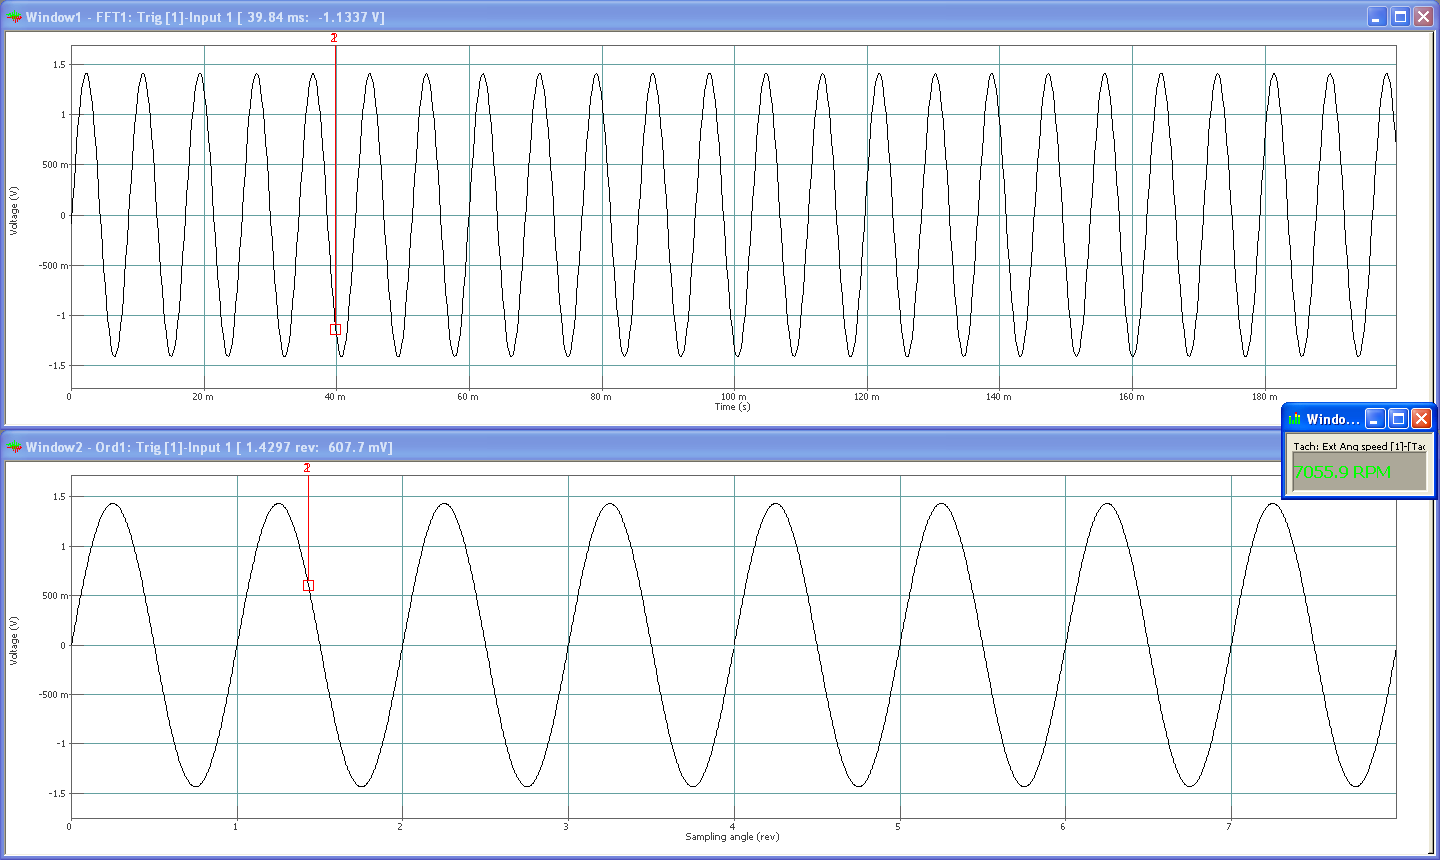
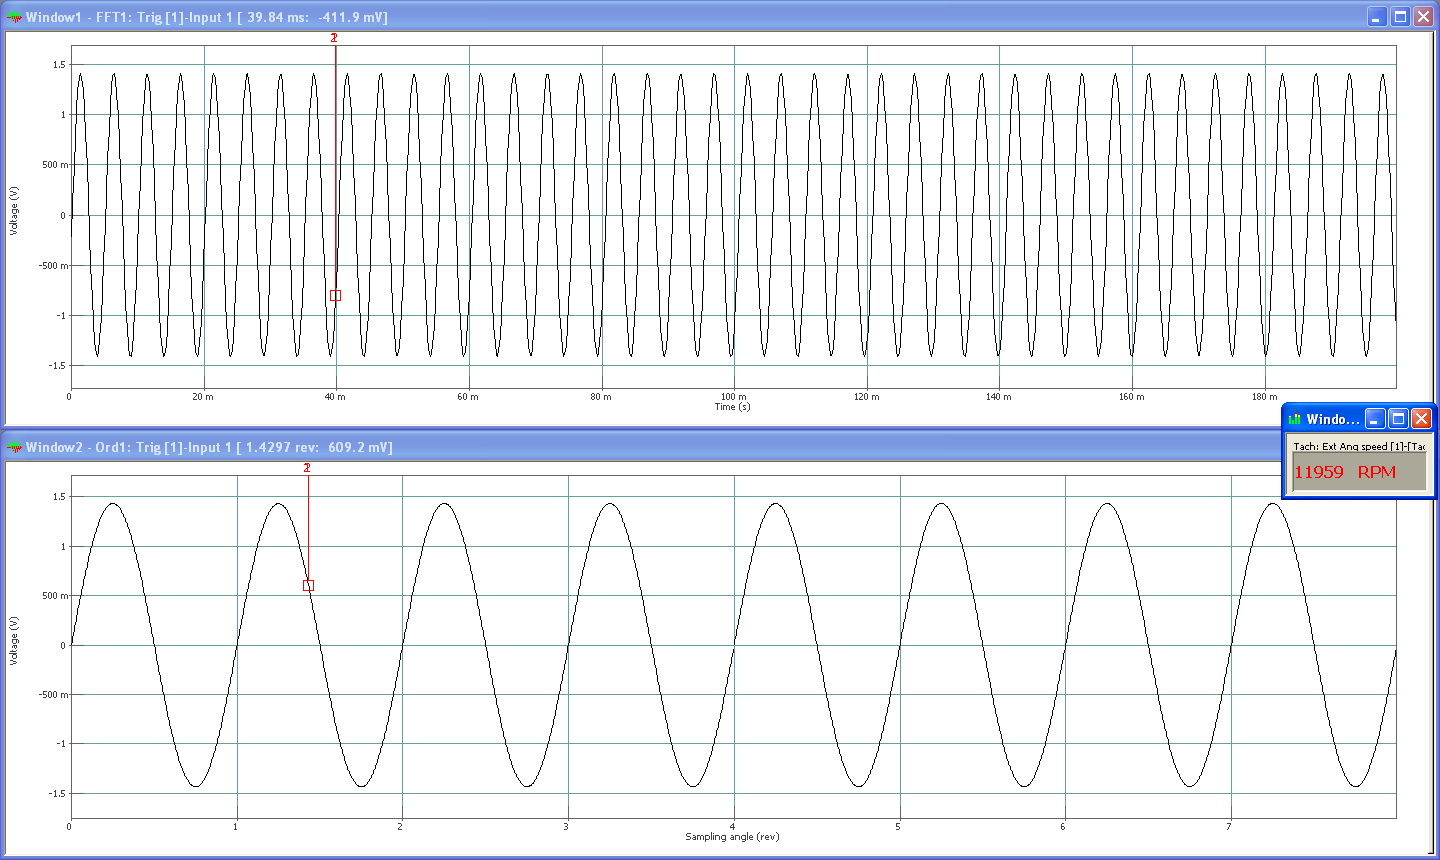
The example below shows, respectively the FFT trigger block and the SOA trigger blocks at two different rotating speeds of a swept sine.
- As the rotating speed increases, the FFT trigger block angular resolution decreases (more revolutions within one block) whereas the SOA angular resolution remains the same whatever the rotating speed is.
This has a consequence on the rate of results issued by the SOA plug-in. As a matter of fact, the average time duration is different when running at low speeds or high speeds: it takes longer as the speed decreases.
This is different in the FFT module where the average time is the same for the whole range of speeds.
- The SOA averaging is done on the exact same number of revolutions at any time of the measurement whereas the CBT will average different number of revolutions at a separate time of the test depending on the current rotating speed.
Swept sine setup emphasizing differences between SOA and CBT techniques
A 1V-RMS swept sine is set up to go from 100 to 200Hz (6000 to 12000RPM). Order 1 is tracked using CBT and SOA. Frequency resolution is 5Hz in the frequency domain (2kHz bandwidth + 401 lines).
CBT
To begin with, the minimum frequency band (15Hz) is selected for the tracking of order 1. The profile from 6500RPM to 11500RPM for order 1 is the following:
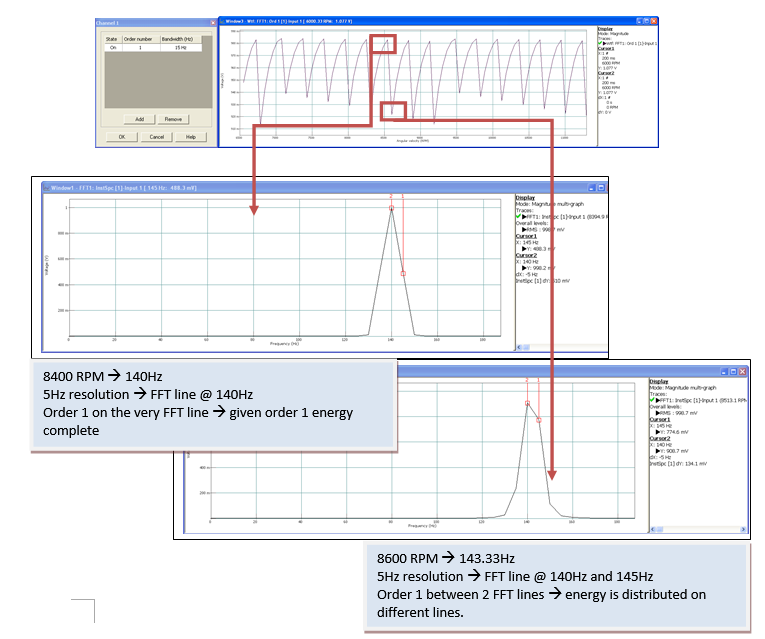
Globally, the order track goes from 6500RPM to 11500RPM which is the same as 108Hz to 191Hz. With the 5Hz resolution that has been used, the swept sine matches the FFT lines frequencies 17 times (110Hz, 115Hz,…) during the run-up. It corresponds to the 17 peaks that can be seen on the tracking of order 1. Indeed, at those specific times, energy of order 1 is distributed on frequency lines that are all taken into account by the energy summation performed on the FFT spectrum (15 Hz bandwidth) to get order 1 value.
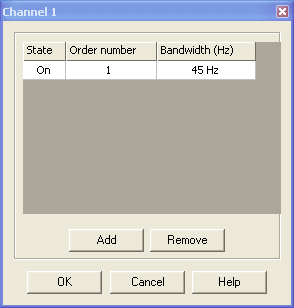
Now, the bandwidth is modified to 45Hz.
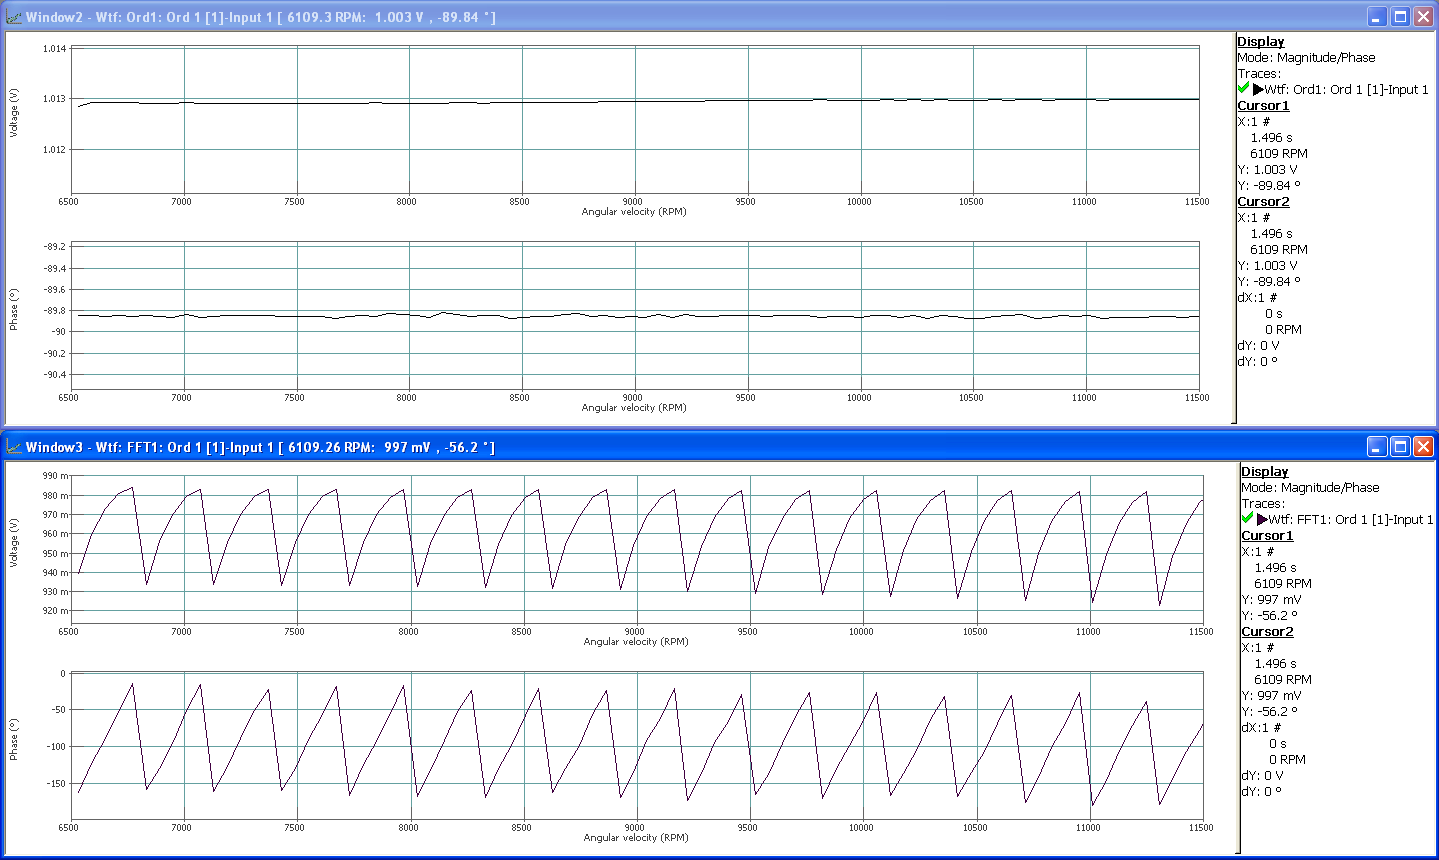
Order 1 profile is then almost steady and now very close to the 1V RMS at any moment.
Energy around order 1 in a 45Hz bandwidth is now included in the computed value. As the energy distributed on the lines of the FFT spectrum comes, in this case, only from order 1, we are therefore clearly getting closer to the 1V RMS by enlarging the bandwidth and combining those lines.
SOA
The order 1 tracked with the SOA plug-in gives a value which is consistent with RPM (see below). The tracked order is never "released" with such technique, no matter what the RPM value is. That is why the result is a straight line and no "steps" are seen in the profile.
Phase information
Below are the complete Bode plots (with phase information) of order 1 profiles we get respectively from the SOA plug-in and from the CBT.
On the CBT result, the phase information is spread, just like the amplitude, on different lines of the FFT. Unless order 1 perfectly matches a frequency line (phase is then -90°), the phase has no real meaning.
Here again, -90° is obtained 17 times during the run-up which matches the number of lines of the FFT in the frequency/RPM band of interest. The phase information is correct on those specific RPM speed only.
On the contrary, the phase of the SOA is always -90° because the order is "held" during the whole computation process.
Tachometer setup
The setup of the tachometer is very important for the accuracy of the phase results. Since different setups can lead to slightly different results, it is necessary to know what to pay attention to. The difference between AC and DC coupling will be here emphasized as one of those important settings.
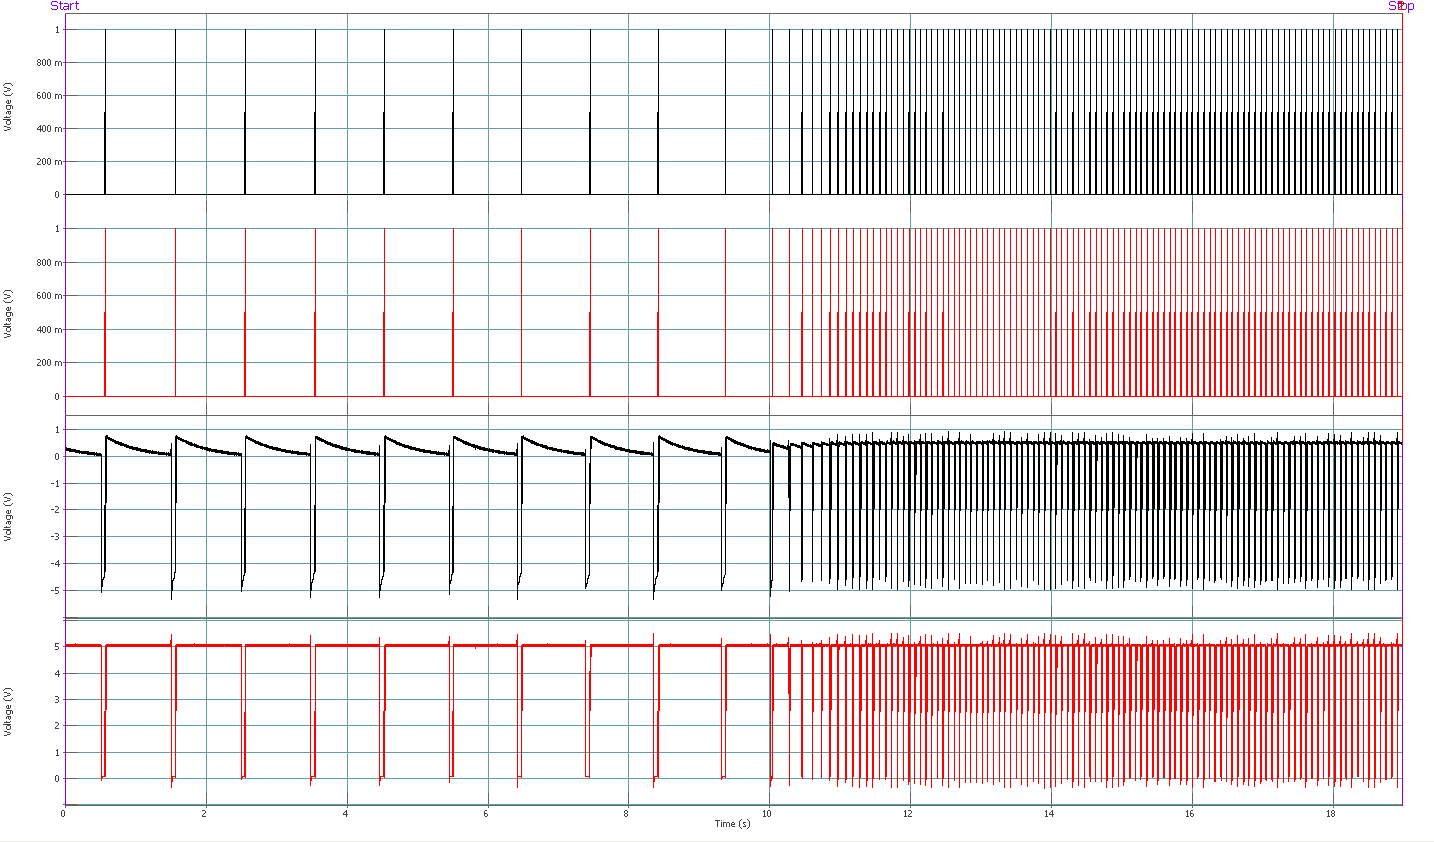
Measurement setup: one tachometer is connected to both Ext Syncs 1 and 2 and both Inputs 1 and 2. The different signals are:
- Train pulses with AC coupling (in black)
- Train pulses with DC coupling (in red)
- Analog signal with AC coupling (in black)
- Analog signal with DC coupling (in red)
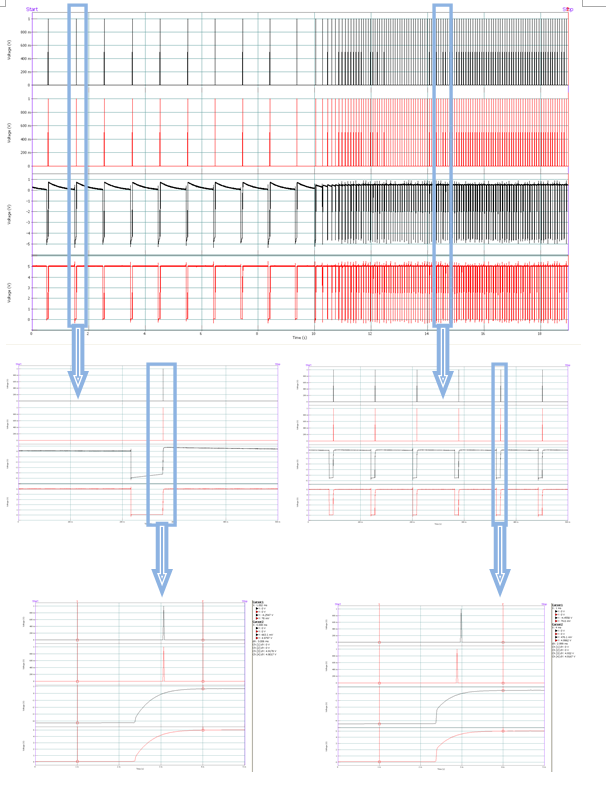
The measurement has been performed at 2 different speeds.
AC and DC coupled signals have been set up at low speed to deliver pulses at the exact same time (see below – bottom left).
When the speed is increased, the "AC pulses" and the "DC pulses" are not synchronous anymore. This is due to the AC coupling which tends to center the signal around zero. As a matter of fact, since the area below 0 is different when running at low speed and running at high speed (for the same time period), the signal is slightly moved up or down. The threshold crossing happens then at a slightly different time also. That explains the time difference that can be seen, on the bottom-right, between 2 pulses that should normally still happen at the very same time. This time difference induces a phase error.
| As a conclusion, using a DC coupling is usually recommended for tachometer set up. |
