Difference between revisions of "Modal Shortcuts"
(Created page with "<font color="#4F81BD">Modal Installation guide </font> ---- Thank you for purchasing Modal software. '''Modal '''is a dedicated tool for processing a comprehensive modal...") |
(No difference)
|
Revision as of 11:57, 16 July 2020
Modal
Installation guide
Thank you for purchasing Modal software.
Modal is a dedicated tool for processing a comprehensive modal analysis.
Some tools are available to create your modal project from the beginning to the end.
Start with the construction of the geometry and the acquisition of data in an optimized window.
After these first steps, continue naturally by displaying very quickly Operating Deflection Shapes. Finally, with the powerful algorithms proposed, modal parameters: frequencies, damping, mode shapes can be easily obtained from either modal data or operating data.
This "INSTALLATION GUIDE" will help you to install and run the Modal software.
For getting detailed information on the software, you can go and visit the Online Help embedded within the software. For beginning to use your new modal software, you can follow the instructions in the ’Getting Started’ document installed simultaneous to the software.
First checking
Required Configuration
Recommended PC configuration:
Equipment required for the installation:
Software CD containing Modal and the online help.
A dongle dedicated to Modal software
Installation
Installation of the Modal Software
Insert the CDRom in the appropriate driver and wait for the Autorun program or run the "setup".
The following window is displayed:
Click on "Next >".
The following window is displayed:
Read the terms in the license agreement and click on "Next >".
The following window is displayed:
Select the location of the "Modal" folder. By default, Modal is installed in C:\Program Files\OROS\NVSolutions\Modal V5.2
Click on "Next >".
The following window is displayed:
Click on "Install".
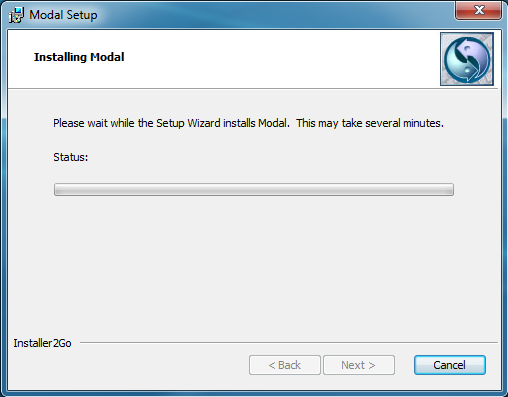
The following window is displayed:
Wait while the Setup Wizard installs Modal.
Then the following window is automatically displayed.
Click on "Install Driver". The following window may be displayed.
Click on "continue".
A message indicates if the driver has been installed successfully.
Click on "Close".
Then the following window is displayed.
Pick "launch Modal" if you want to launch the software immediately.
Warning: Don’t forget to plug the dongle to launch correctly the software
Click on "Finish".
First steps
Modal software first description
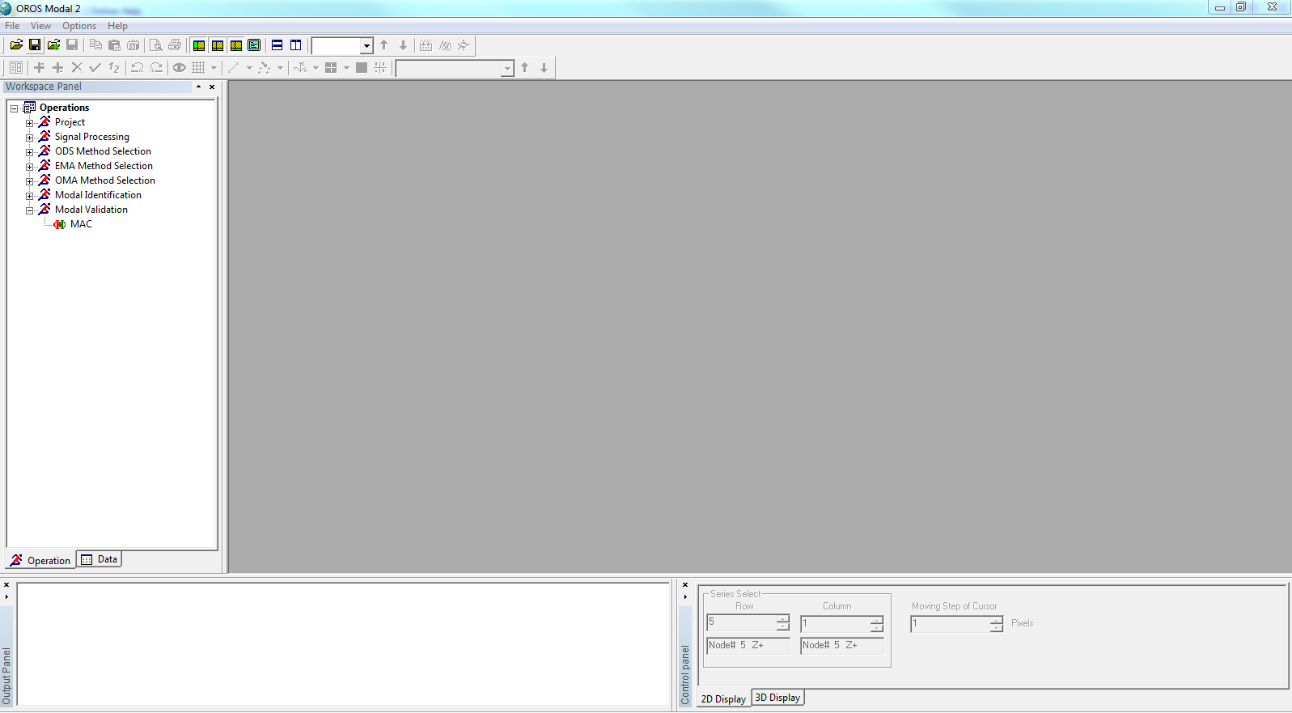
When you launch Modal, the following window appears few seconds.
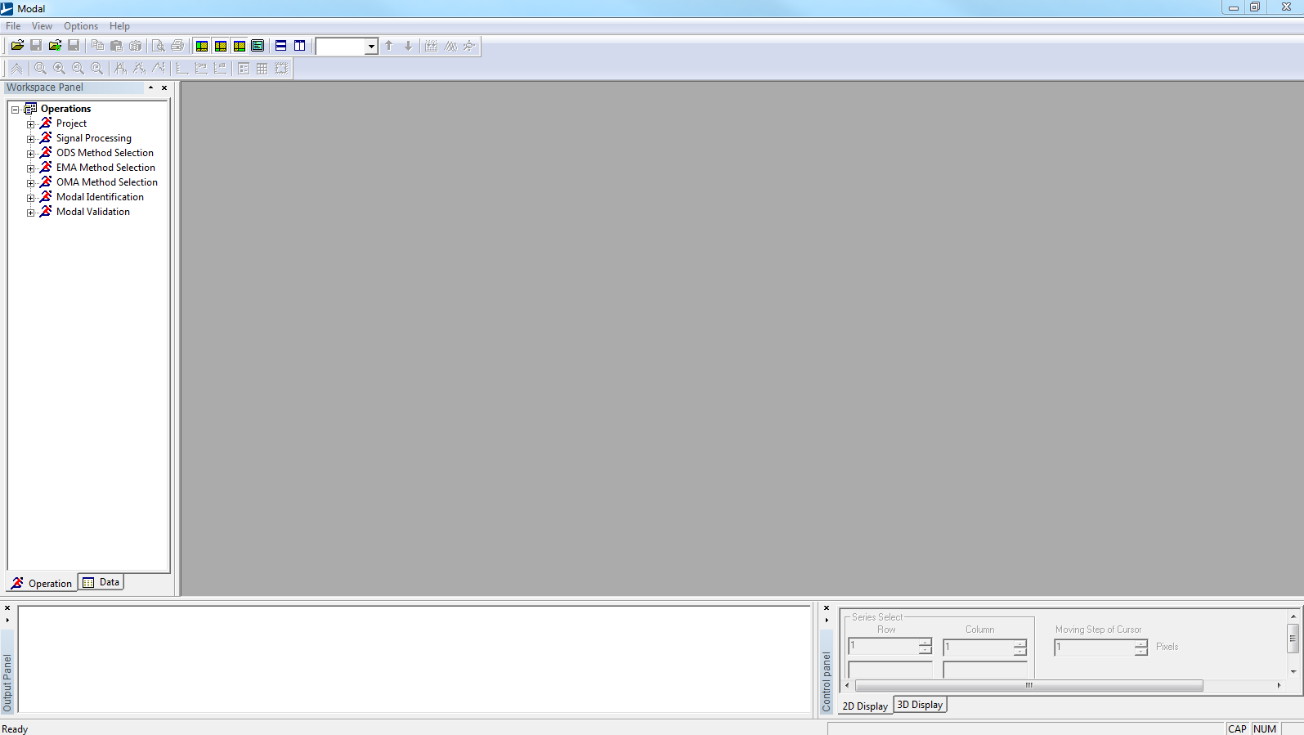
Finally the following window is displayed
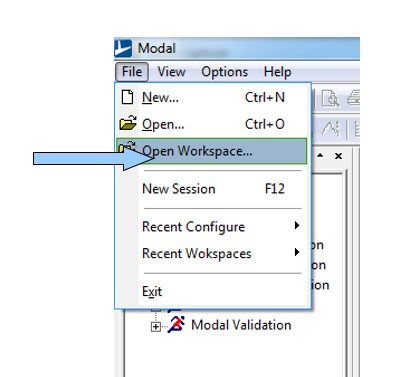
Click on ’file’ in the menu toolbar and on ’open workspace’.
For the first time you can open one of existing projects installed at the same time than the software in the directory ’examples’.
There are:
- 4 different projects for Experimental Modal Analysis
- 2 different projects for Operational Modal Analysis
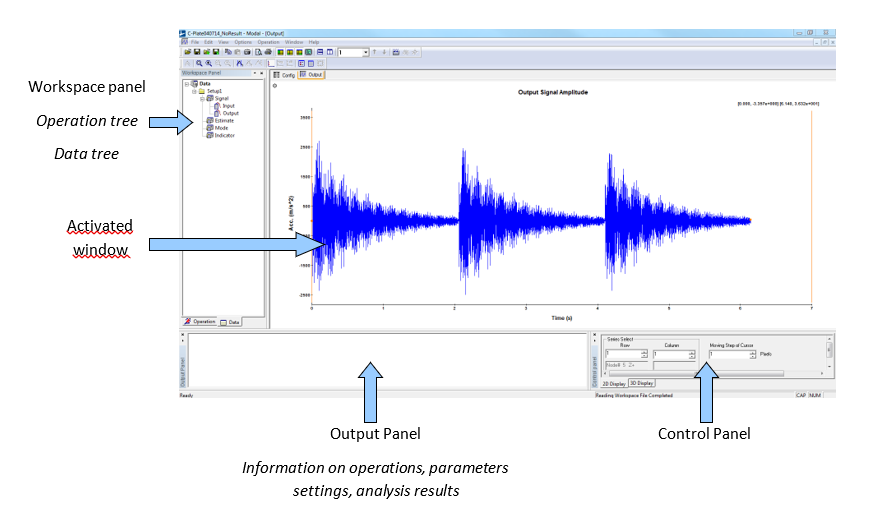
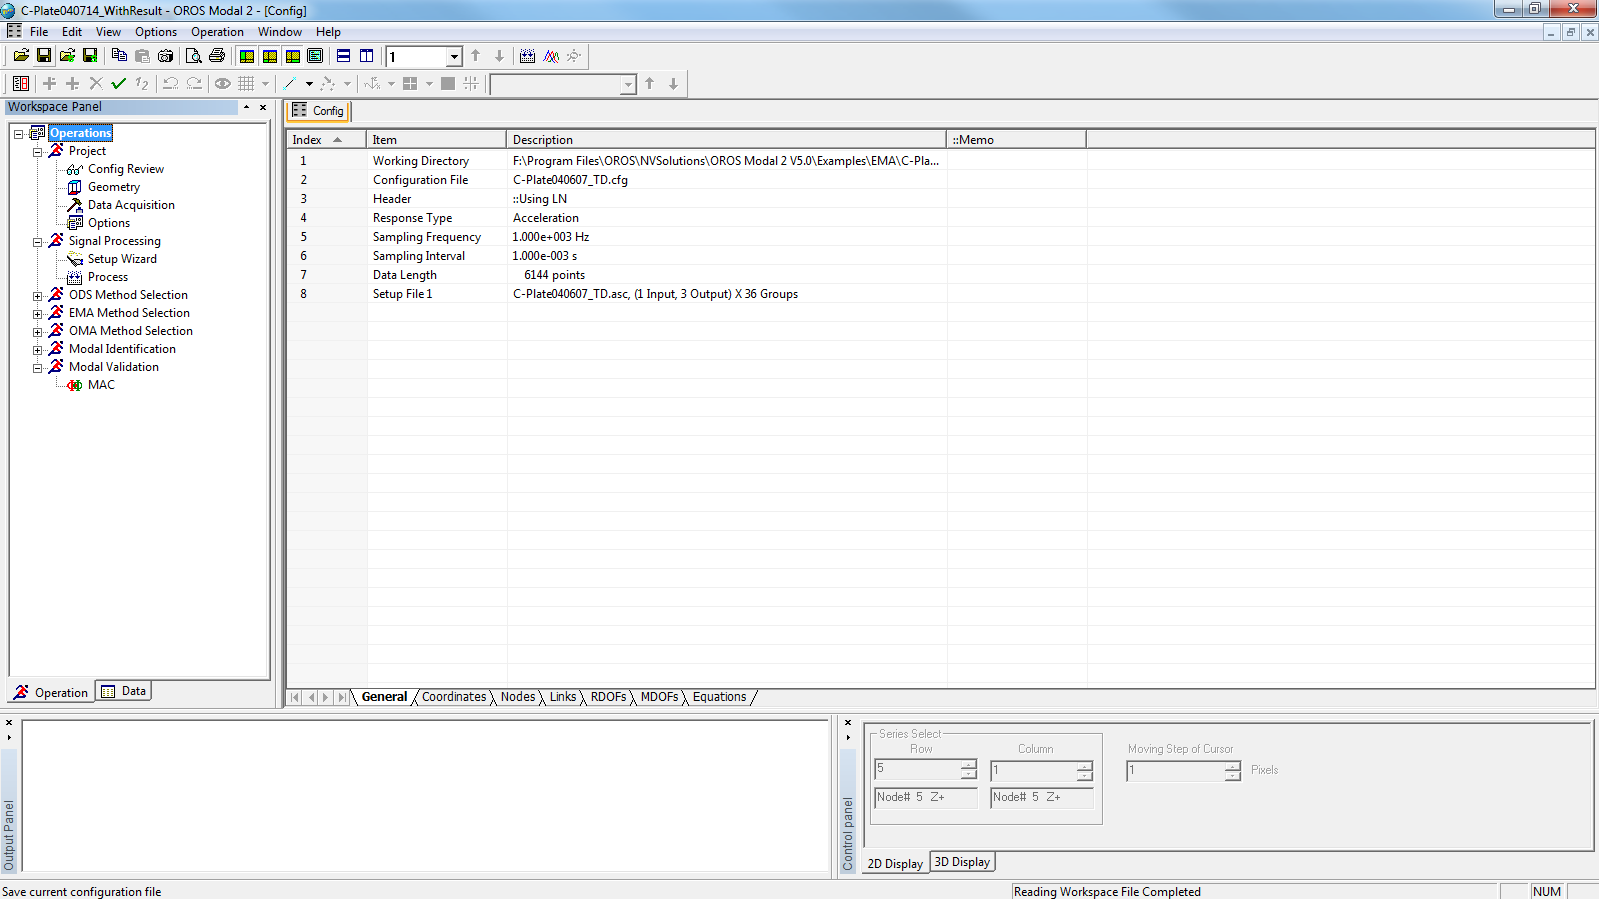
The main interface of the software is so displayed.
The window is shared in four distinct parts. Each of them has their own utilities.
Workspace panel contains:
- an operation tree organized as a wizard to follow the different steps of a modal analysis
- a data tree where you can fine all the data and results imported or calculated in the opened project.
Activated window can display:
- 2D windows: time domain data, FRFs estimation, curve-fitting…
- 3D windows: geometry, mode shapes.
Output Panel displays the last calculated results.
Control Panel contains the different commands and functions respectively useful for 2D and 3D windows.
To know more
To discover the different function of this software, please open the ’getting started’ file installed at the same time than the software. You can follow the different steps described in the document to obtain some results very quickly.
The online help embedded within the software can help you and be also consulted for all kind of questions.
Upgrade procedure
Upgrades available
Several upgrade possibilities are available for this software. If you have already purchased a version of Modal and that you want to acquire other options several possibilities can be proposed to you.
Upgrades:
- ORNVS-MOD330u: ORNVS-MOD300 to ORNVS-MOD300
Add EMA SIMO Identification method
- ORNVS-MOD350u: ORNVS-MOD330 to ORNVS-MOD350
Add EMA MIMO Identification methods
Options
- ORNVS-MOD200: Acquisition available on all OROS 3-Series analyzers
Option allowing to do acquisition directly in Modal
- ORNVS-MOD180: OMA (Option to ORNVS-MOD300 or ORNVS-MOD330)
Add OMA Identification method
Upgrade procedure
Upgrade order
If you order one of upgrades or options described above, a procedure should be followed:
Indeed, the number of the dongle is necessary to upgrade it.
You could find the number of your dongle directly written on it.
Please communicate it to OROS with your order simultaneously.
Software upgrade
- Uninstall the previous version of Modal installed on the PC:
Insert the CD in the appropriate driver and wait for the Autorun program (or run the "setup.exe" program from the CD).
The following window is displayed:
Click on Remove.
The following window is displayed:
Click on remove.
The following window is displayed.
Wait during this window is displayed.
Click on finish.
Start the installation of the new version
Please follow the procedure described from page 8 to page 13.
Dongle upgrade
Following your upgrade order, you will receive an upgrade file from OROS (.upg).
At this time open the DogInst application
The following window is displayed
Click on ’Upgrade’ and select the upgrade file you received.
The message ’Upgrade succeeded’ will appear.
Modal User’s manual
Introduction
Modal test and analysis is used to determine the engineering structures’ modal parameters, such as modal frequencies, damping ratios, and mode shapes. The measured excitation and response (or only response) data are utilized in modal analysis, and then dynamic signal analysis and modal parameters identification are processed. The modal test and analysis has been developed for more than three decades, and much progresses have been made. It has been widely applied to the engineering filed, such as the dynamic design, manufacture and maintenance, vibration and noise reduction, vibration control, condition monitoring, fault detection, model updating and model validation.
Operating Deflection Shape
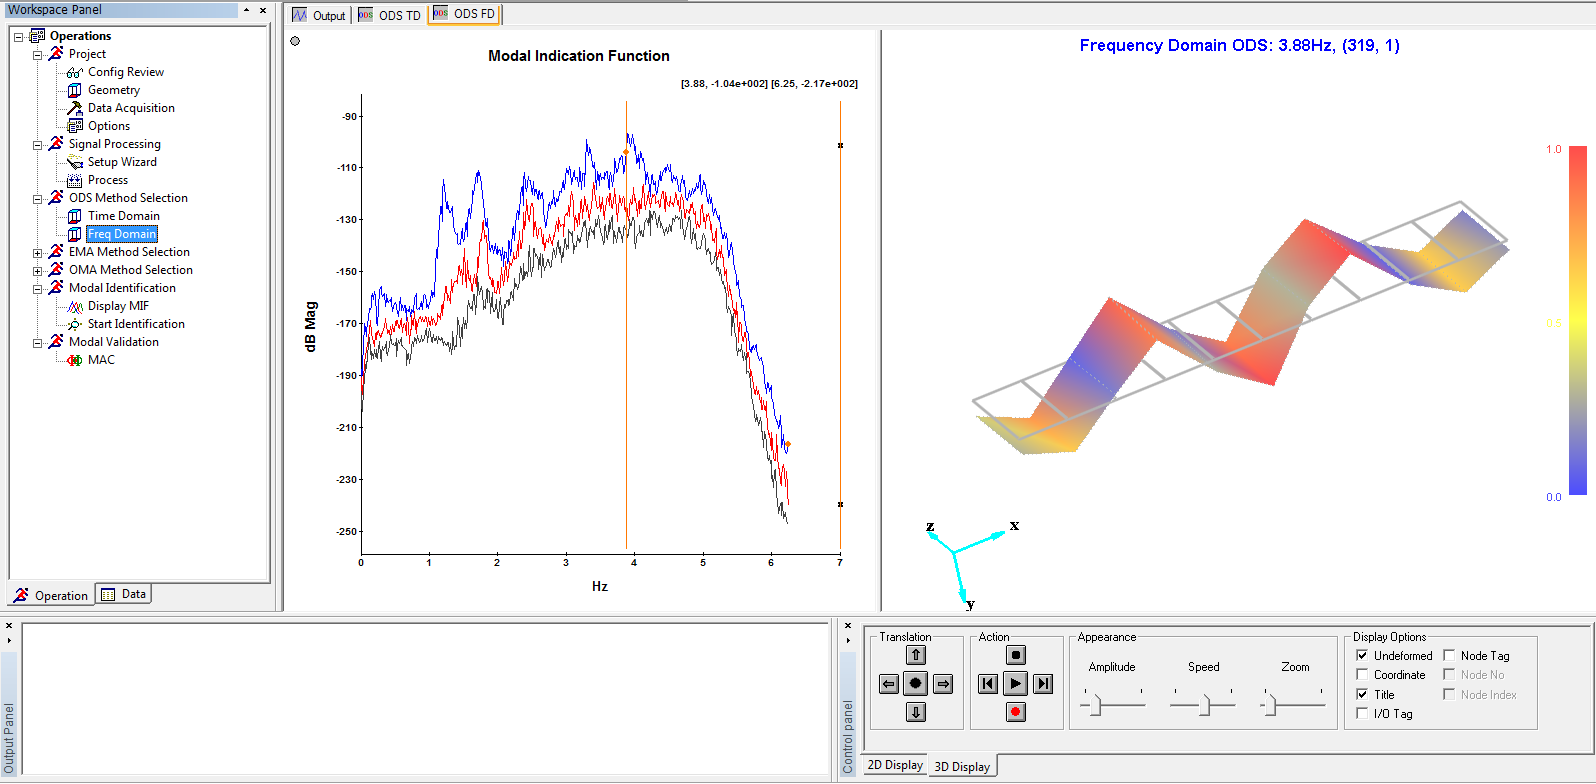
Operating Deflection Shape (ODS) is the simplest way to see how a machine or structure moves during its operation, at a specific frequency or moment in time. There are two types of ODS: time domain ODS (TD ODS) and frequency domain ODS (FD ODS).
TD ODS is based on the multi-channel time history data acquired spatially from a machine or structure. It shows the vibration motion of the machine or structure in a period of time clearly, just like a recorder. You can view a structure’s overall motion, and the motion of one part relative to another. Locations of excessive vibration are easily identified.
FD ODS is based on the frequency response functions (FRFs) or power spectral density functions (PSDs), which can be estimated from multi-channel time history data acquired spatially from a machine or structure. It shows how a structure behaves at a single frequency, helping you to find whether or not a resonance is being excited. In the OROS Modal, you even be allowed to inside the different behaves of repeated frequencies.
Experimental Modal Analysis
In the Experimental Modal Analysis (EMA), the structures are excited by artificial forces, then both the inputs (excitation) and outputs (response) are measured to get the frequency response functions (FRFs) or impulse response functions (IRFs) by digital signal processing. Modal parameters can be identified from FRFs or IRFs by identification algorithms in frequency domain or time domain. EMA tests are usually carried out in the lab, with the advantage of high SNR (Signal to Noise Ratio) and easy to change test status.
EMA identification methods can be classified into time domain (TD) methods and frequency domain (FD) methods according to different identification domain. Also they can be classified into SISO (single input single output), SIMO (single input multiple output), and MIMO (multiple input multiple output) according to different number of input and output.
The FRFs are generally utilized for the EMA in frequency domain, which are estimated from the excitation and response signals. Then the modal parameters are identified by constructing the parametric or nonparametric models of the FRFs and and curve fitting them. While the IRFs are generally utilized for the EMA in time domain, which can be obtained the inverse FFT of FRFs.
Time domain methods are suitable for the global analysis in a broad frequency band, which have good numeric stability. However, there are some limitations too: (1) very difficult to confirm the order of math model, (2) always time consuming, (3) many calculation modes got with the structural modes, and difficult to delete them, (4) many setting and judgment needed, complicated-to-use, (5) not able to taking account of the influence of out-band modes. Contrarily, frequency domain methods are always reliable, rapid, easy-to-use, with the capacity to consider the out-band modes and analysis uneven spaced FRFs, so they are applied widely.
Operational Modal Analysis
Operational Modal Analysis is used for large civil engineering structures, operating machinery or other structures, making use of their output response only. These structures are always loaded by natural loads that cannot easily be controlled and measured, for instance waves loads (offshore structures), wind loads (Buildings) or traffic loads (bridges).
Compared with EMA, OMA has its outstanding advantages. In OMA the structure studied is excited by natural loads instead of some expensive excitation equipments as used in EMA. In fact it is very difficult to excite large structures by artificial means. So OMA is more economic and fast, and endowed by nature with characteristics of multiple-input / multiple-output (MIMO). It could be used to distinguish closely coupled modes. Moreover, all the measured responses come under operational state of structures, and their real dynamic characteristics in operation could be revealed, so OMA is very suitable for health monitoring and damage detection of large-scale structures.
Because there are limited channels and accelerometers in a data acquisition system, you may need to decide how to distribute the many measurement points in several groups, the so-called setups. For each setup you should keep 1 or more accelerators at the same location, which are called reference points. The reference points should be located far away the nodal points of the mode shapes. It is recommended to set 2 or 3 reference points.
Modal software features
- Running on the current mainstream Operating systems: Windows 2000/XP/2003 Server/Vista
- Coding with VC++ language and object oriented programming technique, easy to be maintained and expanded
- Four powerful functions: geometry modeling, project management, dynamic signal processing, and modal analysis
- Convenient data importing interface, not only for time domain signal, but also frequency domain signal
- Direct data acquisition from OR3x series analyzers, performing a modal test easily and rapidly
- Various data format: Modal standard file format, Universal File Format (UFF) and OROS format (res, oxf, or oxl)
- Integrated functions for geometry modeling
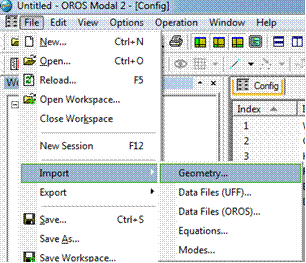
- Import geometry from UFF or IGES files
- Export geometry to UFF files
- Create regular 3D geometry objects
- Create and edit geometry interactively
- Undo and redo operations for geometry edit
- Customized geometry library
- Combined with all kinds of data acquisition systems or dynamic signal analyzers to make up advanced modal analysis systems
- Powerful, effective and easy-to-use signal processing based on wizard setting
- Detrend, decimation and digital filter
- Customized FFT parameters: FFT length, average times, and overlap percent
- All kinds of window function: boxcar, hanning, hamming, flattop, exponential, force and so on
- Power Spectrum Density (PSD) estimation: Auto PSD, Cross PSD, PSD matrix, using Welch’s averaged periodogram technique
- Single input / multiple output (SIMO) FRF estimation: H1, H2 and Hc methods
- Multiple input / multiple output (MIMO) FRF estimation with multiple coherence function
- The signal processing is reversible
- Dealing with not only traditional Experimental Modal Analysis (EMA), but also Operational Modal Analysis (OMA)
- EMA techniques based on both input (excitation force) and output response
- Select-band SIMO modal analysis technique: SIMO rational fraction orthogonal polynomial (RFOP), to obtain several modes from a selected frequency band by one identification
- Narrow-band MIMO modal analysis technique, MIMO complex mode indicator function (CMIF), to identify modes one by one
- Select-band MIMO modal analysis technique: frequency domain poly-reference (FDPR) and MIMO rational fraction orthogonal polynomial (RFPM), to obtain several modes from a selected frequency band by one identification
- Broad-band MIMO modal analysis technique: EMA broad band frequency domain (EBFD) , to obtain many modes from a broad frequency band by one identification, or even obtain all the modes from the full frequency band by one identification
- MIMO analysis methods: with capacity to identify heavy close or even repeated modes, ideal methods for experimental modal analysis of large and complicated structures
- Single reference (SR) and Multiple References (MR) hammer impact modal analysis techniques
- OMA techniques base on output data only
- Valuable for the large civil engineering structures, operating machinery or other structures which are not easily excited artificially; cheap and fast, without requirement for excitation equipment; able to get the dynamic characters of structures in real operating conditions
- Narrow-band operational modal analysis technique: frequency spatial domain decomposition (FSDD), to obtain modes one by one from the full output spectrum matrix
- Narrow-band operational modal analysis technique: complex mode indicator function (CMIF), sharing the same algorithm with EMA Narrow-band, to obtain modes one by one from the half output spectrum matrix
- Broad-band operational modal analysis technique: OMA broad band frequency domain (OBFD), to obtain many modes from a broad frequency band of the half output spectrum matrix by one identification, or even obtain all the modes from the full frequency band by one identification
- Adopting mode indicator function (MIF) to indicate the existence of structural modes
- Unlimited number of identified modes
- Flexible interface arrangement and various mouse and hotkey operation, thereby greatly improving work efficiency
- Perfect and friendly function for arranging interface, operating and exporting data
- Multiple language interface: English and Chinese are available, and it’s convenient to develop other language interface
- Special 2D and 3D graphic control panes, supplemented with other control modes such as mouse, hotkey, and menu operations
- Flexible 2D curves display and control: showing or hiding gridlines, legends and other components, providing complete measurement information (measurement node, direction, whether driving point or not, and so ) of each plot
- Multiple curve expressions: magnitude (linear, log, and dB coordinate), phase, unwrapped phase, real part, imaginary part, and Nyquist
- Flexible 3D graphics display and control: showing or hiding node ID, input / output tags, axis and other components, freely translating, zooming and rotating the object
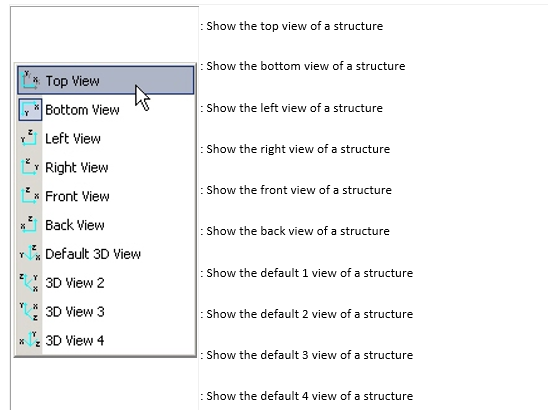
- Top, bottom, left, right, front and back view of 3D objects, rendering in the style of frame lines or surface
- Animation control based on OpenGL: play, stop, previous/next frame, amplitude and speed control functions
- Exporting the modal results to text or graph
- Directly saving all the curves or graphics to BMP or JPG files
- Exporting the mode animation to AVI media files, convenient to generate multimedia presentation
Environment
General interface
When Modal is running, the following interface will be displayed.
The menus, toolbars, workspace panel, output panel and control panel are listed from top to bottom. The center empty area of the interface is reserved for the main window. The workspace panel, output panel and control panel are generally called shortcut panels. The state bar locates in the bottom of window. The menus’ tips, processing bar and its tips are all showed on the state bar.
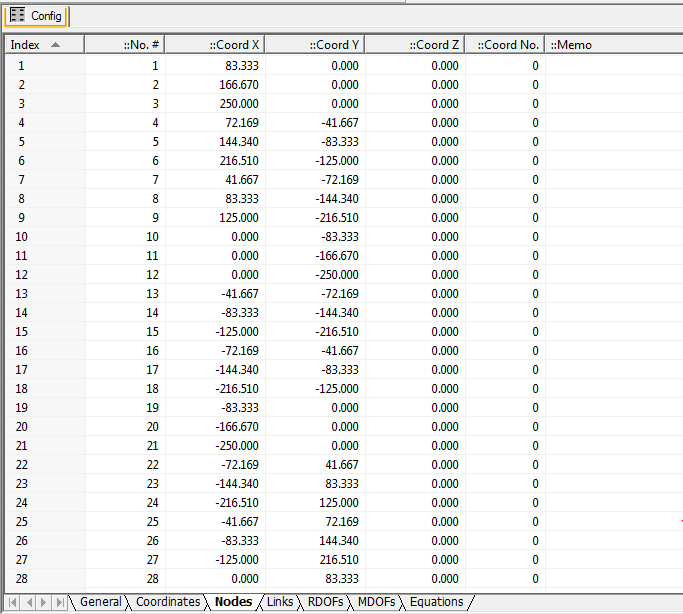
When you create a new configuration file or open a workspace file without measurement data, the ’Config’ window will first be shown.
When users open a configuration file or workspace file with measurement data, the ’Output’ curve window will first be shown. There are two cursors on the left and right of the window respectively. The red point denotes the closest point to the cursor. The X and Y axes values of the two red points are shown dynamically on the top right corner of the window.
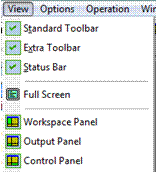
Each part of the interface can be shown or hidden through menu or toolbar operation. Users can also change the size or positions of each part by dragging the mouse.
Besides, all parts of the interface can be arranged to floating style for the purpose of getting more display space.
The software can also remember the adjusted interface style automatically in order to fit users’ habits.
Geometry modelling
Principle
To begin with the geometry modeling, we should know about three important concepts, i.e. coordinates, nodes and links. A geometry is made up of these three elements.
Coordinates
Global and local coordinates
There are two kinds of coordinate systems in Modal, i.e. the global coordinate system and local coordinate system. The global coordinate system which defines the global origin point and global X, Y, and Z axis, is a kind of Cartesian coordinate. The No. of global coordinate system is 0 in Modal. The local coordinate systems are all defined referring to the global coordinate. Three kinds of local coordinate systems are available now, i.e. the Cartesian coordinate, the cylindrical coordinate and the spherical coordinate. You can have only one global coordinate, but many local coordinates. All the coordinates in Modal are defined according to the right-hand rule.
Cartesian coordinate
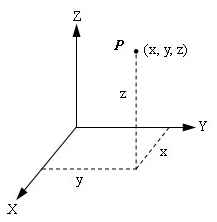
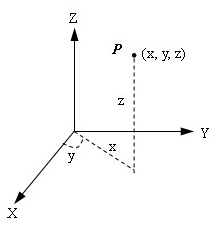
To define a point in the Cartesian coordinate system, you need three translations x, y, and z as the following:
Cylindrical coordinate
To define a point in the Cylindrical coordinate system, you need radius x, rotation y, and translation z, as the following:
Spherical coordinate
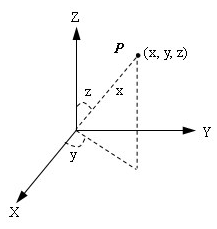
To define a point in the Spherical coordinate system, you need radius x, rotation y, and rotation z, as the following:
It’s easy to transform between these three coordinate systems.
Define a coordinate
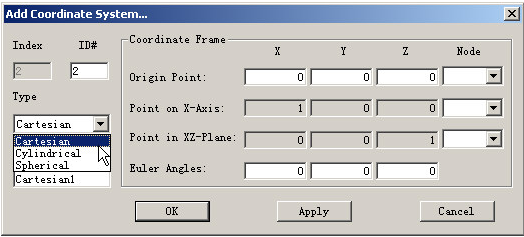
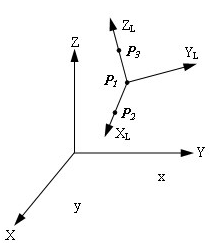
To define a local coordinate system, you should assign an ID No., select the coordinate type, and specify the position and direction of local coordinate frame. A local coordinate OLXLYLZL is always defined referring to the global coordinate OXYZ. In Modal, three points are employed to specify the coordinate frame, i.e. the original point P1, a point P2 on the XL aix, and another point P3 on the XLZL plane. For convenience, the point P3 is usually selected on the local ZL axis.
As shown in the above picture: the local XL axis can be determined by P1 and P2; the plane XL-ZL can be determined by P1, P2, and P3, thus the ZL axis can also be obtained; the YL axis can then be determined according to the right-hand rule.
You can also define a local coordinate system by the origin point and three Euler angles.
Nodes
Define a node
A node must belong to a coordinate, either the global coordinate system or a local coordinate system. Besides the coordinate ID, you still need to specify its No. and x, y, z values.
Directions of a node
In Modal, it’s very important that the directions of a node are defined in the local coordinate system.
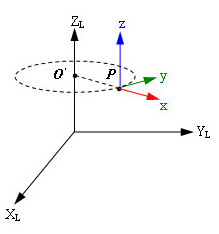
In a local Cartesian coordinate, all the points have the same directions with local axis. These three directions accord with right-hand rule.
In a local cylindrical coordinate: the x direction vector start from the cross point O’ to node point P; the z direction is the same as local ZL axis; and the y direction is tangential to the circle. These three directions accord with right-hand rule.
In a local spherical coordinate: the x direction vector start from the origin point to node point P; the y direction is tangential to the longitude circle; and the z direction is tangential to the latitude circle. These three directions accord with right-hand rule.
Links
Two types of link are supported in Modal: lines and polygons.
A line is defined by two nodes. For instance, "3 5" defines a trace line between node 3 and node 5.
A polygon is defined by a sequence of nodes. You are allowed to define a polygon with arbitrary number of nodes, which should be arranged according to the clockwise or anticlockwise direction. For instance, "1 2 3 4 5 6" defines a hexagon.
Geometry in Modal software
To build a geometry model in the Modal software, you have three methods at least:
- Use the integrated function for geometry modeling in Modal
- [file://mk:@MSITStore:C:\Program%20Files%20(x86)\OROS\NVSolutions\OROS%20Modal%202%20V5.1\OROSModal.chm::/On-line%20Help/Chapter%203/Chapter%203.4/Chapter%203.4.1.htm Import geometry from UFF files];
- Create geometry information in the Excel, and then copy and paste them to the [file://mk:@MSITStore:C:\Program%20Files%20(x86)\OROS\NVSolutions\OROS%20Modal%202%20V5.1\OROSModal.chm::/On-line%20Help/Chapter%202/Chapter%202.4/Chapter%202.4.1.htm "Config" view].
geometry modeling illustration
In this section, the process of creating an uneven spaced plate is introduced.
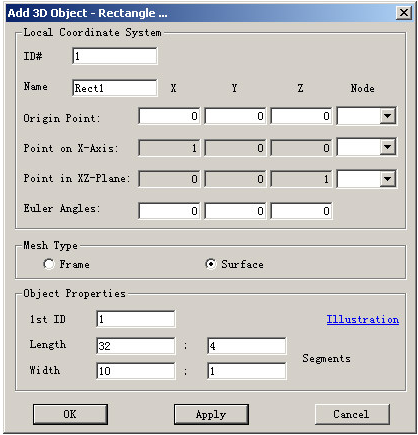
The plate is 10 in width, and 114 in length, which is divided into 12 segments. The first 4 segments (A) and last four segments (C) are evenly distributed with an interval of 8, and the middle 4 segments (B) are evenly distributed with an interval of 12.5. To ensure the nodes numbered continuously, the following steps should be processed:
- Segment A. The parameters should be set as below:
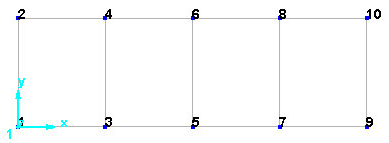
The structure showed as below is got:
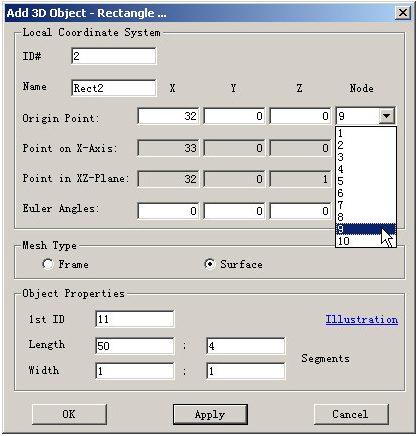
- Segment B. The origin point of segment B should be node 9. The value of Point on X-Axis and Point in XZ-Plane will be changed automatically.
The structure showed as below is got:
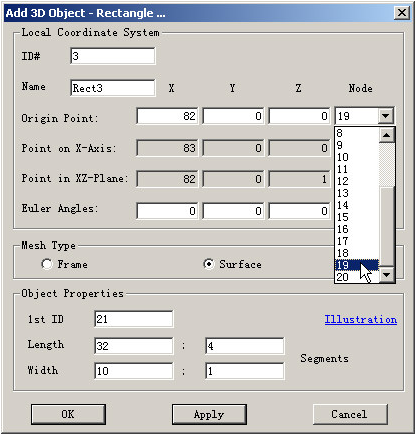
- Segment C. The origin point of segment C should be node 19. The value of Point on X-Axis and Point in XZ-Plane will be changed automatically.
- Note that there are some repeated nodes, for example, node 9 and node 11, node 10 and node 12. Remove all the repeated nodes by pressing the button of "validity check"
.
- Note that the IDs of nodes are not continuous now. Renumber all the nodes in-order by pressing the button
. The task of modeling has been accomplished by now.
Basic geometry library
Geometry modeling is realized in the "Config" view or 3D "Geometry" view by operating the relevant toolbar and right click menu. The location, shape, mesh and numbering of a 3D object can be totally specified by setting its local coordinate system, mesh type, first ID and properties. Several internal 3D objects are included in Modal, such as Line Segments, Line, Rectangle, Trapezia, Sector, Elliptic Sector, Cube, Elliptic Cylinder, Cone, and Sphere.
When bundling several 3D objects together, there may exist some repeated nodes, which will lead to some problems. It’s recommended to delete these repeated nodes. You can finish this task conveniently in Modal.
Local coordinate systems
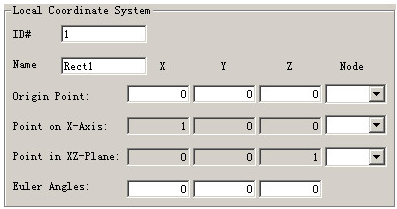
Each new 3D object will be created with a new local coordinate, whose type depends on the different kinds of object. You should define the origin point and coordinate frame in the below interface.
The local coordinate is determined by three geometry point in Modal.
The ID# will be specified automatically. Of course you can change it if necessary. You can type the three points manually, or select an existed node from the "Node" list. If a node is selected, its global coordinate value will be filled into the blanks automatically.
Note: On the icons for adding 3D objects in the toolbar, the light blue point indicates the origin of local coordinate system. For example, the icon
indicates that the origin of a rectangle object lies in its bottom left corner.
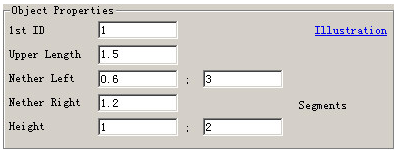
Moreover, there is hyperlink text of "Illustration" on the dialog of setting properties. Illustration graph of 3D object to be added will show when moving cursor on it.
Mesh type
This option allows you to set the mesh type to frame or surface. If the surface type is selected, the meshed can be rendered. For a line object, only the frame type is optional.
st ID
This option allows you to set the first node ID of a new 3D object. Modal automatically assigns the 1st ID for the new object. It’s recommended to set this parameter equal or large than the default value for a primary user.
Of course, in some occasions, setting the 1st ID flexibly will greatly reduce the workload for an advanced user.
Properties
- Line Segments
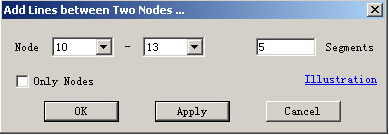
Add line segments between two specified nodes. If "Only Nodes" is checked, then the links will not be added.
- Line
Only the length and number of segments are required for a line object. The line is along the X axis of local coordinate, and its local origin locates in the left fringe. The node IDs are increasing from its left to right. The new coordinate is of Cartesian type.
- Rectangle
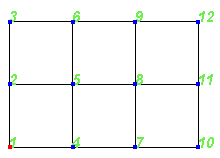
Length, width and their number of segments should be specified for a rectangle object. The local origin of a rectangle object locates in its bottom left corner. The node IDs are increasing from its left to right. The nodes are numbered from the origin, in the turn of from left to right and from bottom to top. The new coordinate is of Cartesian type.
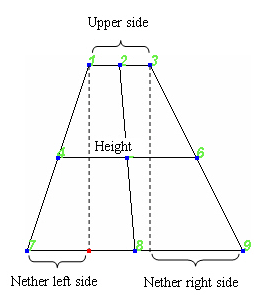
- Trapezia
Upper side length, nether left side length, nether right side length, height and their number of segments should be specified for a trapezia object. The local origin of a trapezia object is the intersection point of left height line and nether side, which is shown as the red point in the figure below. The nodes are numbered in the turn of from bottom to top and from left to right. The new coordinate is of Cartesian type.
If the length of nether left side or nether right side is equal to zero, it’s a right-angle trapezia. If both of them are equal to zero, it’s a rectangle. If the length of upper side is equal to zero, it’s a triangle.
- Sector
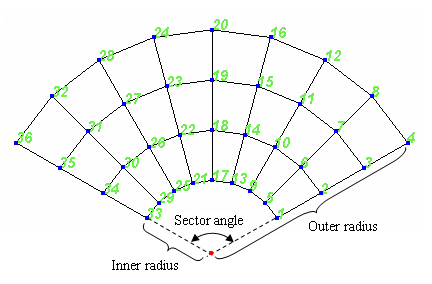
The shape of a sector object is specified by the sector angle, inner radius and outer radius. To mesh the sector you should set the number of segments of sector angle and radius. The local origin of a sector object is right the circle center. The sector object is distributed symmetrically to the Y axis of local coordinate system. The nodes IDs are increasing from inner to outer in the anticlockwise direction. The new coordinate is of Cylindrical type.
If the sector angle is equal to 360 degrees, it’s a hollow cirque. If the inner radius is equal to zero, it’s a solid sector. If the sector angle is equal to 360 degrees, and the inner radius is equal to zero, it’s a solid circle.
- Elliptic Sector
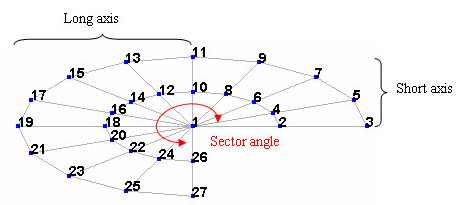
The shape of an elliptic sector object is specified by the sector angle, long radius and short radius. To mesh the elliptic sector you should set the number of segments of sector angle and radius. The local origin of a elliptic sector object is right the ellipse center. The nodes IDs are increasing from inner to outer in the anticlockwise direction. The new coordinate is of Cartesian type.
If the sector angle is equal to 360 degrees, it’s an ellipse. If the long radius is equal to the short radius, it’s a circle sector, which is the same as the sector object introduced above. If the sector angle is equal to 360 degrees, and the long radius is equal to the short radius, it’s a solid circle too.
- Cube
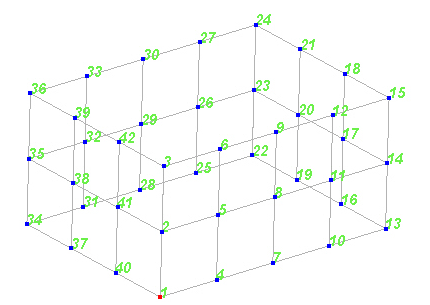
Length, width, height and their number of segments should be specified for a cube object. The local origin of a cube object locates in the nether left corner of the front side, which is shown as the red point in the figure below. The nodes are numbered from the origin, and the IDs are increasing from nether to upper in the anticlockwise direction. The new coordinate is of Cartesian type.
There is neither top side nor bottom side in this cuboid object. If necessary, you can bundle this object with two rectangle objects, and then remove the repeated nodes to get a cube with all six sides. If the length, width and height are all equal, it’s a cube.
- Elliptic Cylinder
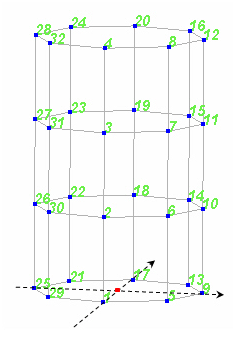
Long axis and short axis and height should be specified for an elliptic cylinder object. To mesh this object you should set the number of segments of circumference and height. The local origin of an elliptic cylinder object is right the ellipse center of bottom side. The nodes are numbered from the Y axis of local coordinate, and the IDs are increasing from bottom to top in the anticlockwise direction. If the cross section is an circle, the new coordinate is of Spherical type. If the cross section is an ellipse, the new coordinate is of Cartesian type.
There is neither top side nor bottom side in this elliptic cylinder object. If necessary, you can bundle this object with two sector or elliptic sector objects, and then remove the repeated nodes to get a elliptic cylinder with top and bottom sides.
If the long axis is equal to the short axis, it’s a common cylinder.
- Cone
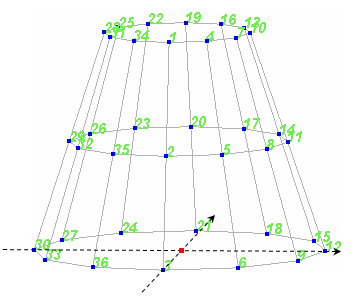
Upper radius, nether radius and height should be specified for frustum of a cone object. To mesh this object you should set the number of segments of circumference and height. The local origin of a cone object is right the circle center of bottom side. The nodes are numbered from the Y axis of local coordinate, and the IDs are increasing from bottom to top in the anticlockwise direction. The new coordinate is of Cylinder type.
There is neither top side nor bottom side in this cone object. If necessary, you can bundle this object with two sector or elliptic sector objects, and then remove the repeated nodes to get a cone with top and bottom sides.
If the upper radius or nether radius axis is equal to zero, it’s a complete cone (not a frustum).
- Sphere
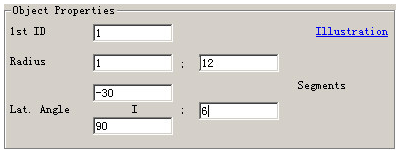
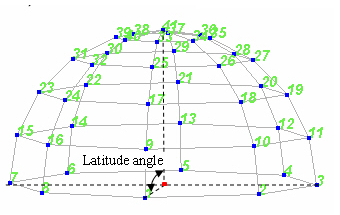
Radius and range of latitude angle should be specified for frustum of a sphere object. The range of a latitude angle is [-90,90] degree. Latitude angle of zero means the equator. Latitude angle of -90 degree means the south pole. Latitude of 90 means the north pole. To mesh this object you should set the number of segments of circumference and latitude angle. The nodes are numbered from the negative Y axis of south latitude plane in the local coordinate, and the IDs are increasing from south to north in the anticlockwise direction. The new coordinate is of Spherical type.
If the latitude angle is greater than -90 degree and less than 90 degree, it’s the frustum of a sphere. There is neither top side nor bottom side in this cone object. If necessary, you can bundle this object with two sector or elliptic sector objects, and then remove the repeated nodes to get a complete frustum of sphere. If the latitude angle ranges from -90 degree to 90 degree, it’s a complete sphere. If the latitude angle ranges from zero to 90 degree, it’s a hemisphere.
Interactive geometry modelling
Modal also provides you with functions of interactive geometry modeling. You can add nodes, lines, polygons and 3D objects just by mouse clicking, and realize operations of translation, zoom, rotation, deletion, and so on. The functions are accessible by the Graphics Extra Toolbar.
The graphics extra toolbar is available only when geometry, mode shape or ODS animation are showed in the current main window. It is used to control the 3 dimension graphics and animations. This toolbar is the same as configuration extra toolbar, only different buttons are enabled, and its floating style is as below:
The functions of each button as follows:
- Show the interface for geometry modeling
- Delete the selected items
- Check all items, and remove the repeated nodes
- Renumber all the nodes in-order
- Undo the last action
- Redo the previous undone action
- Reset the layout to show the objects in window
- Show the grid plane or not. There is a dropdown menu below this button:
| : Show the grid plane or not | |
| : Snap to grid point | |
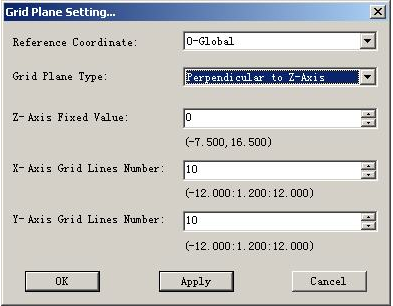
| : Call the dialog to set the parameters of grid plane |
Referring to the global coordinate or some local coordinate, the position of the grid plane can be set by changing the parameters in the dialog. With the grid plane, you’ll be convenient to edit the geometry, such as adding a node or moving a node. Note that the coordinate values displayed are all relative to the reference coordinate, and in the format of Cartesian, even if the reference coordinate is of cylinder or sphere type.
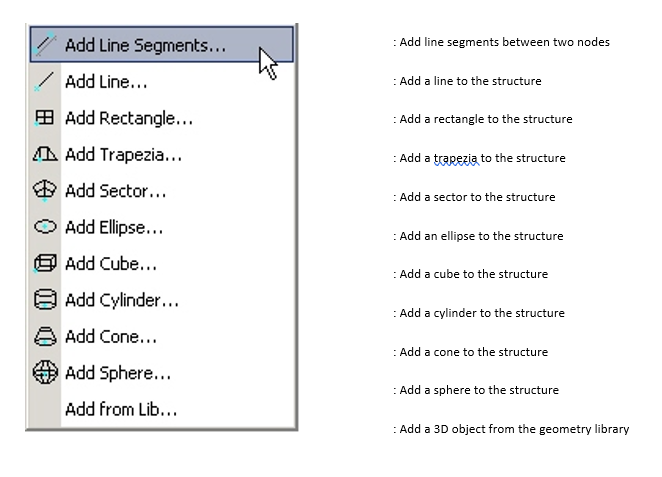
- Add line segments between two nodes. There is a dropdown menu below this button:
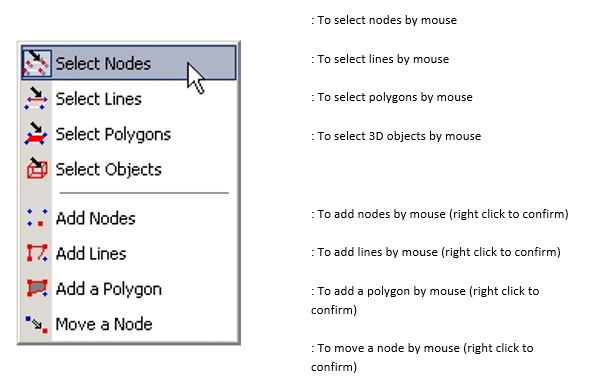
: To select nodes by mouse. There is a dropdown menu below this button:
- Show the default 3D view. There is a dropdown menu below this button:
- Display the transparent surface of un-deformed structure. There is a dropdown menu below this button:
- Render animation surface (for polygon elements) of not
- Show the single view or quad view in the window
- Select mode No. from the list (for mode shape animation)
- Turn to next mode (for mode shape animation)
- Turn to previous mode (for mode shape animation)
Import geometry
You can import geometry information from UFF 15/82/2412 files and IGES files.
You can create geometry information in the Excel, and then copy and paste them to the [file://mk:@MSITStore:C:\Program%20Files%20(x86)\OROS\NVSolutions\OROS%20Modal%202%20V5.1\OROSModal.chm::/On-line%20Help/Chapter%202/Chapter%202.4/Chapter%202.4.1.htm "Config" view].
Data acquisition
Data acquisition is a critical step for modal analysis: without correct data, no exploitable results. Thanks to the direct acquisition implemented in Modal, enjoy the Teamwork analyzers power and accuracy with a dedicated interface for structural acquisition. The interface works with the different excitation modes: impact hammer, shaker, operating excitation.
To excite a large structure, up to 6 shakers per analyzers can receive signals from generators outputs. In order to fit the wide range of potential cases, the complete series of excitation signals from random, chirp, swept sine, stepped sine to normal modes can be generated.
For high channel count applications, Teamwork technology cascades several analyzers together to acquire simultaneously hundreds of channels. Teamwork instruments guarantee an efficient instrumentation thanks to the different possible configuration.
For example, this flexibility allows to highly reduce the cable length by distributing the instruments along the structure under test.
The direct data acquisition (DAQ) module is available in Modal, which enables you to complete a modal test easily and quickly.
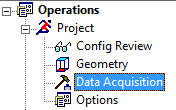
Launch the DAQ by clicking the "Data Acquisition" item, shown as the following.
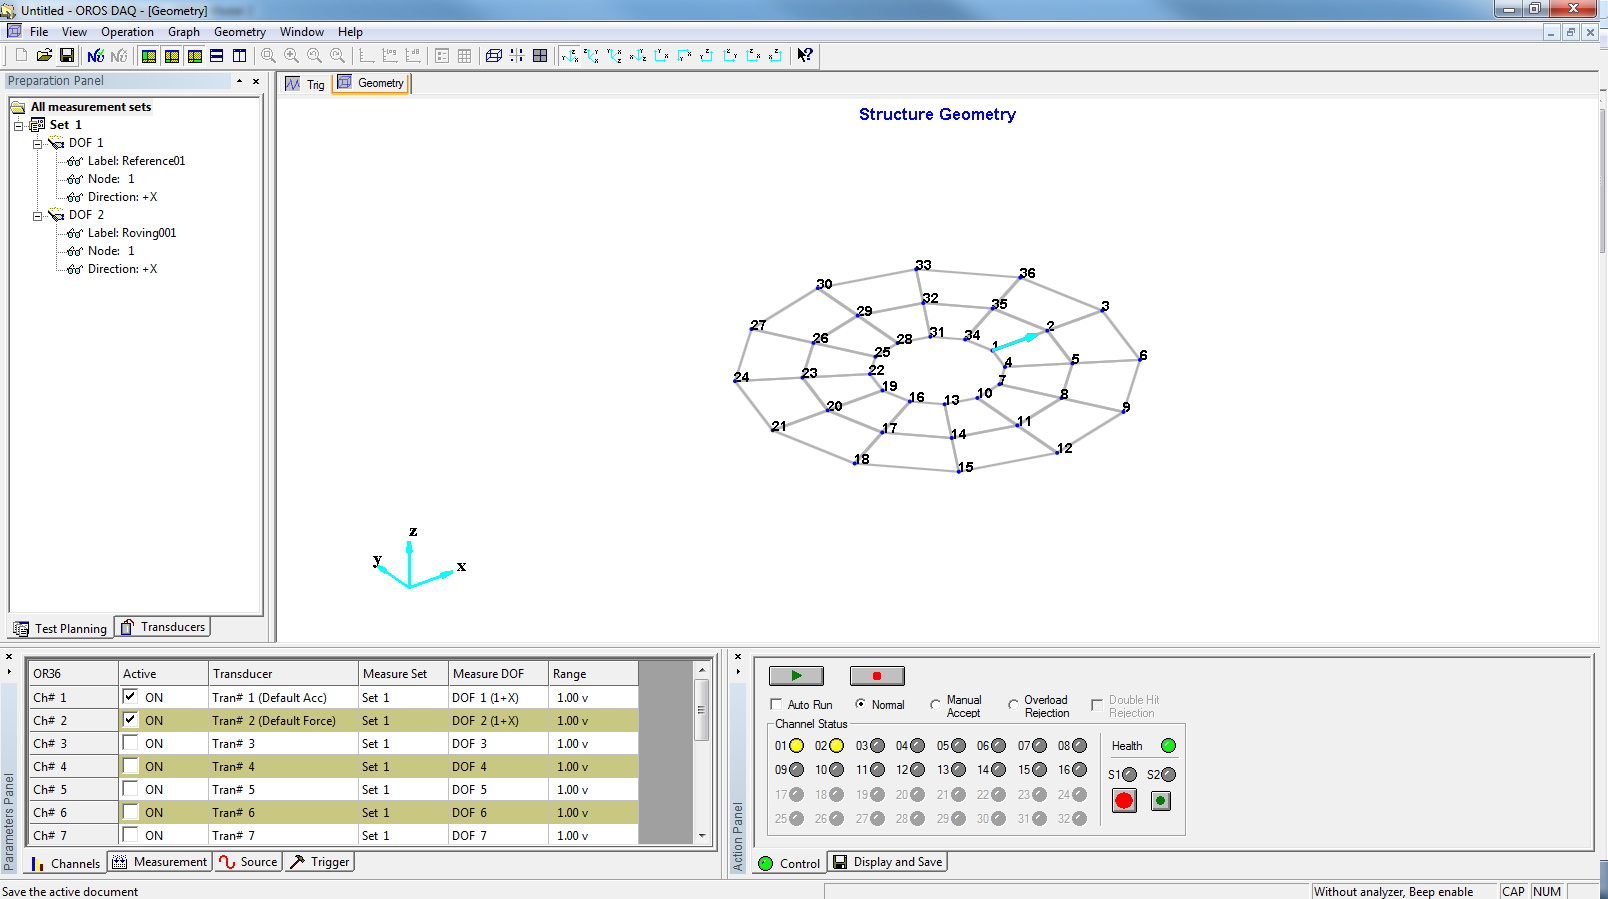
Then the geometry modeled in Modal will be transferred to DAQ automatically.
To perform a complete modal acquisition, follow the different steps described here.
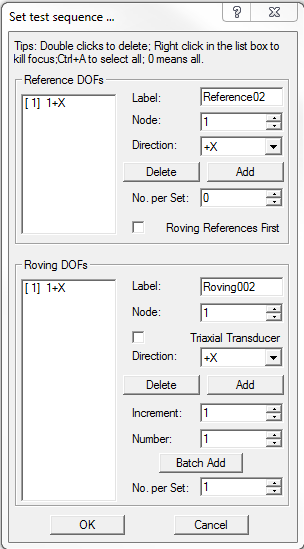
Test planning
In the preparation panel, set the test planning.
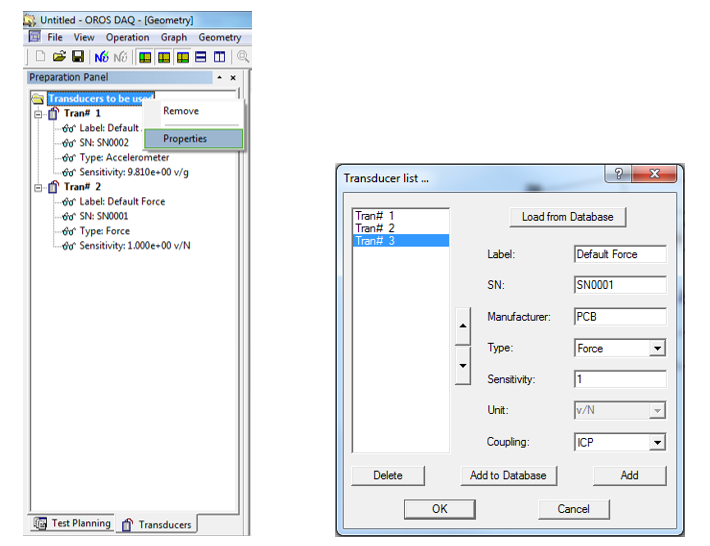
Transducers definition
Set the transducer list in the ’Transducers’ page of Preparation Pane. Note to select the correct transducer type and fill the correct sensitivity.
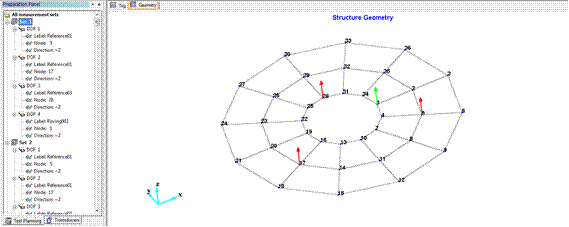
Check the different mesurements directly on the geometry
The references are displayed in red and the roving DOFs in green.
Measurement parameters setup
- Parameters Panel->Channel: set range for each active channel; match them to the corresponding measurement DOFs and transducers.
- Parameters Panel->Measurement: set the frequency range, spectral lines, average number, and window type.
- Parameters Panel->Trigger
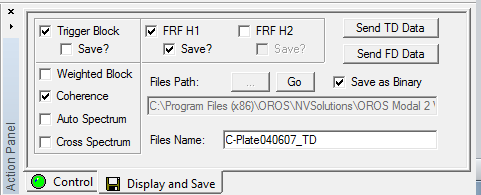
Display ans save options
Action Panel->Display and Save: set the data blocks you want to display and export. As the following graph, trigger block, FRF H1, and coherence will be displayed, trigger block and FRF H1 will be exported in the Binary UFF format. You can go to this data storage directory to check files by pressing button
.
Analyzer connection
Click the button on the toolbar showed as the following to lunch NVGate and connect to it. During this process, you may be asked to operate the wizard of NVGate. You should confirm that the NVGate has been launched successfully before pressing the ’OK’ button.
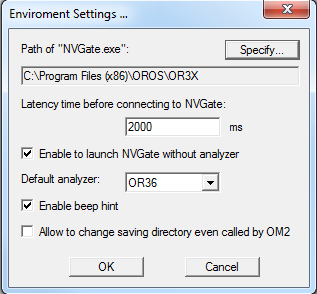
If necessary, you may need to set the environment parameters of DAQ by the menu of ’Operation’->’Environment setting’. Please refer to the online help of DAQ for more details
Note that for acquisition with several synchronized analyzers, NVGate V10 minimum is required.
Acquisition control
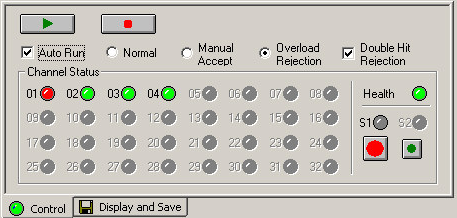
Control Panel->Control: press
to begin the measurement,
to pause, and
to stop. If the ’Auto Run’ option is checked, the measurement sets will be executed automatically one by one, you don’t need to press the button
after one measurement set is finished. ’Normal’, ’Manual Accept’ and ’Overload Rejection’ are different modes to accept the triggered data. You can also set ’Double Hit Rejection’ to reject the continuous hits when performing a hammer impact test to get better measurement quality.
When the acquisition is completed, press the button of
or
to transfer the data to the Modal main interface and start the modal identification.
Signal processing
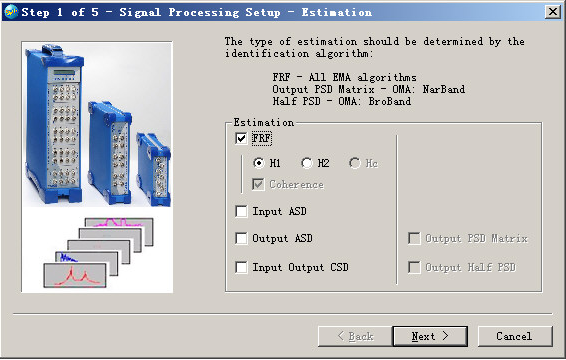
Signal processing wizard is designed to set the parameters for signal processing. Many signal estimations can be realized, such as power spectrum estimation, multiple input multiple output frequency response function estimation, and coherence function estimation, and so on. Five steps should be performed in this wizard: [file://mk:@MSITStore:C:\Program%20Files%20(x86)\OROS\NVSolutions\OROS%20Modal%202%20V5.1\OROSModal.chm::/On-line%20Help/Chapter%203/Chapter%203.2/Chapter%203.2.1.htm Estimation], [file://mk:@MSITStore:C:\Program%20Files%20(x86)\OROS\NVSolutions\OROS%20Modal%202%20V5.1\OROSModal.chm::/On-line%20Help/Chapter%203/Chapter%203.2/Chapter%203.2.2.htm Detrending], [file://mk:@MSITStore:C:\Program%20Files%20(x86)\OROS\NVSolutions\OROS%20Modal%202%20V5.1\OROSModal.chm::/On-line%20Help/Chapter%203/Chapter%203.2/Chapter%203.2.3.htm Decimation], [file://mk:@MSITStore:C:\Program%20Files%20(x86)\OROS\NVSolutions\OROS%20Modal%202%20V5.1\OROSModal.chm::/On-line%20Help/Chapter%203/Chapter%203.2/Chapter%203.2.4.htm Fast Fourier Transform (FFT)], and [file://mk:@MSITStore:C:\Program%20Files%20(x86)\OROS\NVSolutions\OROS%20Modal%202%20V5.1\OROSModal.chm::/On-line%20Help/Chapter%203/Chapter%203.2/Chapter%203.2.5.htm Windowing].
Estimation
Various signal estimation process can be set in this page. You must estimate the ’FRF’ if you want to perform modal parameters identification in the case of EMA. H1,H2 and Hc are three different methods for FRF estimation. Reference signal is needed for Hc method. You must estimate the ’Output PSD Matrix’(for OMA NarBand Full) or ’Output half PSD’(for OMA BroBand, OMA NarBand Half, and so on) if you want to perform modal parameters identification in the case of OMA.
The next step of signal processing wizard is [file://mk:@MSITStore:C:\Program%20Files%20(x86)\OROS\NVSolutions\OROS%20Modal%202%20V5.1\OROSModal.chm::/On-line%20Help/Chapter%203/Chapter%203.2/Chapter%203.2.2.htm Detrending].
Detrending
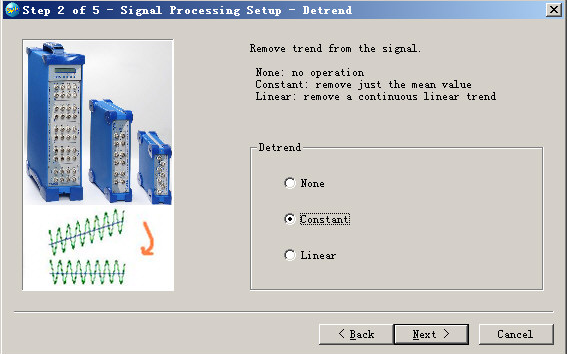
The purpose of detrending is to condition the time domain signals, remove their constant or linear trend.
The previous step of signal processing wizard is [file://mk:@MSITStore:C:\Program%20Files%20(x86)\OROS\NVSolutions\OROS%20Modal%202%20V5.1\OROSModal.chm::/On-line%20Help/Chapter%203/Chapter%203.2/Chapter%203.2.1.htm Estimation], and the next step is [file://mk:@MSITStore:C:\Program%20Files%20(x86)\OROS\NVSolutions\OROS%20Modal%202%20V5.1\OROSModal.chm::/On-line%20Help/Chapter%203/Chapter%203.2/Chapter%203.2.3.htm Decimation].
Decimation
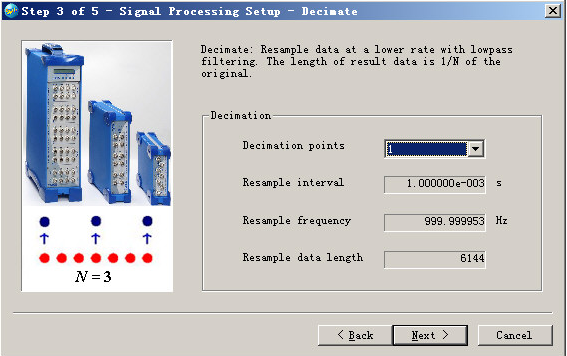
The purpose of decimation is to reduce the range of analysis frequency. For example, you are interest in the frequency range of 0~10 Hz, and the sampling frequency is 256 Hz, then you should set the decimation points to 10.
The basic principle of decimation is reserve part of points and removing the others: if the decimation points is N, the length of data will be 1/N of original data. To prevent the estimation from frequency aliasing, a low-pass filter is necessary in this process.
There are not any anti-aliasing filters in some low-cost data acquisition. It will greatly improve the quality of estimation for you to sample data with high frequency and then decimate them in Modal, partly compensating for the loss of anti-aliasing filters.
The previous step of signal processing wizard is [file://mk:@MSITStore:C:\Program%20Files%20(x86)\OROS\NVSolutions\OROS%20Modal%202%20V5.1\OROSModal.chm::/On-line%20Help/Chapter%203/Chapter%203.2/Chapter%203.2.2.htm Detrending], and the next step is [file://mk:@MSITStore:C:\Program%20Files%20(x86)\OROS\NVSolutions\OROS%20Modal%202%20V5.1\OROSModal.chm::/On-line%20Help/Chapter%203/Chapter%203.2/Chapter%203.2.4.htm setup of FFT].
Setup of FTT
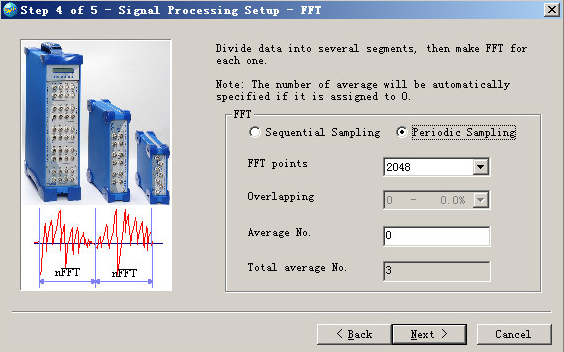
In this page, parameters for fast Fourier transform (FFT) will be set to transfer the time domain signals to frequency domain.
’Sequential Sampling’ means that the data was sampled sequentially, without any pause. A typical instance is to sample data sequentially under random excitation. "Periodic Sampling’ means that the data in the file was sampled periodically. A typical instance is to sample multiple frames of data in a hammer impact test, for the sake of performing average in the spectrum estimation. The practical significance of "Periodic Sampling" is the overlap percent is set to zero in FFT.
’FFT Points’ specifies the length of each segment in the transform. The optional list will be confirmed by the software according to the length of imported data automatically. You can select one from this list. When the data points has less than ’FFT points’, zeros will be padded, and truncated if it has more.
’Overlapping’ specifies the percent of overlap between each segment. The purpose of overlap is to increase the times of average. For an example of 2048 data length and 1024 FFT points, if the overlap percent is set to 0, the original data can be divided into two segments for FFT (the first segment is from 1 to 1024, and the second part is from 1025 to 2048); When the overlap percent is set to 50%, the number of overlap points is 512, and the original data can be divided into three segments (the first segment is from 1 to 1024, and the second segment is from 513 to 1536, and the third segment is from 1025 to 2048).
’Average No.’ specifies the number of average during the FFT calculation. Its default value is 0, which means the maximum possible average numbers. When the number specified by the user is larger than the maximum average number, it will be modified to the maximum average number automatically
The previous step of signal processing wizard is [file://mk:@MSITStore:C:\Program%20Files%20(x86)\OROS\NVSolutions\OROS%20Modal%202%20V5.1\OROSModal.chm::/On-line%20Help/Chapter%203/Chapter%203.2/Chapter%203.2.3.htm decimation], and the next step is [file://mk:@MSITStore:C:\Program%20Files%20(x86)\OROS\NVSolutions\OROS%20Modal%202%20V5.1\OROSModal.chm::/On-line%20Help/Chapter%203/Chapter%203.2/Chapter%203.2.5.htm windowing].
Windowing
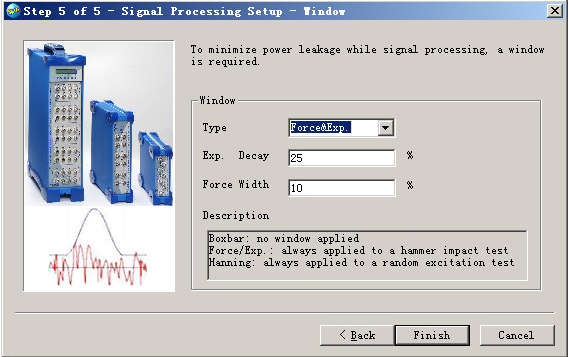
You can specify the windowing functions for the FFT in this page. The truncation and non-periodicity of signal will cause energy leakage and lead to alias error in the frequency domain. The main purpose of windowing is adding time weight functions to the signal to filter the non-periodicity part and reduce leakage. Six kind of window function such as Boxcar, Exponential, Force & Exponential, Hanning, Hamming, Flattop is provided and can be employed for different cases.
Boxcar
Boxcar window, called as Transient window also, has the shape of rectangle. It adds the same weight to all parts of the time history, i.e. no weight is added.
The Boxcar function has a value of 1 over its length and it only truncation the signal simply. It can be applied to the signal such as periodic (period random) and transient (Chirp, Burst Chirp) signal generally.
Exponential
The shape of the exponential window is that of a decaying exponential. By assigning the time const, the exponential window damps the signal, ensuring that the signal fully decays by the end of the sample block.
Exponential function can be applied commonly to the measurement of light damping system.
The following equation defines the exponential window:
W(t)=e-βt
Where β is a constant. In Modal, Td is defined as the exponential decay time over which exponential window function decays from 1 to 1/e, in this case , β=1/ Td. When applying exponential function to a signal, damping of the system will be increased and should be modified. The damping ratios and frequencies can be automatically modified in Modal if the exponential window is applied by the signal processing wizard. When the input data is FRFs which were estimated by applying exponential window, you should remember to specify the decay time (with unit of ms) in the configuration file.
Note: The value you should fill in this interface is not β, but the percentage of β constitutes to the sampling period.
Force & Exponential
In a force window, the front part of the signal is preserved and the others are set to 0. The time length of the preserved signal is named force width. When Force & Exponential window is selected, exponential window is applied to both channels while force window is only applied to the reference channel.
Force window is very useful for the hammer impact test and it can wipe off the fluctuation of the force signal and greatly improve SNR (Signal Noise Ratio).
Note: You should fill the percentage of these values constitute to the sampling period as well.
Hanning
Hanning window is also named random window and has a shape similar to that of half a cycle of a cosine wave. It decays the start and end part of the signal and enforce the signal to become periodic.
It is a general-purpose window and its typically applied to the test excited by random noise.
Hamming
Hamming window is similar to Hanning window and it can further decrease the side lobe.
Flattop
Namely cosine window, the flattop has the flatness power shape and the higher amplitude accuracy while poor frequency resolution.
The flattop window is most useful in accurately measuring the amplitude of specified frequency components such as filter characters.
This is the last step of the signal processing wizard, and the previous step is [file://mk:@MSITStore:C:\Program%20Files%20(x86)\OROS\NVSolutions\OROS%20Modal%202%20V5.1\OROSModal.chm::/On-line%20Help/Chapter%203/Chapter%203.2/Chapter%203.2.4.htm setup of FFT]. Press the ’Finish’ button to confirm all the parameters set in the wizard, and you can begin to [file://mk:@MSITStore:C:\Program%20Files%20(x86)\OROS\NVSolutions\OROS%20Modal%202%20V5.1\OROSModal.chm::/On-line%20Help/Chapter%203/Chapter%203.2/Chapter%203.2.htm signal processing] now.
The sampling times can be set to 2.56 or 2. Usually in an EMA analysis it is set to 2.56, and in an OMA analysis it is set to 2. If the sampling times is 2.56, then the number of the spectral line will be 1/2.56 of the FFT length, and the analysis frequency range will be 1/2.56 of the sampling frequency. If the sampling times is 2, then the number of the spectral line will be half of the FFT length, and the analysis frequency range will be half of the sampling frequency.
After signal processing, the result data will be displayed under the directory of ’Data\Setup?\Estimate" in the ’Data’ page of workspace short pane, such as FRF (frequency response function), COH (coherence function), Pxx (input auto power spectral density function), Pyy (output auto power spectral density function), Pxy (input and output cross power spectral density function), OPSD (output power spectral density matrix) and HPSD (half power spectral density function). Double click these items, and relevant curves or lists will be displayed in the main window.
If you want to do signal processing with other parameters, please run the wizard and process again. Before the new signal processing, all the result got from last signal processing will be refreshed or deleted automatically.
ODS & Modal Analysis
Modal can deal with Operating Deflection Shape (ODS) Analysis and two types of modal analysis: Experimental Modal Analysis (EMA, both input and output data are available) and Operational Modal Analysis (OMA, only output data are available).
You can find out how a machine or structure moves during its operation via ODS, which shows the overall dynamic characters of the structure or machine.
You can get the modal parameters of structures via EMA or OMA, by performing the following four steps: (1)Signal processing to get frequency response functions (for EMA) or output power spectrum matrices (for OMA); (2) Selecting an appropriate identification algorithm;(3)Doing modal identification; (4) Operating the identification results, such as viewing mode shapes, copying, and removing, and so on.
Almost all the algorithms begin with the Modal Indicator Function (MIF). Click [file://mk:@MSITStore:C:\Program%20Files%20(x86)\OROS\NVSolutions\OROS%20Modal%202%20V5.1\OROSModal.chm::/On-line%20Help/Chapter%203/Chapter%203.3/Chapter%203.3.1.htm here] to familiarize its characteristics.
The following modules are available in Modal: [file://mk:@MSITStore:C:\Program%20Files%20(x86)\OROS\NVSolutions\OROS%20Modal%202%20V5.1\OROSModal.chm::/On-line%20Help/Chapter%203/Chapter%203.3/Chapter%203.3.2.htm TD ODS], [file://mk:@MSITStore:C:\Program%20Files%20(x86)\OROS\NVSolutions\OROS%20Modal%202%20V5.1\OROSModal.chm::/On-line%20Help/Chapter%203/Chapter%203.3/Chapter%203.3.3.htm FD ODS], [file://mk:@MSITStore:C:\Program%20Files%20(x86)\OROS\NVSolutions\OROS%20Modal%202%20V5.1\OROSModal.chm::/On-line%20Help/Chapter%203/Chapter%203.3/Chapter%203.3.4.htm EMA Narband (CMIF)], [file://mk:@MSITStore:C:\Program%20Files%20(x86)\OROS\NVSolutions\OROS%20Modal%202%20V5.1\OROSModal.chm::/On-line%20Help/Chapter%203/Chapter%203.3/Chapter%203.3.5.htm EMA SelBand-SIMO (RFOP)], [file://mk:@MSITStore:C:\Program%20Files%20(x86)\OROS\NVSolutions\OROS%20Modal%202%20V5.1\OROSModal.chm::/On-line%20Help/Chapter%203/Chapter%203.3/Chapter%203.3.6.htm EMA SelBand-MIMO 1 (FDPR)], [file://mk:@MSITStore:C:\Program%20Files%20(x86)\OROS\NVSolutions\OROS%20Modal%202%20V5.1\OROSModal.chm::/On-line%20Help/Chapter%203/Chapter%203.3/Chapter%203.3.7.htm EMA SelBand MIMO 2 (RFPM)], [file://mk:@MSITStore:C:\Program%20Files%20(x86)\OROS\NVSolutions\OROS%20Modal%202%20V5.1\OROSModal.chm::/On-line%20Help/Chapter%203/Chapter%203.3/Chapter%203.3.8.htm EMA BroBand (BBFD)], [file://mk:@MSITStore:C:\Program%20Files%20(x86)\OROS\NVSolutions\OROS%20Modal%202%20V5.1\OROSModal.chm::/On-line%20Help/Chapter%203/Chapter%203.3/Chapter%203.3.9.htm OMA NarBand Full (FSDD)], [file://mk:@MSITStore:C:\Program%20Files%20(x86)\OROS\NVSolutions\OROS%20Modal%202%20V5.1\OROSModal.chm::/On-line%20Help/Chapter%203/Chapter%203.3/Chapter%203.3.4.htm OMA NarBand Half (CMIF)], and [file://mk:@MSITStore:C:\Program%20Files%20(x86)\OROS\NVSolutions\OROS%20Modal%202%20V5.1\OROSModal.chm::/On-line%20Help/Chapter%203/Chapter%203.3/Chapter%203.3.10.htm OMA BroBand (OBFD)]. A NarBand method means an algorithm performed in a narrow frequency band, who has the biggest advantage of simple and easy to use. You can identify the modes only by picking the peaks of MIF one by one. A SelBand method means an algorithm performed in one or several selected frequency bands. A BroBand method means an algorithm performed in a broad frequency band or even the full frequency band sometimes.
An effective tool [file://mk:@MSITStore:C:\Program%20Files%20(x86)\OROS\NVSolutions\OROS%20Modal%202%20V5.1\OROSModal.chm::/On-line%20Help/Chapter%203/Chapter%203.3/Chapter%203.3.11.htm Modal Assurance Criterion (MAC)] is also provided to validate the result of modal identification.
Modal Analaysis process illustration
Selecting an Algorithm
Before modal identification, you should select an appropriate algorithm according to the analysis type (EMA or OMA) and number of input (SIMO or MIMO). You can select the specified algorithm by mouse click on the corresponding item in the "Workspace" shortcut pane. A message will appear if you success in doing this.
Another appropriate algorithm can be selected for necessary. And you can compare the results from different algorithms. If some selected algorithm is not fit for the current case, you will be prompted to select another one.
Doing Modal Identification
It’s recommended to employ the modal indicator function (MIF) for the modal identification in the frequency domain. The identification process varies according to different type of algorithms.
- Narrow-Band Identification Algorithm
(1) Open the MIF curves interface by pressing the
button in the toolbar, and the following interface will appear:
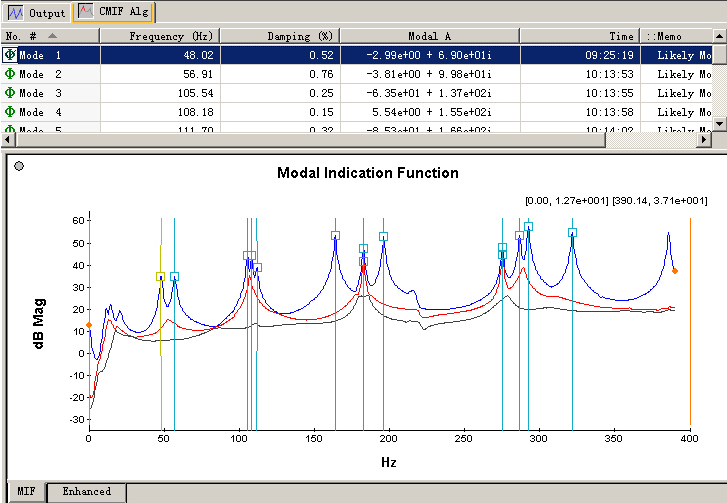
The interface consists of two mode list views and a tab window view (’MIF’ tab and ’Enhanced’ tab ). The two mode list view is synchronous. You can adjust the separator lines to resize these views.
(2) Press the
button in the toolbar to begin the NarBand modal identification.
(3) Check the identified results and curve fitting of enhanced curves. All the identified modes will be shown in the two mode list views and output shortcut pane. You can check the relevant enhanced curves and its curve fitting in each setup for each mode. If ideal curve fitting hasn’t been got, you can adjust the fitting band manually, and identify this mode again in the current setup by double clicks.
- Select-Band Identification Algorithm
(1) Open the MIF curves interface by pressing the
button in the toolbar.
(2) Select the identification frequency band. Move the cursors by mouse or keyboard to the frequency point you want, then double click the mouse or press Enter key to select this band. As a result, a tag like "[-]" appears to indicate this selected band. The data in this band will be used for modal identification. Multiple selected bands for the identification are allowed in Modal, and all the data in these bands will be used to identify modal parameters. To delete the latest selected band, you can use the
button in the toolbar, or by the mouse’s middle click. To delete all the selected bands, you can use the
button in the toolbar, or by the mouse’s middle double clicks.
(3) Specify the modal order in the selected bands. MIF plot can be used to indicate the modes existence efficiently. A peak in this plot means a mode. For example, in the selected band of the following figure, four modes are detected, including two heavily closed modes.
(4) Press the
button in the toolbar to begin modal identification with selected algorithm.
(5) Check the results. The synthesized FRF/HPSD curves will appear in the main window after identification, and the result will be shown in the output shortcut pane. At the same time, an item corresponding to the selected identification algorithm will appear under the directory of ’Data\Setup1\Mode’ in the workspace shortcut pane.
Double click on this item will show the identified mode list.
3. Broad-Band Identification Algorithm
The process of Broad-Band algorithms is almost the same with Select-Band algorithms, only that broader or even full frequency band can be set for the Broad-Band identification.
Operating the Results
Detailed information on identified modal frequencies, damping ratios, identification time, if structural mode are displayed in the mode list view. You can sort the modes ascending or descending according to the specified keyword by clicking on this column header. Also you can do many other operations by the toolbar or right click popup menu, such as deleting modes, copying modes, viewing the mode shapes, exporting the modes, and so on.
You can also double click on the icon of ’’ in the front of each row to view the mode shape animations. The mode shape animations are an import criterion of modal identification.
Modal Indicator Function (MIF)
A very important step of modal identification is to determine how many modes are contained in a selected frequency band. MIF plot is a very good tool to achieve this, indicating the modes efficiently.
MIF can be employed in not only EMA, but also OMA. The number of MIFs equals the number of excitations or references. The MIFs consist of the singular values of frequency response function matrix (FRF), output power spectral density matrix (OPSD), or half power spectral density matrix (HPSD).
By the powerful singular value decomposition, the real signal space is separated from the noise space. Therefore, the MIFs exhibit the modes effectively. A peak in the MIFs plot usually indicate the existence of a structural mode, and two peaks at a same frequency point means the existence of two repeated modes. Moreover, the magnitude of the MIFs always implies the strength of a mode.
Sometimes we should note the cross modes, for example
As showed in the above figure, the peak in the second MIF curve doesn’t indicate a mode. It’s formed by the cross of two modes.
Operating Deflection Shape
Time domain ODS
With Modal, you can animate time domain ODS directly from multi-channel data that was acquired spatially from a machine or structure. This is done by sweeping a cursor through a set of time histories. You can stop the animation, back it up, and play it forward to observe in slow motion vibration phenomena that may have taken place very quickly.
Frequency Domain ODS
With Modal, you can animate frequency domain ODS directly from data that was acquired spatially from a machine or structure. This is done by sweeping a cursor through a set of frequency domain measurements, or dwelling at a specific frequency. A FD ODS allows you to see how a structure behaves at a single frequency.
Modal Analysis
Modal identification methods
Modal analysis can be conducted via artificial excitation, e.g. shaker or instrument hammer excitation, and input force and output responses are measured. That is normally called an Experimental Modal Analysis (EMA). Modal analysis can be also accomplished during operational conditions of a mechanical structure via responses measurements due to ambient or natural excitation, or other excitation but without input force measurements. This is called as Operational Modal Analysis (OMA).
Modal identification algorithms can generally be divided into 2 categories: Time domain (TD) techniques and frequency domain (FD) techniques. TD modal identification has the advantage of estimation of all the modes in the frequency band of interests at once. However, all the TD modal identification algorithms have common unfavorable feature, difficulty to distinguish physical (structural) modes from computational (noise) modes. For application to real-world structure, to locate structural modes reliably is the most important task of a modal analysis. This is why only FD techniques are implemented in OM2.
| EMA | OMA |
EMA approach can be divided into three levels based on Single Input Single Output (SISO), Single Input Multiple Outputs (SIMO), Multiple Input Multiple Outputs (MIMO). Modal is born in MIMO. However, SIMO algorithm is also implemented for preliminary application. MIMO EMA has important advantages: not only consistent results can be obtained, but close spaced and even repeated modes can be identified. A modal Indication function (MIF) is calculated via Singular-Value-Decomposition (SVD) of the frequency Response Functions. |
OMA is a powerful tool to extract dynamic characteristics of real world structure from output-only measurements during operational conditions. The output response can be generated by ambient or natural excitation as well as artificial broadband excitation (but without input force measurements). A modal Indication function (MIF) is calculated via Singular-Value-Decomposition of Power Spectrum Density (PSD) matrix or Half Power Spectrum Density (HPSD) matrix. |
| OMA Narband Full | |
Narrow-band operational modal identification algorithm in frequency domain.
| |
| EMA Narband | OMA Narband Half |
Narrow-band MIMO modal identification algorithm.
|
Narrow-band MIMO modal identification algorithm.
|
| EMA Selband SIMO | |
Selected-band SIMO modal identification technique, suitable for the modal test with only one excitation or one reference, e.g., a single shaker or single reference for impact tests.
|
|
| EMA Selband MIMO1 | |
Selected-band MIMO modal identification technique.
|
|
| EMA Selband MIMO2 | |
Selected-band MIMO modal identification technique.
|
|
| EMA Broadband | OMA Broadband |
Broad-band MIMO modal identification technique.
|
Broad-band operational modal identification technique.
|
Narband (CMIF)
Complex Mode Indicator Function (CMIF), is an narrow band modal identification algorithm in the frequency domain. CMIF an easy-to-use method. You should use it as the following steps:
Selecting a Peak
Press the button
in the toolbar, and click the MIF plot to activate it. A red cross marker ’十’ will appear, who is able to find the local peak automatically. The index and coordinate value of the marker are shown in the top left corner of MIF graph. In the figure below, (99,1):[47.85,3.48e+001] means that the cross cursor is now at the 99th point of the first MIF curve, and the coordinate is (47.85, 34.8).
Auto Identification
After selecting the peak, you should double click to finish this identification. The identified results will be shown in the MIF plot, mode list and output shortcut pane. Each identified mode will be marker with a shape symbol. Its middle pane indicates the position of peak, and the line points to the identified frequency. The mode selected in the mode list will be marked yellow in the MIF plot while the others are blue.
Checking curve fitting and Refitting
You can check the quality of curve fitting by selecting some mode in the mode list and then turning to the ’Enhanced’ tab page. Seen from below, the blue one is the enhanced FRF curve, and the red one is its fitting curve. Sometimes the identification result is not good because of the automatically selected band is not the best. Thus you can move the two cursors to select a better band, then double click to identify this mode again.
Selband SIMO (RFOP)
Rational Fraction Orthogonal Polynomials (RFOP), is an SIMO modal identification algorithm in the frequency domain. It is suitable for cases with only one excitation or one reference. RFOP can fit the FRFs or HPSDs in a fairy broad frequency band.
Each parameter is defined as the following:
Input Number
Number of excitations or references. It is automatically displayed by the software, and can only be 1 in the RFOP algorithm.
Output Number
Number of excitations or non-references. It is automatically displayed by the software.
Denominator Order
Rational fraction math model is used in the RFOP algorithm, and the order of denominator is twice of the modal order in the selected frequency band. Generally you can confirm the modal order by the MIF plot. In some cases, the modal order should be increased properly to hold the noisy modes, and the noise modes can be deleted by the criterion on damping ratios and mode shapes.
Modal Order
This parameter varies with the denominator order you set. You should ensure that this value equal or larger than the real modal order in the selected frequency band.
Numerator Order
This parameter varies with the denominator order you set, and keeping equal to it. You are allowed to set this value individually to be larger than the denominator order, for the sake of compensating for the out-band modes.
Selband MIMO1
Frequency Domain Poly-reference (FDPR), is a MIMO modal identification algorithm in the frequency domain. It is suitable for cases with multiple excitations or multiple references. FDPR usually fits the FRFs or HPSDs in a narrow frequency band. The outstanding advantage of FDPR is its highly easy-to-use.
Besides the MIF plot, two another bar graphs are provided for you to confirm the modal order in the selected frequency band according to the bars’ height. The upper graph shows the relative height of each mode, and it indicates the first four modes are greater than others. The lower graph shows the ratio of previous mode vs. next mode. You will find the fourth one is extremely high. It means that there are 4 structural modes, and the rest are ’noisy modes". So, here you should specify the system order to 4.
Each parameter is defined as the following:
Number of Bars
Number of bars shown in the graph, default as 10. The minimum value of this parameter is 2, and the maximum value is the output number of FRFs. You can change this value to view the bas more clearly.
Order of System
Modal order in the selected frequency band. Generally a fairy good value will be automatically set according to the practice. You are also allowed to change this value to get better result.
EMA Selband MIMO2
Rational Fraction Orthogonal Polynomials for MIMO (RFPM), is a MIMO modal identification algorithm in the frequency domain. It is suitable for cases with multiple excitations or multiple references. RFPM can fit the FRFs or HPSDs in a fairy broad frequency band.
Each parameter is defined as the following:
Input Number
Number of excitations or references. It is automatically displayed by the software.
Output Number
Number of excitations or non-references. It is automatically displayed by the software.
Denominator Order
Matrix form fractional fraction math model is used in the RFPM algorithm, and the order of denominator is related with the modal order in the selected frequency band. Generally you can confirm the modal order by the MIF plot. The product of denominator order and input number should be larger than twice of the modal order. When the product of denominator order and input number is larger than the twice of the modal order, noisy modes will be identified, which can be deleted by the criterion on damping ratios and mode shapes.
Modal Order
This parameter varies with the denominator order you set. You should ensure that this value equal or larger than the real modal order in the selected frequency band.
Numerator Order
This parameter varies with the denominator order you set, and keeping equal to it. You are allowed to set this value individually to be larger than the denominator order, for the sake of compensating for the out-band modes.
EMA Broadband (BBFD)
The BroBand modal identification module is based on the algorithm of Polyreference Least Squares Complex Frequency (p-LSCF), developed in 2003. p-LSCF is a frequency MIMO modal identification algorithm which has superior performance compared to most time domain MIMO techniques, such as Polyreference Least Squares Complex Exponential (PRCE or LSCE), Extended Ibrahim Time Domain (EITD), and Eigensystem Realization Algorithm(ERA). BroBand EMA makes use of measured Frequency Response Function (FRF) as source data.
Features/Advantages of EMA Broband
EMA BroBand does not suffer from numerical problems, i.e. ill-conditioning problem in computing poles of the system in broadband as most frequency domain modal identification algorithm, e.g. Rational Fraction Orthogonal Polynomial (RFOP) and Frequency Domain Polyreference (FDPR), encountered. Compared to SelBand techniques, BroBand can then be applied to identify all the modes in a wide, including full, frequency band of interest at one time.
Compared to most time domain modal identification techniques, such as well know Polyreference (or Least Squares) Complex Exponential (PRCE, or LSCE) technique, :BroBand yields extremely clear stability diagram, making it much easier to select structural modes, or the physical poles, from which modal frequencies and damping ratios can be readily obtained.
The BroBand modular in OM2 has the feature of automatic modal sorting capability, i.e. BroBand can automatically distinguish structural modes from "noise" modes, or real modes from spurious modes.
Main Procedures for EMA BroBand
Major procedures for modal identification with EMA Broband are as follows:
- Select a frequency band
The EMA Broband can be used to identify all modes in a broad frequency band, including full band. However, frequency band selection may be advantageous and is suggested in the cases as:
- In the "soft" suspension of test article to simulate free-free boundary condition, so called "rigid-body modes" are sometime weakly excited in low frequency range. In this case, frequency band selection excluding this low frequency range is suggested for identification of flexible structural modes. The "rigid-body modes" can also be obtained with selection of corresponding low frequency band.
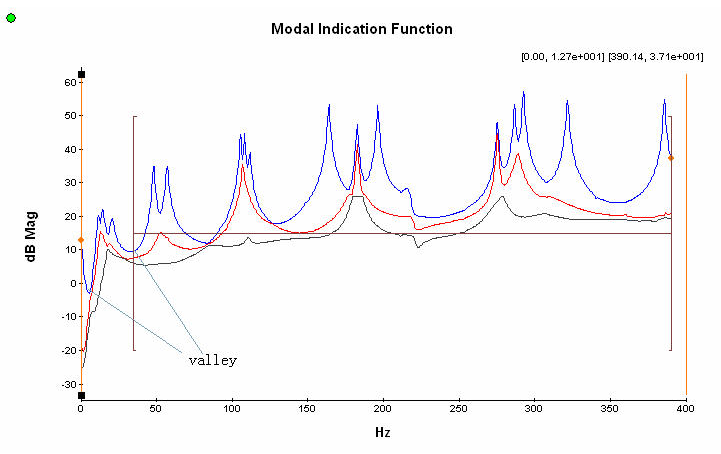
- A structure under testing sometimes shows "strong mode" or "global modes" in specific frequency band, and "weak modes", or "local modes" in other frequency band. These "strong/global modes" and "weak/local modes" can be easily observed from Modal Indication Function (MIF) plot based on height of the MIF peaks. In this case, it is suggested to divide the full band into few sub-band which cover "strong/global modes" and "weak/local modes", respectively.
- It is suggested to start the frequency band from a valley of the MIF plots, and end the band at a valley too. According to our experience, such a frequency band can yield better result.
- Start Identification
Press the button of "Start Identification"
in the toolbar to start modal identification.
- Modal Order determination
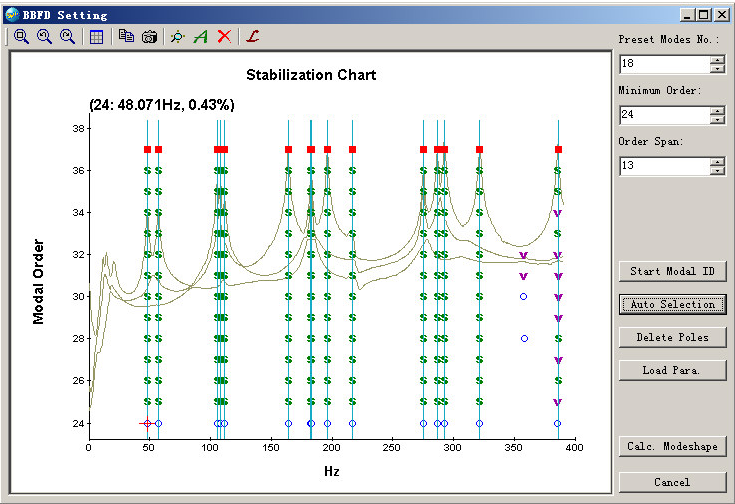
Preliminary determination of the number of modes in the selected frequency band according to the MIF plot, and fill it in the edit box of "Preset Modes No." Then the BroBand software will calculate a default "minimum order" according to this number. The relationship between "Preset Modes No." and "Minimum Order" is: minimum order = (preset modes No)*Ni/2, where Ni means the number of input.
Change the number of "Order Span" if necessary. The BroBand software will estimate the poles with a range of system order from "Minimum Order" to "Maximum Order", where Maximum order= Minimum order + Order Span-1. The default order span is 12.
"Start Modal ID"
Press the button of "Start Modal ID" or
to obtain frequency stability diagram. This operation might take a little longer time to finish a complex structure with large number of modes and measurement coordinates. In the stability diagram, a shape symbol represents one pole. A pole in this diagram may represent a physical (i.e. structural) mode or a spurious (or noise) mode. It is normally not difficult to distinguish physical/structural) mode from spurious/noise mode by the distribution of poles. Generally speaking, a physical/structural mode can be identified in each proper number of orders, while for a spurious/noise pole it usually is not the case. There are five kinds of symbols to indicate the poles:
| Symbol | Description |
| o | The pole is not stable. (The poles obtained from the first order are always considered as unstable.) |
| f | The frequency of the pole does not change within the tolerance of 1%. |
| v | The frequency of the pole does not change within the tolerance of 1%, and the pole vector does not change within the tolerance of 10%. |
| d | The frequency of the pole does not change within the tolerance of 1%, and the damping of the pole does not change within the tolerance of 10%. |
| s | Both frequency, damping and vector are stable within the tolerances: the frequency of the pole does not change within the tolerance of 1%; the pole vector does not change within the tolerance of 10%; and the damping of the pole does not change within the tolerance of 10%. |
- "Auto Selection" of structural modes
Press the button of "Auto Selection" or
, the OM2 selects the physical/structural modes automatically. While move the mouse cursor on a pole, the modal frequency and damping ratio corresponding to this pole will be shown. You can move the mouse on different poles to check the stability via small change of the modal frequency and/or damping ratio.
You can zoom in to check part of the stabilization diagram by click and drag a rectangle with the mouse.
- Manually selection of physical/structural poles
A pole can also be manually selected by clicking it or deselected it by same operation. A selected pole will be marked with a shape symbol
.
- Mode shape calculation
Press the button of "Calc. Modeshape" to confirm the pole section and BroBand software start to estimate the mode shapes and to calculate the synthesized FRFs.
- Inspection of identified modal parameters
Open the view of mode list. Yyou can check the identified result here: modal frequencies, damping ratios, modal A, modal B, and mode shape animations.
- Continue modal identification in another frequency band
If more than one frequency band is selected, returning to the MIF plot window, and repeat the above operations. The result obtained from previous modal identification can also be loaded by pressing the button of "Load Para.".
On the Toolbar of "BBFD Setting" Diagram
| Display the full band of current curve | |
| Back to previous display range | |
| Go to next display range | |
| Show or hide the graph grid | |
| Copy contents in current main window to the clipboard | |
| Save current snapshot to BMP or JPG | |
| Start modal identification to gain poles | |
| Select the structural poles automatically | |
| Delete all the selected poles | |
| Load the parameters (poles, selected poles, frequency band) of previous modal identification |
Modal validation, MAC & COMAC
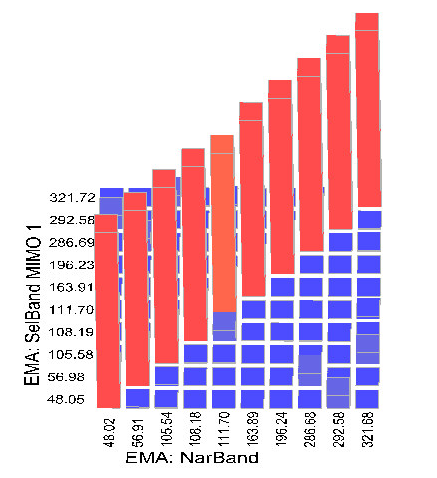
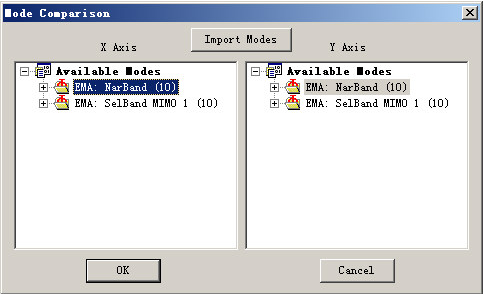
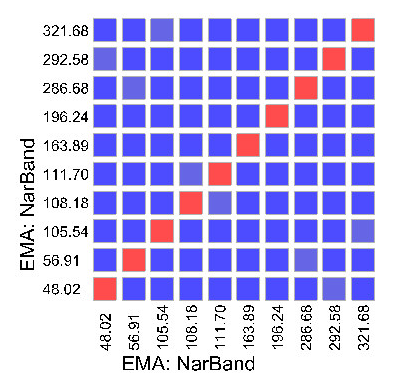
Modal Assurance Criterion (MAC) values can be used to compare two arbitrary complex vectors. The MAC value between two vectors who have linear relationship is near to one. The MAC value between two linearly independent vectors will be near zero. MAC calculation has two applications in the modal analysis.
First, it can be used to compare two mode shapes obtained from two different modal parameter estimation processes on the same test data. Two similar mode shapes have a high MAC value, and two same mode shapes have a MAC value of 1.
Second, it can be used to check the orthogonality of mode shapes when weighted by the mass matrix. Even when no exact mass matrix is available, the orthogonality of mode shapes is approximately satisfied. We can use it to validate the modal result.
The MAC value table can also be showed by the right click popup menu.
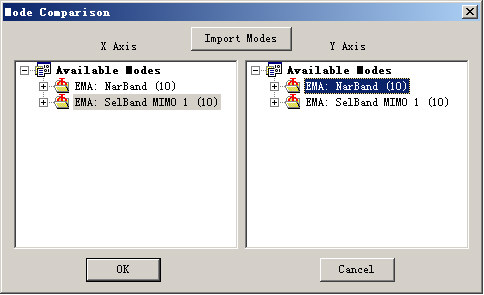
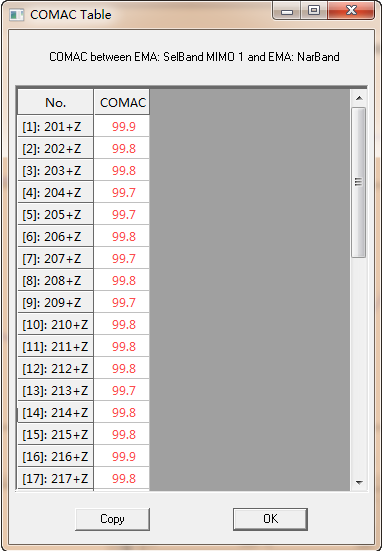
Coordinate Modal Assurance Criterion (COMAC) is an extension of Modal Assurance Criterion (MAC). COMAC attempts to identify which measurement degrees of freedom contribute negatively to a low value of MAC. COMAC is calculated over a set of mode pairs, analytical versus analytical, experimental versus experimental or experimental versus analytical. In Modal, COMAC between modes from different identification algorithms or imported modes can be calculated.
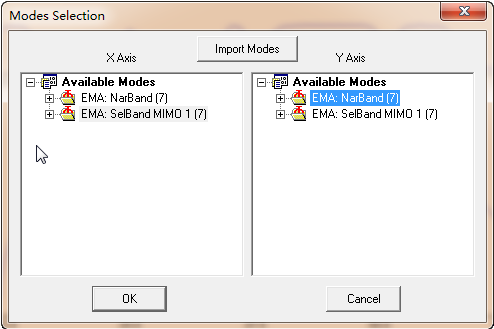
To calculate COMAC, the first step is to set the two sets of modes you want to be compared.
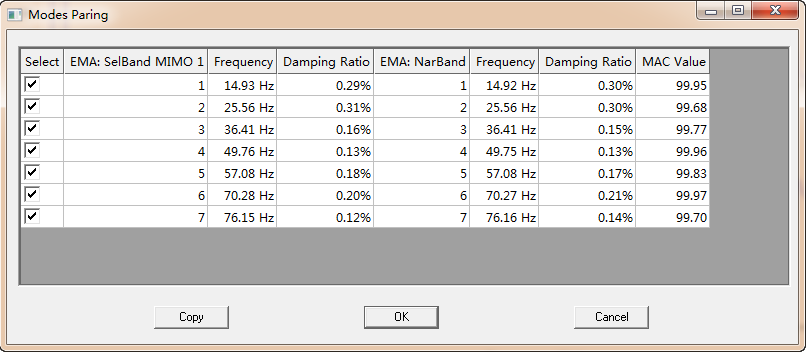
In the second step, the mode pairs should be determined. The process of modes paring will be done by Modal automatically, according to the MAC values between each modes in the two sets. You are also allowed to select part of the mode pairs.
Then the COMAC values table will be displayed.
Import / Export
Data and all kinds of results can be exported or printed, which provides you great convenience to write a report or give a presentation. These functions include: [file://mk:@MSITStore:C:\Program%20Files%20(x86)\OROS\NVSolutions\OROS%20Modal%202%20V5.1\OROSModal.chm::/On-line%20Help/Chapter%203/Chapter%203.4/Chapter%203.4.1.htm Importing data], [file://mk:@MSITStore:C:\Program%20Files%20(x86)\OROS\NVSolutions\OROS%20Modal%202%20V5.1\OROSModal.chm::/On-line%20Help/Chapter%203/Chapter%203.4/Chapter%203.4.2.htm exporting data], [file://mk:@MSITStore:C:\Program%20Files%20(x86)\OROS\NVSolutions\OROS%20Modal%202%20V5.1\OROSModal.chm::/On-line%20Help/Chapter%203/Chapter%203.4/Chapter%203.4.3.htm exporting tables], [file://mk:@MSITStore:C:\Program%20Files%20(x86)\OROS\NVSolutions\OROS%20Modal%202%20V5.1\OROSModal.chm::/On-line%20Help/Chapter%203/Chapter%203.4/Chapter%203.4.4.htm export graphics], [file://mk:@MSITStore:C:\Program%20Files%20(x86)\OROS\NVSolutions\OROS%20Modal%202%20V5.1\OROSModal.chm::/On-line%20Help/Chapter%203/Chapter%203.4/Chapter%203.4.5.htm exporting animations], [file://mk:@MSITStore:C:\Program%20Files%20(x86)\OROS\NVSolutions\OROS%20Modal%202%20V5.1\OROSModal.chm::/On-line%20Help/Chapter%203/Chapter%203.4/Chapter%203.4.6.htm print preview and print].
Import
Geometry
You can import geometry information from UFF 15/82/2412 files and IGES files
Data Files
UFF
You can import measurement data in frequency domain (including Frequency Response Functions and Coherence Functions) or time domain (time histories) from the UFF 58/58b files.
- Response Type
The type of response to be imported. Generally we use accelerometers, so we specify the type as "Acceleration" here.
- Data Type
The type of data to be imported. There are three types here: 1) frequency response functions (and coherence functions) for EMA analysis, 2) time histories for EMA analysis, and 3) time histories for OMA analysis.
If FRFs which have been applied with exponential windows are to be imported, you need fill the content of "Exp. Window Coef." to modify the increasing damping caused by the exponential window.
If time histories are to be imported, you need specify the marker to distinguish excitation signal from response signal. Here you have two options: reference DOF (REFDOF) or the unit of Y Axis. When the marker is REFDOF, the measurement information of excitation signal should be defined in the field the reference node and direction. While the marker is the unit of Y Axis, software take the signal block with the unit you specified as excitation signal.
- Setup Name and UFF Data Files
Then you can specify or modify the "Setup Name" and "UFF data files" for each setup. The wildcards (’*’ or ’?’) is allowed to refer to multiple UFF files. If many files are included, you are recommended to use wildcards manually. The common definition of wildcards is employed: "*" to represent any multiple characters, and ’?’ to represent a single character. For example, the "*.unv" represents all the files whose extension names are "unv" in the same directory of this configuration file.
Note (very important): if you want to import time domain UFF data files for EMA, you’d better use the wildcard. You must put the measurement data of one test (for example, in the IMRT, one test means the measurement of one point) into one UFF file. If you have 20 nodes to measure in an IMRT, then you should have 20 UFF files, such as node01.uff, node02.uff, ... node20.uff. Here you can use "node*.uff" to import all the 20 files.
- Buttons
Press the "Add/Change" button to confirm this operation, then these data files information will be stored for the specified setup. For an EMA test, you are only allowed to have one setup, no matter whether it is time domain or frequency domain. For an OMA test, you are allowed to add more setups.
Press the "OK" button to write these information to the current configuration file, and the new configuration file will be automatically reloaded to import the data specified.
The following interface will appear after the importing:
You can check or change the information of imported data here, such as the response nodes and directions. You can also unselect the data you don’t like. Click the header of each column, the current list will be sorted. In the right of this dialog, two filters are set for convenience.
OROS Format
You can import measurement data in frequency domain ("*.res", including Frequency Response Functions and Coherence Functions) or time domain ("*.oxf" or "*.oxl", time histories) from the OROS format data files.
The interface for importing OROS format data files is very similar with the one for importing UFF data.
To import the FRFs and COHs from the OROS ".res" files, you don’t need to specify the the "Exp. Window Coef." . Because this information is included in the ".res" file, and will be read by OM2 automatically.
The data files of one modal test may be stored in many different directories, so in this interface you should specify the "Searching Directory", but not the name of files. OM2 will search data files in the specified directory and all its subdirectories.
The same interface which allows you to check and change the information of imported data will appear after the configuration file is reloaded.
Equations
You can import the constrain equations from a ASCII format configuration file. The imported equations will be appended to the current equations list in the project. Please note that the sequence of equations is very important, which might lead to different animation effect.
Modes
You can import identified modes (including frequencies, damps, mode shapes, modal A and modal B) from UFF 55 files. An item called "Imported" will appear in the branch of "Data\Setup?\Mode" in the "Data" page of "Workspace" Panel.
Export
Data and all kinds of results can be exported or printed, which provides you great convenience to write a report or give a presentation.
Data
You can export the modes by corresponding toolbar of the mode list view
or the right click menu.
All the mode can be exported to a UFF 55 file (".unv") or ASCII file (".asc").
Data such as input signals, output signal, frequency response functions, power spectrums, and coherences can be exported to UFF files or ASCII files in the "Data" tab page of Workspace shortcut panel.
All the data in the [file://mk:@MSITStore:C:\Program%20Files%20(x86)\OROS\NVSolutions\OROS%20Modal%202%20V5.1\OROSModal.chm::/On-line%20Help/Chapter%202/Chapter%202.4/Chapter%202.4.5.htm data table view] can be exported to an ASCII file.
Table
The identified mode list can be export to Microsoft WORD as an table by the following steps:
- Copy the Mode List to Clipboard
’Copy’ button
in the standard toolbar or ’Copy All’ item in the right click menu of the mode list view can be used to copy all the modes to system’s clipboard. If only part of the modes are needed, please select the items you wanted by ’Shift’ or ’Ctrl’ keys (just like the operations in the Windows’ Explorer), then click on the ’Copy’ item in the right click menu.
- Paste to WORD and Create the Table
Run WORD and create a new document, and paste the contents in the clipboard into it. Select the pasted lines, and use the Insert Table Command, the a new table containing the modes are created. To prettify this table, you can adjust it furthermore.
If you want to use these tables in Microsoft PowerPoint, you can create the table in WORD first, and then copy it to the PowerPoint.
Graphics
Everything in the main window, including the 2D curves, 3D graphics, data tables and so on, can be captured and saved as BMP or JPG graphic files by the ’Save Snapshot’ button
in the standard toolbar.
You can also copy a snap into Windows’ clipboard by the ’Copy’ button
in the standard toolbar, and then paste it to the document.
Animations
The animations of mode shapes or ODS in Modal can be saved as AVI media files according to the following steps:
- Make sure that the mode shape or ODS wanted is shown in activated.
- Press the "Record" button
in the "3D Display" shortcut panel (or using the right click menu), and enter the wanted file name. The default name can be changed from the dialog of "[file://mk:@MSITStore:C:\Program%20Files%20(x86)\OROS\NVSolutions\OROS%20Modal%202%20V5.1\OROSModal.chm::/On-line%20Help/Chapter%202/Chapter%202.2/Chapter%202.2.4.htm Set Properties...]".
- Saving progress will be displayed in the status bar. You can play this AVI file with some media player, or insert it to the WORD/PowerPoint documents.
- The AVI file is encoded with the CODEC you set in the dialog of "[file://mk:@MSITStore:C:\Program%20Files%20(x86)\OROS\NVSolutions\OROS%20Modal%202%20V5.1\OROSModal.chm::/On-line%20Help/Chapter%202/Chapter%202.2/Chapter%202.2.4.htm Set Properties...]". Some CODECs might fail to work correctly. If this happens, please select another one in the dialog of "[file://mk:@MSITStore:C:\Program%20Files%20(x86)\OROS\NVSolutions\OROS%20Modal%202%20V5.1\OROSModal.chm::/On-line%20Help/Chapter%202/Chapter%202.2/Chapter%202.2.4.htm Set Properties...]"..
- Different CODEC leads to different play quality and different file size, you can select the best after trying all.
Everything displayed in the main window, including the 2D curves, 3D graphics, configuration information, data tables and so on, can be previewed by
button or printed by
button in the standard toolbar. Of course, you can realize these operations by menu too.
Shortcuts operation
Many shortcuts are provided to help you operate Modal more conveniently. Your efficiency can be greatly improved by these shortcut operations employing the mouse and keyboard.
Shortcut Operations in the Explorer
| Double click on a ’.cfg’ file | Run Modal, and open this configuration file |
| Double click on a ’.wsp’ file | Run Modal, and load this workspace file |
| Drag a ’.cfg’ file to the software’s mainframe | Open this configuration file |
| Drag a ’.wsp’ file to the software’s mainframe | Load this workspace file |
Shortcut Operations in the General Interface
| Ctrl+N | Create a new configuration file |
| Ctrl+O | Open a configuration file |
| Ctrl+P | Print contents in the current window |
| Ctrl+C | Copy contents in the current window to the clipboard |
| Ctrl+V | Insert clipboard contents |
| Ctrl+Z | Undo the last action |
| Ctrl+Y | Redo the previous undone action |
| Ctrl+D | Locate to the setup list box in the standard toolbar, and switch between each setup |
| F1 | Show the online help manual |
| F5 | Reload the current configuration file |
| F12 | Begin a new session of OROSModal2 |
| Double click on a window tab | Close the relevant window |
| Middle click on a window tab | Close the relevant window |
Shortcut Operations in the 2D Curve Window
| Double click | Select the band between current cursors |
| Enter | Select the band between current cursors |
| Middle click | Delete the latest selected band |
| Backspace or Delete | Delete the latest selected band |
| Double middle click | Delete all the selected bands |
| Esc | Delete all the selected bands |
| Tab | Find the limits between current cursors |
| | Move the two cursors to the left simultaneously |
| | Move the two cursors to the right simultaneously |
| | Move the two cursors outwards simultaneously |
| | Move the two cursors inwards simultaneously |
| Page Up | Increase the cursors’ moving step |
| Page Down | Decrease the cursors’ moving step |
| Home or End | Make the two cursors return to default positions |
| F2 + Mouse moving | Move the two cursors with the mouse simultaneously |
| F3 + Mouse click | Zoom in the range between the two cursors |
| F4 + Mouse click | Display the full band of current curve |
Shortcut Operations in the 3D Graphics Window
| Ctrl+M | Locate to the mode list box in the toolbar, and switch between each mode |
| Click and moving | Rotate the model |
| F2 + mouse moving | Translate the model or selected 3D objects |
| F3 + mouse moving up or down | Zoom in or out the model or selected 3D objects |
| F4 + mouse moving | Rotate the model or selected 3D objects |
| Mouse wheel scroll | Zoom in or out the model or selected 3D objects |
| Delete | Delete selected items (nodes, lines, polygons, 3D objects) |
| | Translate to the left |
| | Translate to the right |
| | Translate to the top |
| | Translate to the bottom |
Shortcut Operations in the Dialog of ’Showed Series’
| Double click on the ’Available No.’ | Add the selected items to ’Selected No.’ |
| Double click on the ’Selected No.’ | Delete the selected items from ’Selected No.’ |
| Right click anywhere | Delete all the items in ’Selected No.’ |
| Middle click anywhere | Delete all the items in ’Selected No.’ |
