Difference between revisions of "NVGate Octave Analyzer"
| (33 intermediate revisions by 5 users not shown) | |||
| Line 1: | Line 1: | ||
[[category:NVGate]] | |||
[[Image:Reports_Tools_Ribbons_402.png|framed|right]] | |||
[[image:n octave.png|right]] | [[image:n octave.png|right]] | ||
NVGate Octave | NVGate [[FFT_Spectrum_Analyzer_Multipurpose|Octave analyzer]] is especially designed for vibration and acoustic signal analysis needing 1/nth octave analysis. This plug-in provides 1/1, 1/3rd, 1/12th and 1/24th digital filters that complies with the latest acoustic standards, such as IEC 61260-1:2014 standard. It provides real time analysis and post analysis results.<br> | ||
Moreover, the user can select | Moreover, the user can select time domain weightings (A or C) and time domain digital integrators and can apply on spectral results A or C weighting.<br> | ||
A lot of averaging modes are available and to comply with acoustic standards, detectors also provide Fast, Slow, Impulse and LEQ averaging.<br> | A lot of averaging modes are available and to comply with acoustic standards, detectors also provide Fast, Slow, Impulse and LEQ averaging.<br> | ||
Octave Tracking is available with time, RPM, or any ΔV triggering.<br> | Octave Tracking is available with time, RPM, or any ΔV triggering.<br> | ||
==Structure and Operation overview== | ==Structure and Operation overview== | ||
=== | ===Structure=== | ||
The figure below shows the block diagram of the analyzer (for one channel) with octave set from 20 kHZ to 2,5kHz. | The figure below shows the block diagram of the analyzer (for one channel) with octave set from 20 kHZ to 2,5kHz. | ||
[[File:octave.png| | [[File:octave.png|700px|none]] | ||
| Line 85: | Line 85: | ||
===Connect track and display=== | ===Connect track and display=== | ||
We advice | We advice using [[NVGate_Software_overview#GoToResult|GoToResult]] result Wizard for connecting track and displaying Octave results. | ||
=== Display Available results:=== | === Display Available results:=== | ||
{|border="2" cellspacing="0" cellpadding="4" width="91%" align="center" | {|class="wikitable" style="background:white" border="2" cellspacing="0" cellpadding="4" width="91%" align="center" | ||
|'''Type''' | |'''Type''' | ||
|'''Size''' | |'''Size''' | ||
| Line 146: | Line 146: | ||
* Overall level: This result is available when the 1/n Octave plug-in is in "Running" state. It displays the overall level of the signal between the lower and upper frequency. It is computed before the filter bank, thus it is not the addition of the values of the 1/n octave result. | * Overall level: This result is available when the 1/n Octave plug-in is in "Running" state. It displays the overall level of the signal between the lower and upper frequency. It is computed before the filter bank, thus it is not the addition of the values of the 1/n octave result. | ||
* Overall Weighted: This result is available when the 1/n Octave plug-in is in "Running" state. It displays the overall level of the weighted signal between the lower and upper frequency. The weighted filter is chosen by the ''1/n octave/CPB filters/Global Level Weighting ''setting. It is computed before the filter bank, thus it is not the addition of the values of the 1/n octave result. | * Overall Weighted: This result is available when the 1/n Octave plug-in is in "Running" state. It displays the overall level of the weighted signal between the lower and upper frequency. The weighted filter is chosen by the ''1/n octave/CPB filters/Global Level Weighting ''setting. It is computed before the filter bank, thus it is not the addition of the values of the 1/n octave result. | ||
===1/n Octave Settings=== | ===1/n Octave Settings=== | ||
[[Image:Reports_Tools_Ribbons_402.png|framed|right]] | |||
[[image:n octave.png|right]] | [[image:n octave.png|right]] | ||
| Line 244: | Line 163: | ||
* '''Repeat''': This setting allows selecting a condition for the plug-in to be restarted. If an event is selected as a Start event, the option New start is available, and when this mode is selected each Start event restarts the plug-in. The mode End of averaging is available when the value of the ''1/n Octave x/Average/Type ''setting is different from the Exponential mode, it restarts the plug-in when the averaging is finished. It is set to "Off" except for linear average when it is set to "End of averaging". In this case, the "Avg duration" gives the periodicity of the average restart. | * '''Repeat''': This setting allows selecting a condition for the plug-in to be restarted. If an event is selected as a Start event, the option New start is available, and when this mode is selected each Start event restarts the plug-in. The mode End of averaging is available when the value of the ''1/n Octave x/Average/Type ''setting is different from the Exponential mode, it restarts the plug-in when the averaging is finished. It is set to "Off" except for linear average when it is set to "End of averaging". In this case, the "Avg duration" gives the periodicity of the average restart. | ||
* | * | ||
{|border="2" cellspacing="0" cellpadding="4" width="93%" align="center" | {|class="wikitable" style="background:white" border="2" cellspacing="0" cellpadding="4" width="93%" align="center" | ||
|'''Repeat''' | |'''Repeat''' | ||
|'''Description''' | |'''Description''' | ||
| Line 264: | Line 183: | ||
''Hidden/fixed: the average type sets the authorized repeat modes.'' | ''Hidden/fixed: the average type sets the authorized repeat modes.'' | ||
{|border="2" cellspacing="0" cellpadding="4" width="65%" align="center" | {|class="wikitable" style="background:white" border="2" cellspacing="0" cellpadding="4" width="65%" align="center" | ||
|'''Type''' | |'''Type''' | ||
|'''Repeat mode''' | |'''Repeat mode''' | ||
| Line 295: | Line 214: | ||
[[Image:Octave_03.png|framed|none]] | [[Image:Octave_03.png|framed|none]] | ||
</font>The <nowiki>’</nowiki>Run<nowiki>’</nowiki> corresponds to the start of the analyzer. The start is the beginning of average duration. At the end of the first average, the second average will start and so on | </font>The <nowiki>’</nowiki>Run<nowiki>’</nowiki> corresponds to the start of the analyzer. The start is the beginning of average duration. At the end of the first average, the second average will start and so on until the end of the integration time (even if the last short time integration duration is not over). Each averaging has the same size, except the last that can be smaller. | ||
- Mode Repeat on <nowiki>’</nowiki>New start<nowiki>’</nowiki>: | - Mode Repeat on <nowiki>’</nowiki>New start<nowiki>’</nowiki>: | ||
| Line 307: | Line 226: | ||
====Average==== | ====Average==== | ||
<Youtube>https://www.youtube.com/watch?v=aoLu90S5X9k</Youtube> | |||
Contains the settings related to the type of averaging of the signals to be computed. | Contains the settings related to the type of averaging of the signals to be computed. | ||
* '''Type'''[[Image:Reports_Tools_Ribbons_407.png]]: the average type. | * '''Type'''[[Image:Reports_Tools_Ribbons_407.png]]: the average type. | ||
{|border="2" cellspacing="0" cellpadding="4" width="93%" align="center" | {|class="wikitable" style="background:white" border="2" cellspacing="0" cellpadding="4" width="93%" align="center" | ||
|'''Type''' | |'''Type''' | ||
|'''Description''' | |'''Description''' | ||
| Line 325: | Line 247: | ||
|- | |- | ||
|Exponential | |Exponential | ||
|Works with the same time constant on every detector. It is equivalent to a RC filter following the squaring module. Performs continuous exponential averaging of instantaneous 1/n octave spectrum over "Exponential time constant" value.<br><br>''Refresh'' is performed when new instantaneous spectrum is available (periodicity: (1/(fs | |Works with the same time constant on every detector. It is equivalent to a RC filter following the squaring module. Performs continuous exponential averaging of instantaneous 1/n octave spectrum over "Exponential time constant" value.<br><br>''Refresh'' is performed when new instantaneous spectrum is available (periodicity: (1/(fs))*256 with fs the input sampling frequency)<br><br>The ''event'' ''"Oct result available"'' corresponds to the periodicity (1/(fs))*256 with fs the input sampling frequency). | ||
|- | |- | ||
| Line 367: | Line 289: | ||
'''''Hidden/fixed''': ''the last five types are enabled only if the Upper central frequency is upper than 6.3 kHz. | '''''Hidden/fixed''': ''the last five types are enabled only if the Upper central frequency is upper than 6.3 kHz. | ||
* '''Avg'''. '''duration'''[Image:Reports_Tools_Ribbons_407.png]]: defines the long term average duration time in second. See the table below for more information. If you change the short duration, the average duration will be automatically adjust to the closest value multiple of short duration. | * '''Avg'''. '''duration'''[[Image:Reports_Tools_Ribbons_407.png]]: defines the long term average duration time in second. See the table below for more information. If you change the short duration, the average duration will be automatically adjust to the closest value multiple of short duration. | ||
* '''Short duration'''[Image:Reports_Tools_Ribbons_407.png]]: defines the short term average duration time in second. See the table below for more information. | * '''Short duration'''[[Image:Reports_Tools_Ribbons_407.png]]: defines the short term average duration time in second. See the table below for more information. | ||
* '''Exponential time constant''': defines the average duration time in second for the exponential averaging mode. See the table below for more information. | * '''Exponential time constant''': defines the average duration time in second for the exponential averaging mode. See the table below for more information. | ||
''Hidden/fixed: '' | ''Hidden/fixed: '' | ||
{|border="2" cellspacing="0" cellpadding="4" width="92%" | {|class="wikitable" style="background:white" border="2" cellspacing="0" cellpadding="4" width="92%" | ||
|'''Type''' | |'''Type''' | ||
|'''Avg. duration''' | |'''Avg. duration''' | ||
| Line 442: | Line 364: | ||
* '''Upper central freq'''[[Image:Reports_Tools_Ribbons_404.png]]: the central frequency of the upper band of the frequency range. The bands considered are octave bands (for the octave mode) and 1/3 octave bands (for the other modes). | * '''Upper central freq'''[[Image:Reports_Tools_Ribbons_404.png]]: the central frequency of the upper band of the frequency range. The bands considered are octave bands (for the octave mode) and 1/3 octave bands (for the other modes). | ||
The user enters a value, which is adjusted to the closest central frequency. The bandwidth between Lower and Upper central frequency must be lower than or equal to eleven filters (considering octave bands) and 31 filters (considering 1/3 octave bands). So, if this bandwidth increases, then the Lower central frequency is automatically increased. | The user enters a value, which is adjusted to the closest central frequency. The bandwidth between Lower and Upper central frequency must be lower than or equal to eleven filters (considering octave bands) and 31 filters (considering 1/3 octave bands). So, if this bandwidth increases, then the Lower central frequency is automatically increased. | ||
'''Note:''' For having the last band compatible with the Class #1 standard, the front end sampling frequency need to cover the full band. Exemple: for having Class #1 compatible for 1/3 octave 20kHz the sampling frequency need to be 65,536kS/s. If you let the sampling frequency at 51.2kS/s (20kHz bandwith) you will be Class #2 standards. | |||
* '''Mode[[Image:Reports_Tools_Ribbons_407.png]]:''' | * '''Mode[[Image:Reports_Tools_Ribbons_407.png]]:''' | ||
{|border="2" cellspacing="0" cellpadding="4" width="53%" align="center" | {|class="wikitable" style="background:white" border="2" cellspacing="0" cellpadding="4" width="53%" align="center" | ||
|'''Mode''' | |'''Mode''' | ||
|'''Description''' | |'''Description''' | ||
| Line 467: | Line 391: | ||
* '''Global Level weighting:''' | * '''Global Level weighting:''' | ||
Weighted overall levels of the1/n Octave Plug-in are now computed | Weighted overall levels of the1/n Octave Plug-in are now computed in the time domain (weighting filter and detector). Processing weighting in the time domain provides accurate measurement for non-stationary signals (impulsive). | ||
[[Image:Octave_05.png|framed|none]] | [[Image:Octave_05.png|framed|none]] | ||
| Line 492: | Line 416: | ||
This status displays the type of averaging between brackets (i.e. Lin, Rep, Leq, CBT, Fast, Slow, Ipls or Exp), the plug-in state (Run, Paused, Stop) and the real-time status. | This status displays the type of averaging between brackets (i.e. Lin, Rep, Leq, CBT, Fast, Slow, Ipls or Exp), the plug-in state (Run, Paused, Stop) and the real-time status. | ||
The way the status bar is displayed | The way the status bar is displayed depends on the mode selected: | ||
* '''Linear, Repeat, Short Leq: '''display the Average Duration. The status bar is displayed from left to right. The text displayed indicates the state of the acquisition (Run, Paused or Stop) with the time. | * '''Linear, Repeat, Short Leq: '''display the Average Duration. The status bar is displayed from left to right. The text displayed indicates the state of the acquisition (Run, Paused or Stop) with the time. | ||
| Line 521: | Line 445: | ||
===Analysis overload=== | ===Analysis overload=== | ||
This status displays if during the acquisition, there | This status displays if during the acquisition, there was an amplitude overload (or not) of the analyzed inputs. | ||
===Time to stabilization=== | ===Time to stabilization=== | ||
| Line 532: | Line 456: | ||
Where x depends on the mode: | Where x depends on the mode: | ||
{|border="2" cellspacing="0" cellpadding="4" width="36%" align="center" | {|class="wikitable" style="background:white" border="2" cellspacing="0" cellpadding="4" width="36%" align="center" | ||
|'''Mode''' | |'''Mode''' | ||
|'''x''' | |'''x''' | ||
| Line 554: | Line 478: | ||
|} | |} | ||
If there were no change between two | If there were no change between two runs, no stabilization would be necessary. But if a new plug-in is connected, the system is reinitialized and then there is a time to stabilization. | ||
Revision as of 09:03, 16 March 2022
NVGate Octave analyzer is especially designed for vibration and acoustic signal analysis needing 1/nth octave analysis. This plug-in provides 1/1, 1/3rd, 1/12th and 1/24th digital filters that complies with the latest acoustic standards, such as IEC 61260-1:2014 standard. It provides real time analysis and post analysis results.
Moreover, the user can select time domain weightings (A or C) and time domain digital integrators and can apply on spectral results A or C weighting.
A lot of averaging modes are available and to comply with acoustic standards, detectors also provide Fast, Slow, Impulse and LEQ averaging.
Octave Tracking is available with time, RPM, or any ΔV triggering.
Structure and Operation overview
Structure
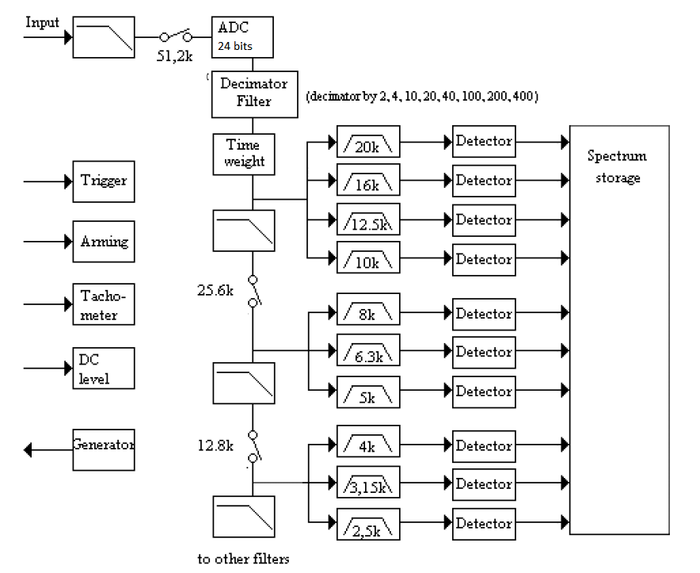
The figure below shows the block diagram of the analyzer (for one channel) with octave set from 20 kHZ to 2,5kHz.
After amplification and antialias filtering, analog input signals are sampled at 51.2 kHz and converted by an analog to digital converter.
The sample frequency depends on the value of the High Filter Setting
Next, the input signals can be time weighted filters.
- A, B and C weight filters : These filters available in acoustic frequency range (i.e. from 20 Hz to 20 kHz) satisfy requirements from last standards IEC 651 type 0 and IEC 804 type 0.
- Any other NVGate filter need to be apply on Input Front end (real time) or Input Player (post analyisis).
After time domain filtering, the signals go to the digital 1/nth octave filter bank.
This filter bank is based on the 6th order digital band pass. A downsampling for low central frequency filters reduces computation load. The downsampling filters have a rejection greater than 90 dB at half of each new sampling rate and a ripple less than 0.007 dB in the useful bandwidth.
The filter range uses base 10 so that we get exact frequencies at 0.1 Hz, 1.0 Hz, 10 Hz, 100 Hz, 1 kHz and 10 kHz.
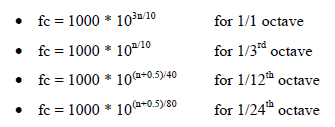
Computation central frequency
The following calculations are used to compute the central frequencies:
Number of filter and frequency range for each filter bank:
1/1 octave filter bank:
- can have up to 11 filters (with 1 to 1000 frequency ratio),
- covers range from 125 mHz to 16 kHz.
1/3rd octave filter bank:
- can have up to 31 filters (with 1 to 1000 frequency ratio),
- covers range from 100 mHz to 20 kHz.
For 1/12th octave:
- the filter bank gets 4 filters for each useful bandwidth of 1/3rd filters, i.e. 124 filters,
- covers range from 92 mHz to 21.8 kHz.
For 1/24th octave:
- the filter bank gets 8 filters for each useful bandwidth of 1/3rd filter, i.e. 248 filters,
- covers range from 90 mHz to 22.1 kHz.
Detector
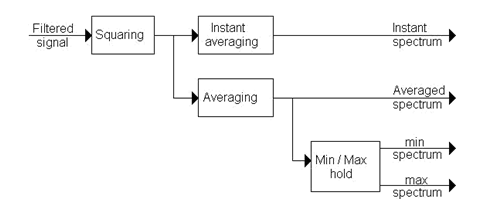
The next step is the detector process for each 1/nth filter:
The filtered signal is input to a squaring module in order to get true RMS detector.
This module computes 1/N * Σx²n.
The instant averaging is always running and is based on the exponential averaging with a time constant equal to 1/fc where fc is the center frequency of corresponding filter. So each detector has its own time constant and the output fluctuation in the worst case is limited to +/- 0.4 dB with a sine input signal.
The averaging process provides a lot of modes (linear, exponential and dedicated to acoustical measurements) which are described in averaging part.
A hold box allows to get Maximum and Minimum spectra during one measure.
Stabilisation delay
A stabilization delay is implemented in order to ignore and suppress the transient response of passband filters. It is automatically taken into account after any change of input setup. It is equal to 5 periods of the lower frequency filter for 1/3rd octave and octave filters. This delay is four times greater for 1/12th octave filters (i.e. 20 periods of the lower frequency filter) and eight times greater for 1/24th octave filters (i.e. 40 periods of the lower frequency filter).For example, if lower frequency filter is centered at 1 Hz, then the stabilization delay is equal to 5 seconds for octave and 1/3rd octave, 20 seconds for 1/12th octave and 40 seconds for 1/24th octave. During this delay the detectors are inactive.
The filter bank continuously runs and instant averaging is always available (excluding time period for filter stabilization).
In linear modes, trigger events are used to start and/or stop energy computation in detectors and store associated results in the spectrum waterfall memory.
In exponential modes, detectors are always running and trigger events are only used to store associated results in the spectrum waterfall memory.
Software use and settings
Connect track and display
We advice using GoToResult result Wizard for connecting track and displaying Octave results.
Display Available results:
| Type | Size | Dimension | Domain | Save |
| 1/n octave | FilterNumber | 2D | spectral | Yes |
| Avg. 1/n octave | FilterNumber | 2D | spectral | Yes |
| Min Avg. octave | FilterNumber | 2D | spectral | Yes |
| Max Avg. octave | FilterNumber | 2D | spectral | Yes |
| Overall level | 1 pt | 1D | level | Yes |
| Overall Weighted | 1 pt | 1D | level | Yes |
- 1/n octave: This result is always available. It displays the output of the RMS detectors that analyzes the output of each filter from the filter bank.
- Avg. 1/n octave: This result is available when the 1/n Octave plug-in is in "Running" state. It displays the result of the averaging of the 1/n octave result.
- Min Avg. octave: This result is available when the 1/n Octave plug-in is in "Running" state. It displays the minimum value of each band of the Avg 1/n octave result. Restarting the plug-in will reset this result.
- Max Avg. octave: This result is available when the 1/n Octave plug-in is in "Running" state. It displays the maximum value of each band of the Avg 1/n octave result. Restarting the plug-in will reset this result.
- Overall level: This result is available when the 1/n Octave plug-in is in "Running" state. It displays the overall level of the signal between the lower and upper frequency. It is computed before the filter bank, thus it is not the addition of the values of the 1/n octave result.
- Overall Weighted: This result is available when the 1/n Octave plug-in is in "Running" state. It displays the overall level of the weighted signal between the lower and upper frequency. The weighted filter is chosen by the 1/n octave/CPB filters/Global Level Weighting setting. It is computed before the filter bank, thus it is not the addition of the values of the 1/n octave result.
1/n Octave Settings
Channel
Contains the settings related to the source input.
- Source: input source to be analyzed. It may come from the Front-end input or from the Player in post analysis mode (see the post analysis chapter). In post analysis mode, tracks with a signal bandwidth lower than the Upper central frequency cannot be plugged.
Trigger
Contains the settings related to triggering events and how to start and stop signal computation.
- Start: defines the event to start the analysis. The user can choose any event among the list of defined events. By default only the Free run and Manual events are available. The user can define another event in the "Event Definition" shared resources and then use this event for the "Start" condition.
- Stop: defines the event to stop the analysis. The user can choose any event among the list of defined events. By default only the Free run and Manual events are available. The user can define another event in the "Event Definition" shared resources and then use this event for the "Stop" condition.
- Repeat: This setting allows selecting a condition for the plug-in to be restarted. If an event is selected as a Start event, the option New start is available, and when this mode is selected each Start event restarts the plug-in. The mode End of averaging is available when the value of the 1/n Octave x/Average/Type setting is different from the Exponential mode, it restarts the plug-in when the averaging is finished. It is set to "Off" except for linear average when it is set to "End of averaging". In this case, the "Avg duration" gives the periodicity of the average restart.
| Repeat | Description |
| Off | no repeat. The measurement is stopped at the end of averaging. |
| New start | The measurement restarts when the start event occurs. It is enabled if Start is different from Free run. |
| End of averaging | The measurement restarts at the end of averaging. |
Hidden/fixed: the average type sets the authorized repeat modes.
| Type | Repeat mode |
| Linear | Off / New start / End of Averaging |
| Repeat | Set to End of averaging |
| Short LEQ (1/8s or 1s) | Set to End of averaging |
Other types |
Set to Off |
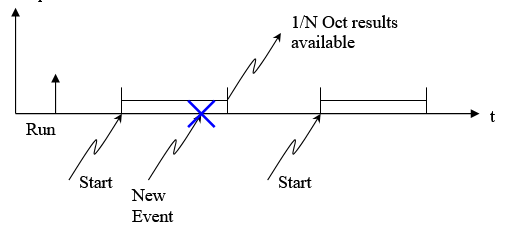
The following scheme is a description of the two different repeat modes:
- Mode Repeat on ’end of averaging’:
The ’Run’ corresponds to the start of the analyzer. The start is the beginning of average duration. At the end of the first average, the second average will start and so on until the end of the integration time (even if the last short time integration duration is not over). Each averaging has the same size, except the last that can be smaller.
- Mode Repeat on ’New start’:
The ’Run’ trigger the analyzer, but the average begins at the start event (set in the event definition). This averaging stops at the end of average duration or at the stop event. Then the next averaging is waiting for the new start event to occur.
In case a new event occurs during a previous averaging, this start event won’t be effective because the previous average duration is not over, you can only set other event after the end of the previous one.
Average
Contains the settings related to the type of averaging of the signals to be computed.
Hidden/fixed: the last five types are enabled only if the Upper central frequency is upper than 6.3 kHz.
- Avg. duration
 : defines the long term average duration time in second. See the table below for more information. If you change the short duration, the average duration will be automatically adjust to the closest value multiple of short duration.
 - Short duration
 : defines the short term average duration time in second. See the table below for more information.
 - Exponential time constant: defines the average duration time in second for the exponential averaging mode. See the table below for more information.
Hidden/fixed:
| Type | Avg. duration | Short duration | Exponential time constant |
| Linear | Visible | not used | not used |
| Repeat | visible | visible | not used |
| Exponential | not used | not used | visible |
| Cst BT | not used | not used | not used |
| Short LEQ1/8s | visible | set (1/8s) | not used |
| Short LEQ 1s | visible | set (1s) | not used |
| Fast | not used | not used | set (1/8s) |
| Slow | not used | not used | set (1s) |
| Impulse | not used | not used | set (0.035s) |
CPB filters
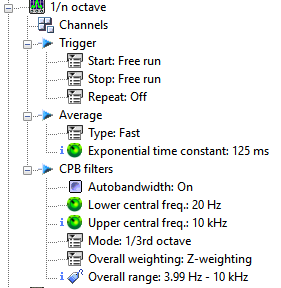
- Autobandwidth: manages the analysis and recording bandwidths automatically. The Inputs selection window allows the use of 2 different sampling rates for the dynamic inputs. It gathers inputs with the same physical quantity into groups, maintaining the same sampling into each group. When inputs are associated with the analysis plug-in, it adjusts its analysis bandwidth to match the inputs ones. Mixing input bandwidths in one analysis plug-in lead to set its bandwidth to the lowest one. Autobandwidth is set by default . When it is enabled in the plug-in, these settings "switch to informative status"
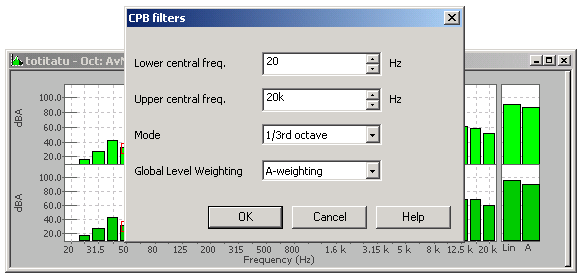
- Lower central freq
 : the central frequency of the lower band of the frequency range. The bands considered are octave bands (for the octave mode) and 1/3 octave bands (for the other modes).
The user enters a value, which is adjusted to the closest central frequency. The bandwidth between the Lower and Upper central frequencies must be lower than or equal to eleven filters (considering octave bands) and 31 filters (considering 1/3 octave bands). So, if this bandwidth increases, then the Upper central frequency is automatically reduced.
- Upper central freq
 : the central frequency of the upper band of the frequency range. The bands considered are octave bands (for the octave mode) and 1/3 octave bands (for the other modes).
The user enters a value, which is adjusted to the closest central frequency. The bandwidth between Lower and Upper central frequency must be lower than or equal to eleven filters (considering octave bands) and 31 filters (considering 1/3 octave bands). So, if this bandwidth increases, then the Lower central frequency is automatically increased.
Note: For having the last band compatible with the Class #1 standard, the front end sampling frequency need to cover the full band. Exemple: for having Class #1 compatible for 1/3 octave 20kHz the sampling frequency need to be 65,536kS/s. If you let the sampling frequency at 51.2kS/s (20kHz bandwith) you will be Class #2 standards.
| Mode | Description |
| Octave | Octave digital filter |
| 1/3 octave | 1/3 octave digital filter |
| 1/12 octave | 1/12 octave digital filter |
| 1/24 octave | 1/24 octave digital filter |
- Global Level weighting:
Weighted overall levels of the1/n Octave Plug-in are now computed in the time domain (weighting filter and detector). Processing weighting in the time domain provides accurate measurement for non-stationary signals (impulsive).
The type of time domain weighting (A or C) is selected in the ASB setting 1/n Oct / CPB filters / Global level weighting.
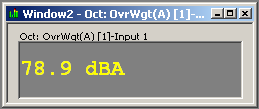
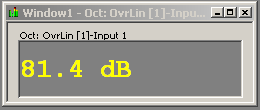
These overall values can be displayed in view meter.
1/n Octave status
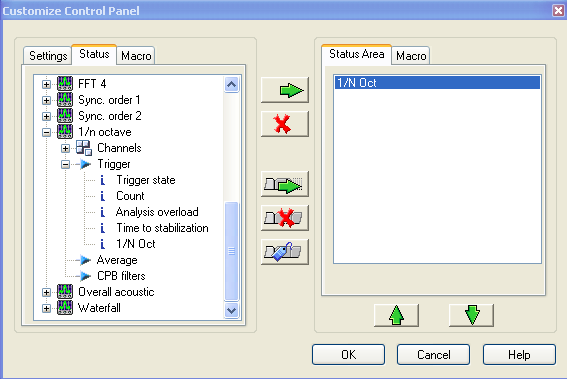
All statuses are available to add to the control panel
1/N oct
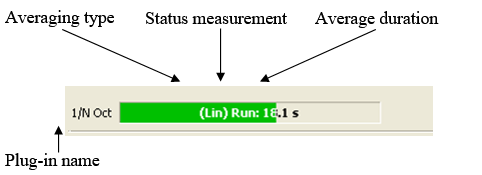
The current plug-in status is synthesized in a special progress-bar. This progress bar is automatically displayed in the ’control panel’ when the plug-in is active (i.e. as soon as at least 1 input is connected to the Sync Order plug-in). This status is called ’1/N Oct’ and it is available in the status ASB tree (see customize control panel).
This status displays the type of averaging between brackets (i.e. Lin, Rep, Leq, CBT, Fast, Slow, Ipls or Exp), the plug-in state (Run, Paused, Stop) and the real-time status.
The way the status bar is displayed depends on the mode selected:
- Linear, Repeat, Short Leq: display the Average Duration. The status bar is displayed from left to right. The text displayed indicates the state of the acquisition (Run, Paused or Stop) with the time.
- Cst BT, Fast, Slow, Impulse: the status bar is a ’snake’ type; the text displayed indicates the state of the acquisition (Run, Paused or Stop).
- Exponential: the status bar is displayed from right to left with flashing until the end of the acquisition. The text displayed indicates the exponential averaging time.
The color of the background bar and of the text depends on real-time status:
- Green background and white or black text: acquisition in real-time.
- Red background and white or black text: the current acquisition is not real-time (current block is not analyzed).
- Green background and red text: the current acquisition is real-time, but since start not all the blocks were analyzed.
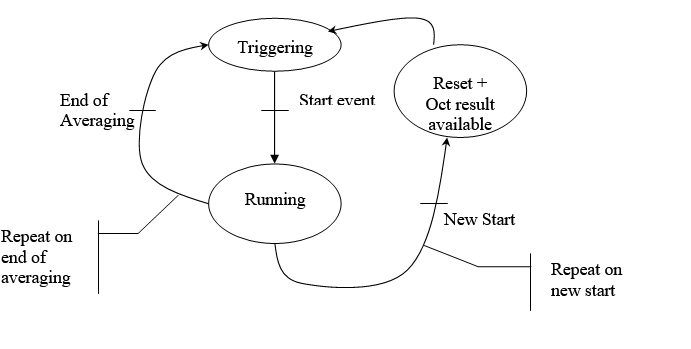
Trigger state
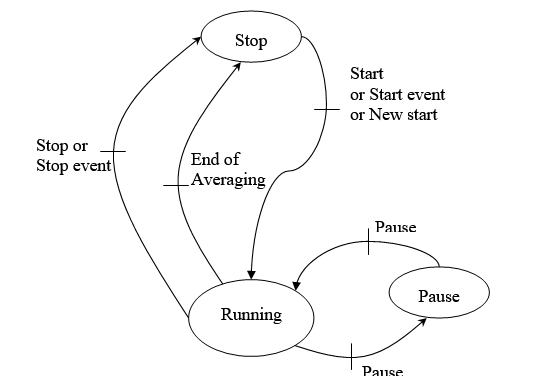
The following scheme describes the different states of the measurement:
Count
This status displays:
- The average time in linear, short Leq and repeat modes.
- The exponential time constant in exponential, Fast, Slow, Impulse modes.
- The integration time T in constant band tracking modes.
Note that in linear mode, if repeat were on end of averaging, the count would restart at the end of averaging until stop event. If repeat were on new start, the count is set to zero at the end of averaging waiting for a new trigger.
In Short Leq mode, the count is stopped at the end of time duration (the repeat mode is made on short duration).
Analysis overload
This status displays if during the acquisition, there was an amplitude overload (or not) of the analyzed inputs.
Time to stabilization
Until this time to stabilization is over, results are not available. All filters have a stabilization time and at any change of settings, filters need this time before the results are available. The lower the frequency is the longer this stabilization is.
The filters stabilization time is given by:
Time (s) = x * 5 / lower central frequency
Where x depends on the mode:
| Mode | x |
| Octave | 1 |
| 1/3 octave | 1 |
| 1/12 octave | 4 |
| 1/24 octave | 8 |
If there were no change between two runs, no stabilization would be necessary. But if a new plug-in is connected, the system is reinitialized and then there is a time to stabilization.

