NVGate Ribbons: Measurement Tab
OLD page obsolet since NVGate 2022
The "Measurement" tab
This tab is dedicated to be used during measurement time, featuring useful tools used during this step. This tab occurs naturally after the Home one and its Start group.
The measurement tab offers powerful controls and commands for:
- Monitoring Traces, Windows and Layouts scanner to keep an eye on any signal and analysis results
- Recording with arming and target selection (off, on analyzer, on PC)
- Front-end control, with an easy access to Check ICP, Check TEDS, Calibration, Bridge balance and the sampling frequency control
- Saving data with trace memorization, saved result selection and print report buttons.
Control group
These settings control the general analyzer status and the recorder activity
![]() Run: (CTRL+R) This button control the general analysis and recording start. The plug-in with connected channels/tracks will start their process one the run is activated.
Run: (CTRL+R) This button control the general analysis and recording start. The plug-in with connected channels/tracks will start their process one the run is activated.
Note: The monitor and the Time Domain Analysis (in free run mode) process is continuous; it do not depends on the run status.
Note: the trigger/start status of the plug-ins may block their process, waiting for an event.
Warning: Pressing the run button during an analysis lead to reset all current analyses, restarting all averages from 0. The analyzed data will be lost.
Note: If the recorder is running, its starts / finishes a record.
After requesting a stop, the plug-ins finished their current block. When all the plug-ins has switched to Stopped the analyzer switch to the Stopped status
Note: The analyzed results and recorded signal are saved when the analyzer switch to stop. This is the default behavior. It may be changed from the user preferences (see user preferences chapter)
Note that another Run/Pause/Stop button is always available in the status bar (bottom left)
 Arm: (CTRL+SHIFT+R) Arm the recorder. Prepare the recorder to start immediately on the run. Arming process can lap a few seconds.
Note: modifying a setting of the analyzer will disable the arming. It is then necessary to re-arm it.
If the recorder is not armed, it will take a few second to achieve the arming prior to effectively start recording the data.
- Note: the recorer can be armed from the ASB: (Recorder /Trigger/ Recorder).
 Manual trigger: (CTRL+T) generate a manual trigger event. This event is available for the event list and can be associated to the plug-in triggers (start/stop or trigger). See acquisition tab description.
Warning: While the manual trigger is not associated to a plug-in, it has no effect.
 Record status: Controls the recorder location and activity.
- If the setting is set to Off, the icon is grayed

- If the setting is set to PC, the data are recorded on the PC HDD
- If the setting is set to Analyzer
 Record mark: Allow adding a mark with comments while recording. These marks are available when the signal file is edited.
 It opens the signal monitoring window on top of the current layout. In the case of this window is already open in another layout, it swaps to this layout.
Front-end group
Control/command of the general acquisition setup.
 Auto-range (CTRL+SHIFT+A). Controls and start the auto-ranging procedure. See Chapter 1 ASB § Front-end/Auto-range for details
- Record signal : Check this box to ensure the recording of all active inputs. This includes the DC inputs (parametric), the Ext Sync. and the CAN ones.
Unchecking this box just set the recorder to off. The inputs remain set in the recorder. This is helpful to temporarily pause the inputs recording; especially on setup fine tuning.
 Bridge auto-zero: Balance the inputs connected through the Wheatstone bridge Xpod. See Chapter 1 ASB - § front-end/inputs settings for details.
Note: The plug-in analyzer and the recorder can reduce respective their bandwidths independently. This setting fixes the acquisition time accuracy and fixes the max signal bandwidth. see front-end/inputs settings for details.
Save group
Manages the results and signal saving and allows direct report generation.
 Print Report. This button refreshes the content of the active report document (Word or Excel) and prints it to the default printer. See Chapter 5 Report & tools § Reporting for details.
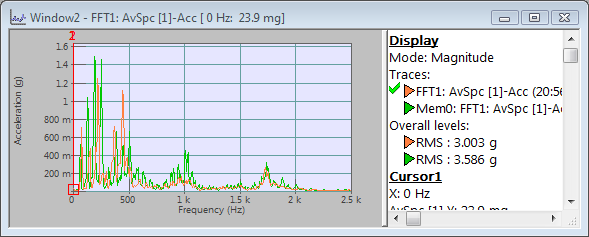
 Memorize trace (Ins): Creates an instant copy of the active trace in the active window. The memorized trace add incrementally traces called Memx in the current window
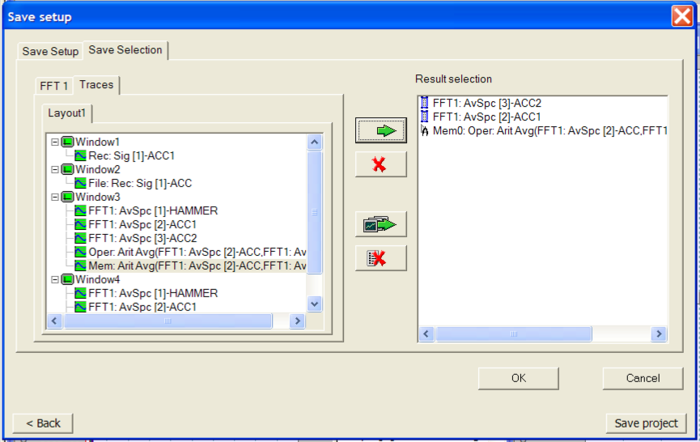
These memorized traces can be added to the save selection using the "add to result selection" entry of the window contextual menu.
see memorize trace page for details.
Save setup tab
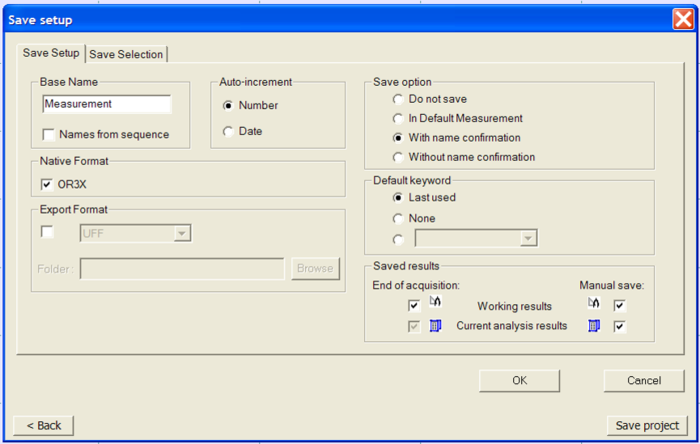
 Save setup: Defines the way the result and signal are saved. It opens the Save setup dialog which contains 2 tabs
- Base name: The name the new measurement will have. A suffix is automatically added to the name if the specified name is already in use.
- Names from sequence: Select this option to link the measurement name to the corresponding sequence fields of the sequence currently in use.
See also "Sequence" topic from Chapter 5: Reports & Tools.
- Native format: Determines whether the measurement should be saved in OR3x format. If not selected, the new measurement will not appear in the project manager.
- Export format: Used to export the new measurement in an external format. A folder must be specified to receive the converted result.
See more details about the export formats in the "Export" topic from the "Chapter 7: User preferences".
- Auto-increment: Used to insure the new measurement has a unique name.
| Number | Adds a number to the Base name. The first available increment is used |
| Date | Adds date information to the Base name. The date format is dd-mm-yyyy hh’mm’ss" or mm-dd-yy hh’mm’ss according to the regional settings of the PC |
- Save option: This option determines the way in which the measurement will be created when the analyzer stops
| Do not save | No measurement will be created. The only way to save the results selected is to perform the Save Result command manually |
| In default measurement | The measurement is created with the name "Default measurement". If a measurement with this name already exists, it is overwritten. |
| With name confirmation | A dialog box will be displayed when the analyzer stops. It will suggest a name using a Base name and an auto increment choice. |
| Without name confirmation | The measurement is created with a name automatically generated from the Base name and the auto increment choice. |
- Default keyword: Used to choose the keyword that will be associated with the new measurement. Refer to the preference section for more information.
- Saved Results
- Current Analysis result: Results obtained from an acquisition.
- End of acquisition: open automatically a dialog box to save the results when the analyzer stops.
- Manually: allow to save the results manually.
- Working results: Results obtained after an operation based on already saved analysis results, for example a result calculated with an operator.
These results can be only saved manually.
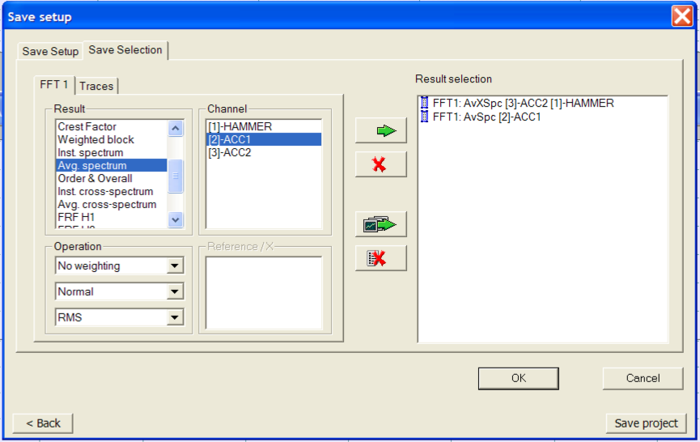
Save selection tab:
Results provided by the plug-ins
- Result selection: List of results provided by the plug-in analyzer selected. Multiple plug-ins may be selected if all results selected are compatible (which means that they can be displayed in the same result window).
- Channel selection: List of plug-in analyzer channels connected, available for the result selected.
- Operation: in the top combo-box, list of weighting that can be applied to results selected. In the middle combo-box, list of derivation/integration operations which can be applied. In the bottom combo-box, list of display units.
- Reference / X: List of plug-in analyzer channels connected. This can be the reference. Available for results that require a reference only (cross-spectrum, for example).
- Tracked order: List of tracked orders on channel selected. Available if result selected is an order result.
- Traces
List of traces available in the project coming from current analysis results and working results.
The result can be saved when:
- There is at least one result selected in the save selection,
- The analyzer is stopped
- The results exists
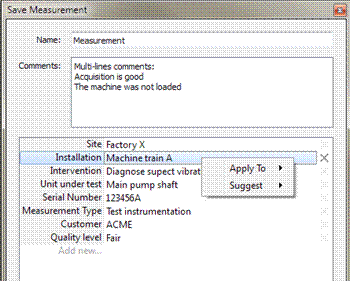
By default the save measurement displays the following confirmation window.
The Save Measurement dialog will show the visible properties with their suggected values:
This dialog box allows entering:
- the measurement name to identify your data
- An associated keyword that allows filtering the project manager
- User’s comments (Use the CTRL+Enter to add lines)
In Addition, the measurement can be informed with properties which are used to help retrieving the files and their meaning.
The properties are attached to the measurement and filled while saving the data or by editing the properties from the project manager. The properties belong to 3 different categories:
- The OROS properties are automatically filled by NVGate: Date, Author, Protection, Project name, Signal location and Number and type of saved results.
- The OROS user properties are already created by NVGate. Their values, but must be filled by the operator: Comments, Site, Installation, Intervention, UUT, Serial number, Measurement type and Default type
- The Users parameters are created and filled by the operator while saving or by editing the properties. Ex: TestCampaign, R&DProject or Customer name. Users parameters can be predefined from the ribbon: Measurement/Preferences/Measurement Properties
Note that users’ properties will pollinate. It means the new properties type will be automatically added on the future measurements. The same occurs if you import or copy a measurement which contains unknown users’ properties.
The OROS User properties easily cover a wide range of situations. Properties options are:
- Site is for the location of the measurement. It can be a ship, a test track, a test cell, an aircraft or a factory.
- Installation is for the tested machinery. It can be a diesel engine, a car, a jet engine, a pump, a machine tool, etc…
- Intervention describes the type of acquisition/analysis: qualification, overhaul check, prototyping, diagnostic, routine data collection, first run, etc…
- Unit Under Test (UUT) indicates precisely which part is tested: a tire, a bearing, a transmission, etc…
- Measurement type: Describes the type of measuring; Acoustic, diagnostic, rotating, etc..
- Default (or Defect): The identified defect on the UUT.
Managing properties
To enter the property values, click on the right cell of the corresponding line and add text.
To remove a property from the measurement, use the cross on the right side of the corresponding line.
To add a property fill the bottom left cell with the property name and use the tab or click on the right cell to enter its value.
By right clicking on the property line you can hide it or change the suggestion mode. In order to save your entered values from one measurement to the next one, select Same as previous. Same as today will reset the suggestion as soon as the date of the latest saved measurement is different from current day.
Note: Measurement’s properties can be edited from the Project Manager by right clicking on the desired measurement.
Graphs group
The graph group purpose is to navigate (i.e. scan) all existing displays and to provide basic scaling tools.
 Browsers : Allows browsing in the Traces, Windows or Layouts. Depending on the pressed arrow (left or right) the item will be scanned in different side.
- Traces (up/down key), the positive scan is the creation order (from the oldest to the latest added traces in a window).
- Windows (CTRL+TAB) the positive scan is the inverse of the focus (from the latest to the oldest clicked/activated).
- Layouts (CTRL+SHIFT+SPACE ), the positive scan is the creation one (from the oldest to the latest created Layouts ).
 Auto-scale (CTRL+A) : Adjust the Y scale of all the windows in the current layout. The scales are adjusted to the largest trace amplitude (min and max) in each graph. A 10% margin is added to these values to facilitate visibility.
Note: The minimum Y scale width cannot be lower than the active signal precision.
 Scale mode (CTRL+F5) This mode is used to modify scales using in the mouse graph, by moving the cursor on the scale. The cursor shape changes depending on the position of the mouse on the scale. Use the mouse wheel or the Up/Down arrows to change the scale value. If the Ctrl key is pressed, the changes are five times smaller, for more precise adjustment of the value modified.
| Mouse cursor | Position on the scale and action |
|
, |
On the lower left part of the scale. Only the minimum value of the scale is modified. |
|
, |
On the upper right part of the scale. Only the maximum value of the scale is modified. |
|
, |
On the center of the scale. Both minimum and maximum values are modified, in the same direction. This performs a translation of the scale |
|
, |
On the center of the scale, with Shift key pressed. Both minimum and maximum values are modified, in the opposite direction. This zooms in/out. |
![]() Zoom mode(CTRL+F6): In this mode, left-click drag using the mouse in order to draw a rectangle to zoom into. When the left-button is released, the displayed area corresponds to the area defined by the rectangle.
Zoom mode(CTRL+F6): In this mode, left-click drag using the mouse in order to draw a rectangle to zoom into. When the left-button is released, the displayed area corresponds to the area defined by the rectangle.
If the size of the rectangle is smaller than the active signal precision displayed in the window, the zoom is not completed.
![]() Cursor mode (CTRL+F7): In this mode, left-click on the cursor and drag it using the mouse in order to move it.
Cursor mode (CTRL+F7): In this mode, left-click on the cursor and drag it using the mouse in order to move it.
![]() Move mode (CTRL+F8): In this mode, left click on the window and use the mouse to drag.
Move mode (CTRL+F8): In this mode, left click on the window and use the mouse to drag.
![]() Rotate (CTRL+F9): In this mode, left-click on a 3D window and drag using the mouse to, change the orientation of the view. Left-right mouse dragging rotates the view around the Y-axis, top-bottom dragging around the X-axis.
Rotate (CTRL+F9): In this mode, left-click on a 3D window and drag using the mouse to, change the orientation of the view. Left-right mouse dragging rotates the view around the Y-axis, top-bottom dragging around the X-axis.
![]() Marker mode (CTRL+F10): In this mode, left-double clicking on a window adds the selected type of marker, - if compatible -, to this area at this position.
Marker mode (CTRL+F10): In this mode, left-double clicking on a window adds the selected type of marker, - if compatible -, to this area at this position.
.
 Layout selection: Allows selecting a layout from the active Layout list and display it.
 Reset Scale: Reset X, Y and Z axis scale of the active window to their default values.
Default values are:
- Y scale: Active input range
- X Scale: max bandwidth
- Z scale default profile/waterfall depth
Transducer group
Calibrate the sensor (only active in connected mode
See transducer and sensor page for details


