Addons:PV Diagram
 Add on : PV (pressure volume) diagram
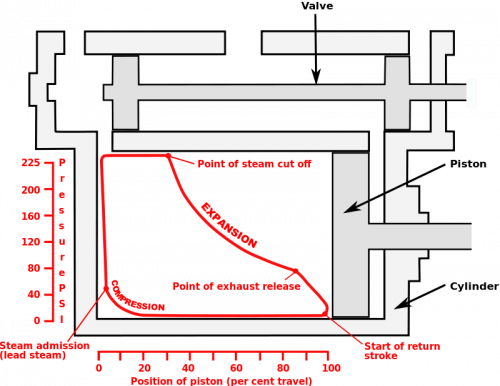
A pressure–volume diagram (or PV diagram, or volume–pressure loop) is used to describe corresponding changes in volume and pressure in a system.
The diagram records the pressure of steam versus the volume of steam in a cylinder, throughout a piston's cycle of motion in a steam engine. The diagram enables calculation of the work performed and thus can provide a measure of the power produced by the engine.
To exactly calculate the work done by the system it is necessary to calculate the integral of the pressure with respect to volume. One can often quickly calculate this using the PV diagram as it is simply the area enclosed by the cycle.
Download
Working with NVGate V15 or upper. Version from january 2022 : diagram PV
Include a model to demo with the correct settings.
How to use:
- Define one (or more) channel as a pressure.
- Add this channel into Sync. order (SOA) plug in.
- On SOA plug in , average, domain, select: "Angular"
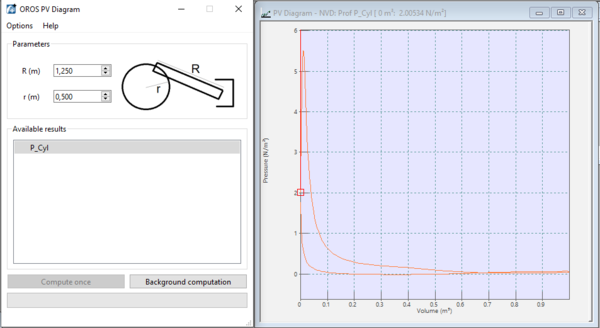
- Open PV_Diagram.exe
- Click on refresh (right click) in available results if you do not see anything.
- Select the input.
- Compute once will display the PV diagram base once based the last triggerd block.
- "background computation, will continuously compute the diagram.

