NVGate Report
REPORTS
Reporting
This release of NVGate introduces an entirely new reporting mode. Powered by the Vision interface and still based on the use of templates, the NVGate reporting toolset focuses on intuitive transfer of analyzer’s data, leaving to MSOffice the page setup and extra content.
Overview
The reporting tools are gathered in a dedicated tab called Reports. The Reports tab features 4 groups that offer respectively; the file selection (Word or Excel), the format of dropped data, contextual information and graphics preferences.
The report tab is divided in 3 sections:
- Automatic: Generates report automatically
- Operational: Select a template and refresh /print
- Creation: Format, references and graphics preferences
Printing a report
Generating a report consists on the following operations:
1. Select a template (or target file)
2. Update its content with NVGate measurements
3. Save or print the report
The Automatic report group makes the 1, 2 and 3 steps automatically.
The report templates are built up with the Reports tab, and then the report generation is available from the Measurement and Reports tabs.
Automatic report tools
The Automatic report group is located the left side of the Report ribbon.
It features 3 fully automated report generations and a batch function for multiple measurements reports
Print all windows
This function allows printing all the displayed graphs in a comprehensive report, without requiring setup any template. Simply press the All windows button to get your data plotted in a word file.
First, a location and name are requested for the report file.
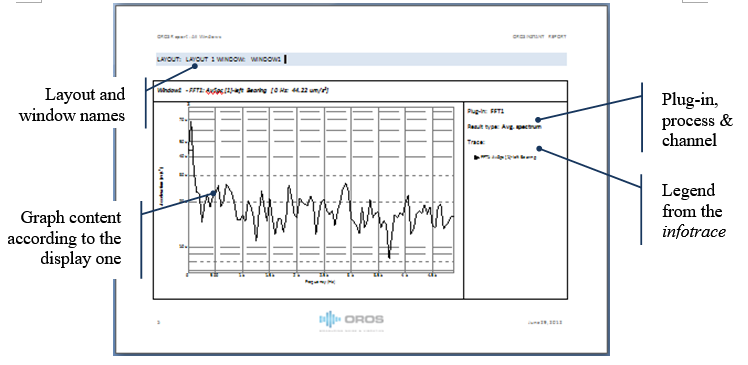
Secondly, the title of the report is requested. This text is displayed as the file title and in the header
Then for each existing Layout,
- for each opened Windows, the following page is appended:
Print all results (single)
This function allows printing all channel results in a comprehensive report, without requiring the setup of any template. The procedure is the same as the All windows report.
This function is useful for multi-analysis and multi-channel measurements report. It generates automatically a report with all the acquired and analyzed data. The user select the type of result to be printed be displaying at least one of the results in one layout of the current setup.
The function scans each layout to get the plug-in (FFTx, SOAx, OCT…) and the result type (Spectrum, RMS, trigger block…) of the first trace in each window (reference trace). Then it plots the same result type for each channel of the corresponding plug-in.
As an example working with inputs 1 to 8 connected to FFT and recorder with the following layouts:
- Layout 1
| Window 1: Front-end RMS input 1 to 8 | ||
| Window 2: Recorded signal input 4 and 8 | ||
| Layout 2 | ||
| Window 1: FFT Average spectrum input 1 | ||
| Window 2: FFT Trigger bloc input 1 | ||
The All results automatic report will print the following graphs:
Layout 1: Window 1 RMS level: Inputs 1 to 8 (8 plots)
Layout 1: Window 2 Recorded signal: inputs 1 to 8 (8 plots)
Layout 2: Window 1 FFT avg. spectra: inputs 1 to 8 (8 plots)
Layout 2: Window 2 FFT Trigger bloc: inputs 1 to 8 (8 plots)
The format of the reference trace is applied to each corresponding plot. In the case of cross function the reference trace will be used as the reference for each result (FRF, Coherence, etc.)
Note: the report format is the same as the All windows one
Print all results (compare)
The compare version of the print all result function allows comparing every measured results with a reference one.
In this case the reference trace will remain displayed while the other results are plotted within the same graph. This method scans the result exactly as the single version except it shows 2 traces per graph in the report.
Considerations for All windows and All results(x) automatic reports
The report generation is based on the content of the saved workbook. If your workbook has been changed without saving it (CTRL+D or Save project) the content of the report file will reflect the last saved workbook content.
The report is based on predefined templates. You may adapt these templates in order to change contents (ex: your company logo, or add specific setting or marker).
The original templates are located in the NVGate installation directory \ Template library. Copy the corresponding folder (All windows or All results) from this directory and paste it in the NVGate Data\ template library. The pasted file will be taken in account instead of the original ones.
The report generated with these methods may be updated from the NVGate GUI: Open the report file, select it from the report\active file group in NVGate and press Refresh button.
Batch measurement
The Batch measurement function allows printing all the saved results of a set of similar measurements. It is adapted to the exploitation of measurement campaigns. The batch measurement report is also used to format a set of measurements with the same presentation layouts.
The inputs are:
- A set of saved measurements
- A reference layouts
- A Word™/Excel™ template
The first operation consists of setting up one measurement in order to adjust the graphs format. Select one measurement and modify/enrich the layouts: graphs, scales, markers, windows/layout name, comments and properties. Click on Home/Start/Edit measurement button and save the edited measurement.
Secondly, create a Word™ template which fits the edited measurement. See the [Reference manual Vol. 3 Reports, Tools & ribbons] for instructions.
Third, select the measurements to be printed. Click on the Report/Automatic reports/Measurement batch button. The batch report selection dialog is showed (NB: it may take a few second to display if your project manager contains lot of projects/measurements).
This Dialog is divided in 3 areas, one for each input parameters and one for the output files
1. The selection of measurements to be printed selection.
2. The format to be applied on the processed measurement data (Layouts of a measurement from the Project manager)
3. The Word™ template to use for each generated report
4. The output options; directory and file name.
Last, print the reports. By selecting "Save layouts in measurements" each processed measurement will be updated with the format layouts. When these measurements are edited, the graph presentation is then homogeneous and corresponds to the report contents. By selecting "Discard layouts from measurements" the measurement layout are not modified.
Data selection
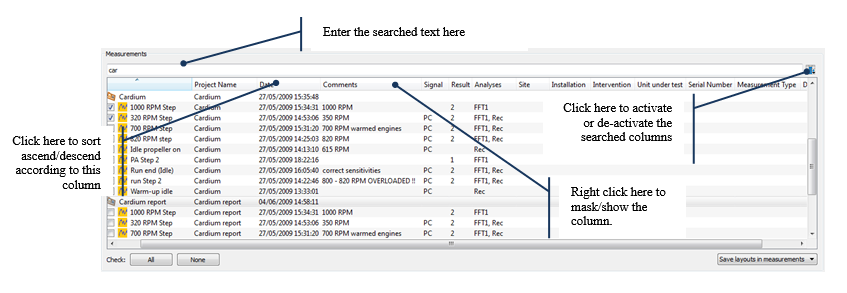
The measurements selection is helped by a search engine which filters the project manager measurements according to their properties.
The "measurement" frame reflects the project manager content. It is possible to expand or collapse the projects. The displayed measurements correspond to the following criteria:
- One of the active properties matches the search text,
- The measurement is already selected.
It is then possible to make mixed selection from various criteria. The properties are activated/deactivated (i.e. included in the search process) by selecting it with the button at the right of the search text.
It is also possible to mask/show the properties columns by right clicking on the header. The column order can be changed by drag and dropping one column to its new location.
The measurements are sorted by column content (alphanumerical sort) by left clicking on the column header.
"Active File" group
This group is used to select which file will be used for report and to update/print it.
The file must be opened and one of the following; Word or Excel (2003, 2007 and 2010).
To select the file, move the mouse over the File selection combo-box, the software will check the opened file on the computer a fill up the list. It is then possible to select the working template.
Building up a template
The Reports tab and others parts of the NVGate GUI are available to create a template or even to update an existing one for your reports.
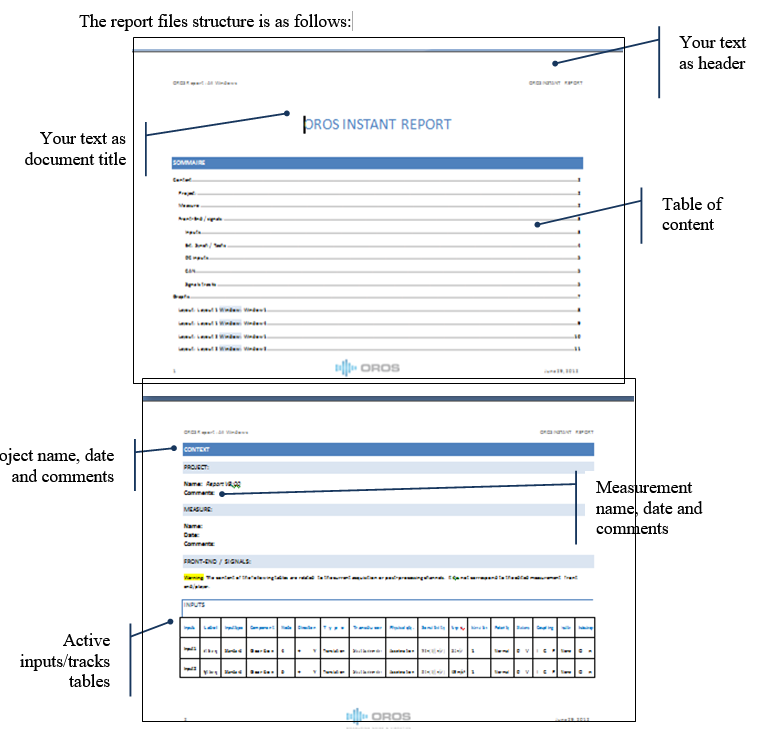
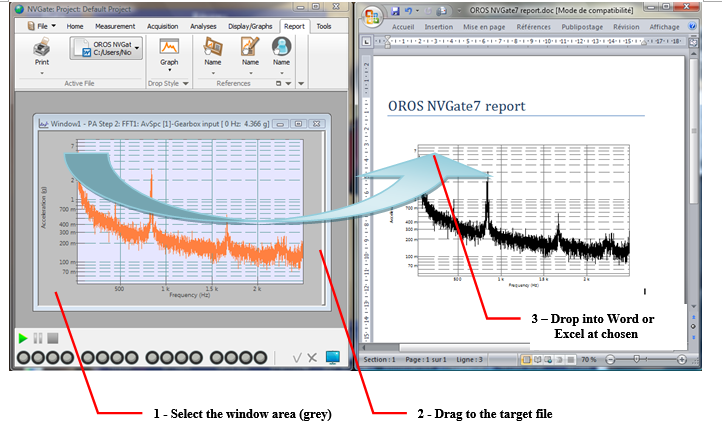
The operations are based on the use of Drag & Drop; Select an item from NVGate and drop it into the template. The software will add a TAG in the target file and then update it with the corresponding NVGate data.
Example: To add a graphical result(s) into a word document, click on the corresponding window area, then drag & drop it at the chosen location in the template:
While selecting an OROS Item for reporting, an icon is displayed on the cursor to confirm:
- this item is droppable in the report,
- the used format (drop style) in the report
Any text, image, table, link can be used in the template to enrich the report with results interpretation, corporate data, and others.
NVGate items are identified by a tag in the template. The tags are editable in Excel cells, hidden text in Word (apply the mode to see the tags) or replacement text for the images (select image format and then replacement text).
Example of tags:
|
For a window |
|
For a result dataset |
|
For a setting |
|
for a measurement comment. |
The tag must be kept complete i.e: the last part: [/] has to remain associated to the tag without carriage return between except for the multi-line reports. As soon as data are deposited in a template their format is 100% free. Size, color, font, location, insertion, etc… can be changed to ensure a coherent page setup with existing document or complies with a company charter.
Removing the tags will definitely remove the link between NVGate and the template (i.e. the item content is no more refreshed)
Available items for report
Most of the information that can be added to a template comes from the NVGate windows and analyzer setting trees (ASB and ASV). Drag & drop the selected Item to the target file in order to add the corresponding tag (and refreshable data) to the template.
"Drop style" group
This group allows defining the format of the data in the report file. Indeed, analysis results can be exported as data or graph as well as a setting format includes its name or units.
For results
- Graph will deposit an image of the dragged windows in the same way as the "copy/paste graph"
- Active Trace will deposit a table that contains the active trace data (X and Y) in the same way as the "copy/paste data/active trace"
- All Traces will deposit a table that contains all traces data (X and Y1, Y2, Yn…)
Note: advise not to use the Active Trace or All Traces for narrow band spectra within Word documents. It leads to a long process into Word.
For settings
- Label/Value/Unit will deposit the dragged setting in the described format. E.g: for the sensitivity of a channel;
- Label = Sensitivity (depending on the NVGate language)
- Value = 10m
- Unit = V/g (depending on the active preferences)
- Value (SI) will deposit the dragged setting value in the SI units (m, A,V, s, etc…). This options force the value to be expressed in SI.
The settings export is useful to build tables for the front-end or analyses setting in the report. Example:
| Input # | Label | Sensitivity | Transducer |
| 1 | Body Top Acc | 10 mV/g | PCB 35456 |
| 2 | Cyl 1 pres | 500 nN/m² | PRS 33 |
| Ext 1 | Torsion shaft1 | 1024 pulses/rev | OROS tach. |
Filled by NVGate reporting
For front-end
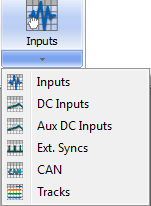
The Identifiers drop down button allows choosing one of the front-end input categories and deposit the corresponding table of settings in the report. Available tables are:
- Dynamic Inputs: Inputs
- Parametric inputs: DC and Aux DC inputs
- Trigger/Tach.: Ext. Synch (including the Aux ones)
- CAN parameter
- Player tracks (include all inputs categories)
The tables are filled in the report only if content exits (i.e.: the corresponding inputs or tracks are activated). If there is no corresponding content, the table is not visible.
The result will be as follows:
Note: you may adjust the table format into the report using the text orientation and adjustment for better results. OROS recommend using the landscape orientation for the report page which contains tables.
"References" group
In addition to the actual measurement setup and result data, a measurement must be identified and detailed by meta-data. This group provides such information to be inserted in the report.
The project and measurement identification allow locating the data in your computer or network. The date and comments remind the local context of the measurement. The user name is useful to check with the operator in case of misunderstanding.
==
Including properties in the reports====== The report toolset of NVGate allows inserting the properties values in the reports.
The properties tags are made available from the Report/References/Project and Measurements buttons.
Select More… from the corresponding Item, the following dialog is displayed.
Simply drag & drop the selected item to the Word™ or Excel™ file in order to get the current project or edited measurement properties value updated in the report
By default the measurement and project contains predefined properties:
- The OROS properties are automatically filled by NVGate: Date, Author, Protection, Project name, Signal location and Number and type of saved results.
- The OROS user properties are already created by NVGate. Their values, but must be filled by the operator: Comments, Site, Installation, Intervention, UUT, Serial number, Measurement type and Default type
The Users properties are created and filled by the operator while saving or by editing the properties. Their availability in the reports depends on their creation on your computer.
Automatic query
Some information or data does not have a place to be saved in a noise and vibration analyzer (e.g: unit under test S/N or duration of warm up). For this purpose NVGate7 propose to insert systematic queries in the report process reports. When a query exists, it will be asked to the operator and its answer will be inserted in the report.
Operations: Click on the Automatic query, a dialog is displayed:
The query can be issued (dropped) in the report document as many time as required. The question will be raised only once for each different query.
Auto increment row on Reports
It is now possible to add multiple acquisitions in one report. Typically designed for test of components set or assembled parts; such as end-winding or production quality check, this new feature operates with Excel reports.
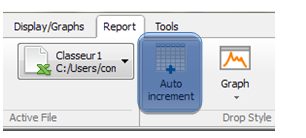
The basic idea is to increment the position of the results to the next empty row at each report refresh. For such purpose the standard report capabilities now offers an auto-increment row option. When this setting is activated the drag & drop tag in the report will include the auto-increment.
This function works with any item dropped to the Excel report (markers, data, graphs, settings, etc…).
Getting the frequency, amplitude and phase of a set of components (bump test) is now fast and secured using the auto-incremented marker table coupled with a sequence for the identification data.
The following example fills the test report of an end-winding bump test. The remote control user field settings have been used for measurement identification (blade # & side). A sequence is activated to update these settings for each bump. A peak marker has been used to collect the frequency and amplitude of each bump test.
After masking the report tags, the final report may looks like this:
Refresh report on end of analysis
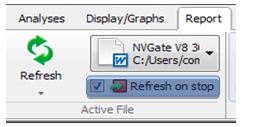
Once again OROS is enhancing your efficiency during measurement and analysis. This time we added a simple button which directly puts your result in the current opened report. By selecting this option no need to think about refreshing your report, it will remain up-to-date at any time.
Table format on Excel reports
Adding marker or inputs tables in an Excel report is a popular function of the NVGate report mode. It is now possible to define how the NVGate table will be arranged in the Excel sheet.
In the following examples we have 3 FRFs (1 hammer, 1 tri-axis accelerometer) per measurement point. We measure the highest peak amplitude, frequency and damping ratio on all FRFs at each measurement point.
The table format is governed by attributes in the NVGate Tag in the report file. After the drag & drop of the table in the report file, you can insert the following attributes<ref>To be inserted between quotes inside the tag brackets.</ref>
Flattened table
The first arrangement allows transposing the table in one unique line. This is useful with the auto-increment function when you are using multi-line table (ex: multiple traces) for each acquisition.
Regular report will provide this:
By adding the "TableStyle=Flat" to the NVGate tag:
[NVGate MarkerTable FRFs FRF "MarkerType=Peaks" "TableStyle=Flat"]Table[/]
The result is changed as follow:
Select columns
This arrangement allows selecting which columns to be printed in the report. For example if you do not need the interpolation information add the "TableColumns= " to the NVGate tag:
[NVGate MarkerTable FRFs FRF "MarkerType=Peaks" "TableStyle=Flat" '"TableColumns=1,2,4,5,7,8,9"']Table[/]
Assuming the column 3 and 6 are for the interpolation indicator, the table will look at:
Reports page setup
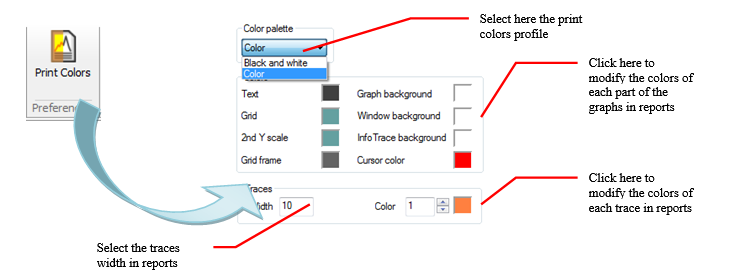
Reports are dedicated to be viewed out of the analysis software (electronic documents, paper, e-mails), then the NVGate dedicated color may be not suitable for this destinations.
Specific colors and traces widths preferences are used for the graphs in reports. Moreover, 2 different profiles allow managing both colored and black and white reports.
The Print color profile is saved in the active user preferences set. The changes apply to the active reports at each refreshment time.
Tools
Tools
The NVGate tools are gathered in the Tools tab.
Sequences
The sequencer is used to import/export/load/view an Excel® file that contains a series of steps. These steps are executed one by one. The sequencer is generally used to operate the Roving hammer impact for modal acquisition, for example.
=
Manage===== Opens the Sequence manager and displays the sequences list.
- Import: Imports a sequence from an Excel® file, to create a sequence in NVGate format. Sequences in NVGate format are stored in the "Sequence" directory.
Names of sequences in NVGate format are displayed by the sequence manager.
See Source format for more information about sequences in Excel®.
- Export: Exports selected sequence (in NVGate format) to Excel®.
- Load: Loads selected sequence. Only the loaded sequence can be executed or opened in the sequence viewer to perform a modal analysis.
- View: Opens the selected sequence in the Sequence viewer. Only the loaded sequence can be opened in the viewer.
A Sequence is a set of acquisitions. Each acquisition is a set of setting modifications, and it is associated to a measurement. When a measurement is performed, the acquisition associated with it, is called the current acquisition and is designated by the execution pointer (yellow arrow to the left of the sequence tree). At the end of each measurement, next acquisition becomes current and is executed to prepare the next measurement. When an acquisition is executed, all settings assigned to it are applied.
- Run/Pause
- When the sequence is not running, it is launched from the current acquisition. The current acquisition is executed to prepare the measurement.
Note: The Pause button operates at the inverse of the enable button in the sequence group ribbon.
- Reset
- Sets the execution pointer (which designates the current acquisition) to the first acquisition of the sequence.
Note: the reset button operates like the reset button in the sequence group ribbon
- Back to previous
- The acquisition preceding the current acquisition becomes current and is executed.
Disabled if sequence is running.
- Run next
- The acquisition following the current acquisition becomes current and is executed.
Disabled if the sequence is running.
Note: Next and previous button operates like the sequence browser arrows in the sequence group ribbon
- Jump to: Accessible by right-clicking on the acquisition. This acquisition becomes current.
- Delete: Deletes the selected acquisition.
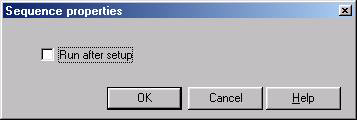
- Properties: Edits sequence properties.
When "Run after setup" is checked, a new measurement is launched automatically after the current acquisition is executed.
Source format
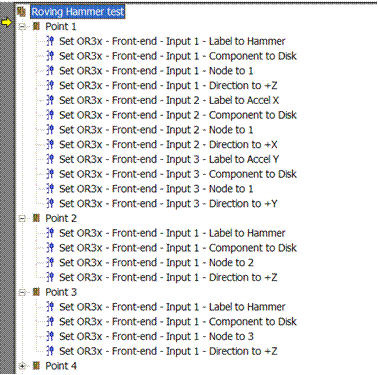
"Roving hammer test" sequence in Excel®.
"Roving hammer test" sequence in NVGate
The first Excel® cell is dedicated to sequence name.
The first column contains the name of acquisitions.
The second column contains, for each acquisition, the key words which identify the NVGate configuration sub-modules.
Second line is composed of the keywords, which identify the NVGate configuration’s settings.
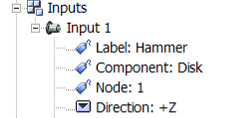
They can be found in the ASB.
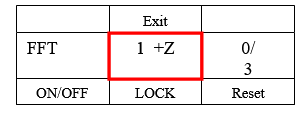
The column called ’Remote Node Label’ is the field displayed by the remote controller.
Menu ’Impact’ of the remote controller
These key words in the excel file, should be also defined in the Sequence.ini file which contains alias definitions. An IDNumber is associated to each setting. It can be retrieved from the ASB in NVGate by using shift + right click on the corresponding setting. Settings aliases could be modified by users.
Part of Sequence.ini file
Each couple (sub-module key word, setting keyword) designates a specific setting in the NVGate configuration. The value to assign to this setting is defined in the corresponding cell.
The semicolon character marks the rest of a line as a comment.
=
Enable===== Enable/disable the sequence execution. When the loaded sequence is enabled, the steps are executed each time the analyzer finish an acquisition/analysis (i.e: the general status switch to STOP)
=
Reset===== Reset the sequence to the initial step, execute it and disable the sequence
=
Browse===== Move to the next or previous step in the sequence. Disabled when the sequence is enabled.
=
Active sequence name===== Shows the loaded sequence name.
=
Current step===== Displays the name of the current step. The current step is the one which has been executed at the last stop.
Control Panel
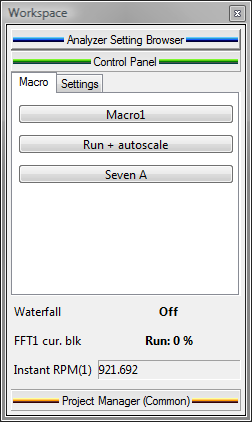
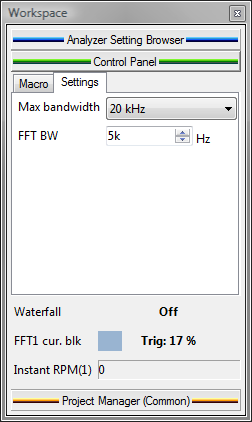
The configurable Workspace area provides quick access to settings and/or ASB status. It looks similar to the "Favorites" in Internet Explorer. The settings can be classified into customizable tabs. Overview
To configure the control panel, right click on the control panel and select Customize Control Panel or use the menu Tools \ Customize Control Panel.
Tabs
Setting
It is possible to create as many setting tabs as wanted. These tabs can contain settings or statuses (max 20).
Status
The status area is just above the buttons and is visible whatever a setting tab is selected. It can contain only statuses. Each time a plug-in is connected, the corresponding status bar is automatically added to the control panel.
Macro
This tab is dedicated to the "Macro" button.
=
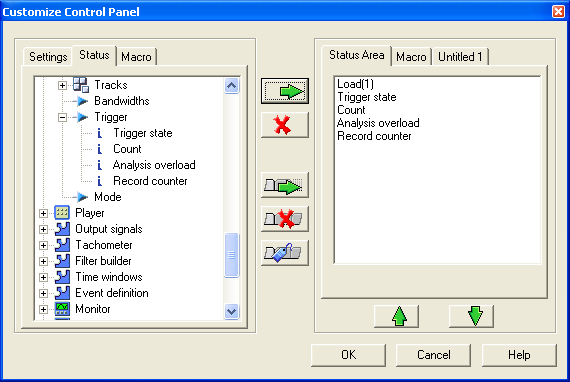
Customize===== The left part of the window contains the items that can be added to the control panel. The right part contains the tabs used to receive and organize these items.
- Settings tab: Displays all available settings in tree format similar to the Analyzer Setting Browser. Setting can be added only to the Settings tab.
- Status tab: Displays all available settings in tree format similar to the Analyzer Setting Browser. Status can be added to the Status area or to the Settings tab.
- Macro tab: Displays the list of available macros. Macros can only be added to the Macro tab.
- Add to Control panel
- This button adds the item selected (status, setting or macro) from the previous tabs to the control panel
- Remove
- Removes the selected item from the control panel.
- Create a new tab
- Creates a new tab used to contain settings or status.
- Remove a tab
- Removes the selected setting tab.
- Rename a tab
- Changes the name of the selected tab.
- Status Area: Displays all statuses that have been selected. The tab can only be used for statuses.
- Macro Tab: Displays all macros that have been selected. The tab can only be used for macros.
- Settings Tab: Displays all settings and statuses that have been selected.
- Push up/down the setting/status
- Used to change the order of the items in the current tab
Note:
- It is possible to change the name of the settings and status by right-clicking on the item and select Rename in the popup menu
- It is possible to use drag and drop to add items
=
Add setting===== Opens the customize control panel dialog on the Setting tabs.
=
Add Status===== Opens the customize control panel dialog on the Status tabs.
=
Add Macro===== Opens the customize control panel dialog on the Macro tabs.
Masks & Alarms
The Masks (also called Mask) are used to design a template for comparison with a measured result.
=
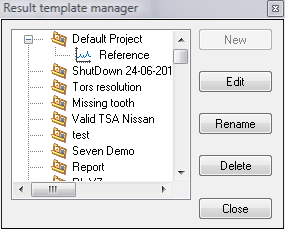
Manage===== Opens the Mask manager and displays the list of masks classified by project
- New: Creates a new mask in the project selected in the list. The "Masks settings" dialog box is displayed, in order to define masks characteristics.
Disabled if a template is already being edited.
- Edit: Edits the mask selected in the list.
See "Frequency narrow band mask settings" topic p 56.
- Rename: Renames the mask selected in the list.
- Delete: Deletes the template selected in the list.
=
Save===== Saves the mask loaded in the editor in the current project.
=
Save As===== Saves the mask with a new name in the current project.
=
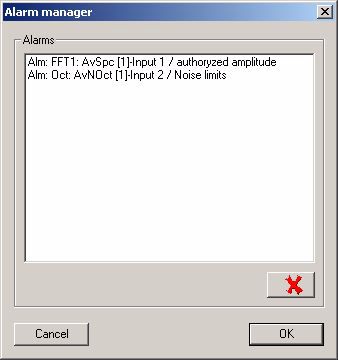
Manage alarms===== Opens a dialog box displaying the list of available alarms
Select an alarm and click the remove button
to remove the alarm.
=
Add Alarm===== Create a new comparison alarm in the active a graphic window. Disabled if the window does not contain a template result and a result coming from a plug-in.
=
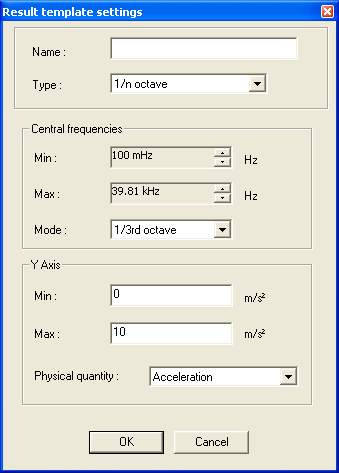
New===== Creates a new mask. The "Masks settings" dialog box is displayed, in order to define masks characteristics.
Disabled if a template is already edited.
Template types
Displays the type of the new mask. The different types are
- 1/n octave (available if 1/n octave plug-in analyzer is available)
- Profile
- Frequency narrow band (available if one or more FFT plug-in analyzer is available)
- Order narrow band (available if one or more synchronous order analysis plug-in analyzer is available)
/n octave mask settings
Central frequencies
- Min: Minimum value on X-axis.
- Max: Maximum value on X-axis.
- Mode: Defines the number of frequency bands. Available with 1/n octave template result only.
The possible values are
- Octave
- 1/3rd octave
- 1/12th octave
- 1/24th octave
Y axis
- Min: Minimum value on Y-axis.
- Max: Maximum value on Y-axis.
- Physical quantity: Physical quantity represented on Y-axis.
/n octave mask editor
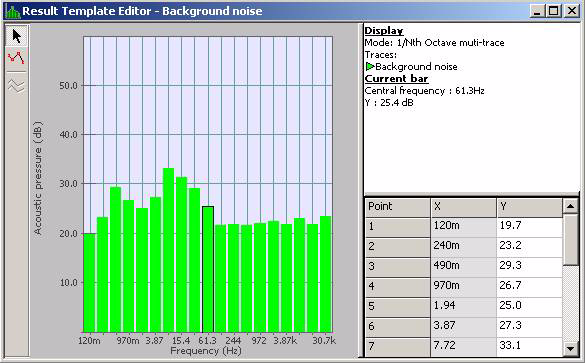
- Select a bar
- Switches to "Select" mode. Bar is selected by clicking on it. The selected bar can be resized by dragging and dropping.
- Select all bars
- Selects all bars of mask. All bars can be resized by resizing one of them. The same offset is applied to all bars.
- Y scale: Switches between linear and dB scale on the Y-axis.
Edit grid
- Select point: A click on a grid line selects the corresponding point in the graph area.
- Edit point: You may double-click on a cell to edit the X-coordinate or Y-coordinate of a point.
The Y-coordinate value is bound by the Y minimum and maximum values.
The X-coordinate value is bound by the previous and next point’s X-coordinate.
Clicking on another cell or pressing enter key validates a value.
- Paste special: The edit grid or a part of the edit grid may be filled by editing the grid content in Excel®, and then copying and pasting from the clipboard.
Only selected cells are updated, if the grid content is valid.
The X-coordinates of the first and last point cannot be edited. The corresponding cells are disabled.
The values used in the Excel® sheet must be specified in the current units.
Profile mask settings
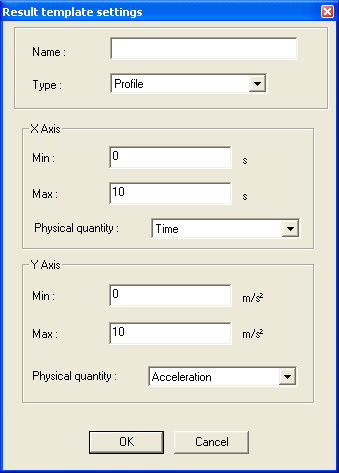
X axis
- Min: Minimum value on X-axis.
- Max: Maximum value on X-axis.
- Physical quantity: Physical quantity of the reference (represented on X axis).
Y axis
- Min: Minimum value on Y-axis.
- Max: Maximum value on Y-axis.
- Physical quantity: Physical quantity represented on Y-axis.
Profile mask editor
- Add a point
- Switches to "Add point" mode. In this mode, a new point is created by clicking in one of the two graph areas. A point with the same X-coordinate is added to the curve of the other graphic area. The Y-coordinate of this point is calculated by linear interpolation between previous and next point.
- Select a point
- Switches to "Select" mode. A point is selected by clicking on it. The selected point can be moved by dragging and dropping. The drop area is bound by the X-coordinates of the next and previous points, and the Y-axis minimum and maximum values.
When a point is selected in one of the two curves, the point with same X-coordinate is selected in the other curve. When a point is moved, the point with the same X-coordinate in the other curve is moved also, in order to keep the same X-coordinate.
The two end points can be translated on the Y-axis only. Their X-coordinates are the X-axis minimum and maximum values, respectively.
- Select all points
- Selects all points on both curves. A curve can be translated on the Y-axis by moving one of its points.
- Remove selected point
- Removes the selected point from both curves. The previous point becomes the new selected point. Not available if all points or one of the end points are selected.
- Add point: Used to add a point by right-clicking on the desired position. A point with the same X-coordinate is added in the other curve. The Y-coordinate of this point is calculated by linear interpolation between previous and next point.
- Remove point: Used to remove the designated point by right-clicking on it. The point with same X-coordinate is removed from the other curve.
Only available when the user has right-clicked a given point (except end points).
- Move point: Used to move the designated point by right-clicking on it. A left click in the graph area determines the new position of the point. The point with the same X-coordinate in the other curve is moved also, in order to keep the same X-coordinate
- Y scale: Switches between linear and dB scale on the Y-axis.
Edit grid
- Select point: By clicking on a grid line, you may select the corresponding point in the graph area.
- Edit point: Double-click on a cell to edit the X-coordinate module or phase. A cell can be also edited by selecting it and pressing the enter key.
The module value is bound by the module minimum and maximum values. The phase belongs to the range [-Pi,Pi]. The X-coordinate value is bound by the X-coordinate of the previous and next points.
A value is validated by clicking on another cell or pressing the enter key.
- Paste special: The edit grid or a part of the edit grid may be filled by editing the grid content in Excel®, and then copying and pasting from the clipboard.
Only selected cells are updated, if the grid content is valid.
The X-coordinates of the first and last point cannot be edited. The corresponding cells are disabled.
The values used in the Excel® sheet must be specified in the current units.
Frequency narrow band mask settings
Frequencies
- Min: Minimum value on X-axis.
- Max: Maximum value on X-axis.
Y axis
- Min: Minimum value on Y-axis.
- Max: Maximum value on Y-axis.
- Physical quantity: Physical quantity represented on Y-axis.
Settings
- Number of lines: Defines the number of lines.
This setting is particularly usefull to exploit Power Spectrum Density or Energy Spectrum Density
- Weighting window: defines the used weighting window. This setting is used to use mask in PSD units
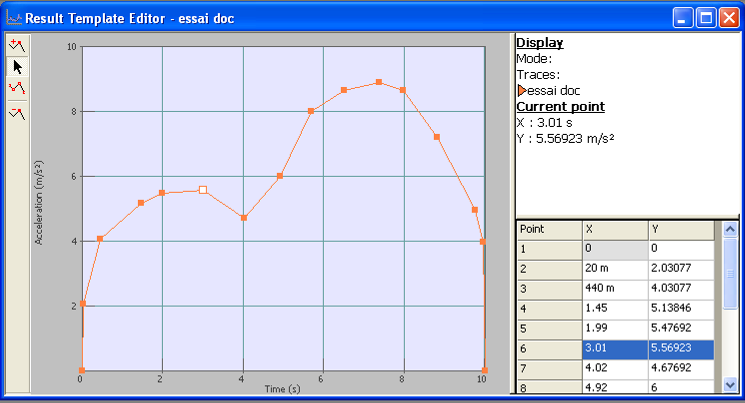
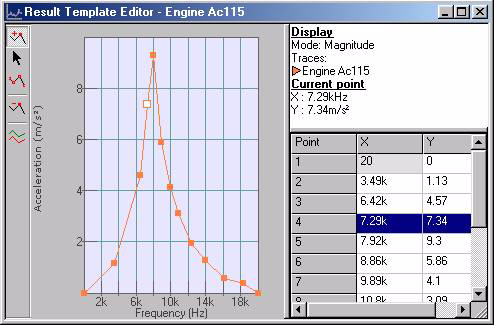
Frequency narrow band mask editor
- Add a point
- Switches to "Add point" mode. In this mode, a new point is created by clicking in the graph area.
- Select a point
- Switches to "Select" mode. The point is selected by clicking on it. It can be moved by dragging and dropping it. The drop area is limited by the next and previous point X-coordinates, and Y minimum and maximum values. The two end points can be translated on the Y-axis only. Their X-coordinates are the X minimum and maximum values, respectively.
- Select all points
- Selects all points of mask. The entire curve can be translated according to the Y-axis by moving one of its points.
- Remove selected point
- Removes the selected point. The previous point becomes the new selected point.
Not available if all points or one of the end points are selected.
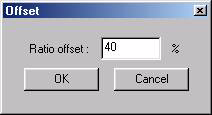
- Generate min-max mask
- Displays a dialog box used to generate a min-max mask from the mask edited, applying an offset ratio. The min-max mask is made up of two curves: from each point on the mask edited, two points with same X-coordinate are generated, applying the offset ratio negatively and positively on theY-coordinate.
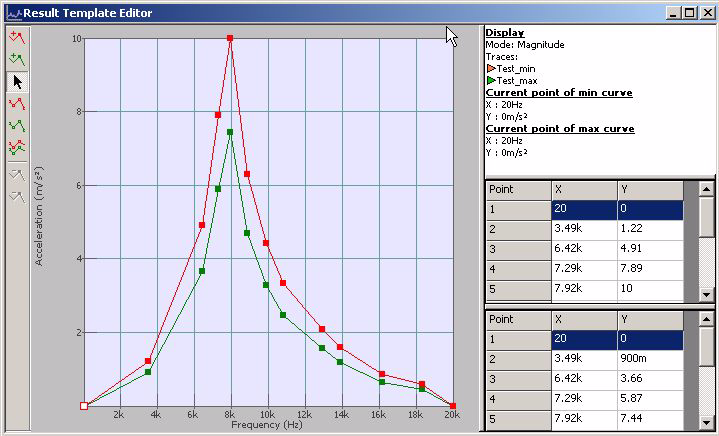
A click on the OK button changes the mask edited to a min-max mask, which is displayed in the editor (see Min-Max mask editor).
- Add point: Used to add a point by right-clicking on the desired position.
- Remove point: Used to remove the designated point by right clicking on it.
Only available when the user has right-clicked a given point (except end points).
- Move point: Used to move the designated point by right-clicking on it. A left-click in the graph area determines the new position of the point.
- Y scale: Switches between linear and dB scale on the Y-axis.
Edit grid
- Select point: Clicking on a grid line selects the corresponding point in the graph area.
- Edit point: A double-click on a cell is used to edit the X-coordinate or Y-coordinate of a point. A cell can be also edited by selecting it and pressing the enter key.
The Y-coordinate value is limited by the Y minimum and maximum values.
The X-coordinate value is limited by the X-coordinate of the previous and next point.
A value is validated by clicking on another cell or pressing the enter key.
- Paste special: The edit grid or a part of the edit grid may be filled by editing the grid content in Excel®, and then copying and pasting from the clipboard.
Only selected cells are updated, if the grid content is valid.
The X-coordinates of the first and last point cannot be edited. The corresponding cells are disabled.
The values used in the Excel® sheet must be specified in the current units.
Min-Max mask editor
- Add a point to top curve
- Switches to "Add point" mode. In this mode, a point is added to the top curve by clicking in the graph area.
- Add a point to bottom curve
- Switches to "Add point" mode. In this mode, a point is added to the bottom curve by clicking in the graph area.
- Select a point
- Switches to "Select" mode. A point is selected by clicking on it. The selected point can be moved by dragging and dropping. The drop area is bound by the X-coordinates of the next and previous points, and the Y axis minimum and maximum values. The two end points can be translated on Y axis only. Their X-coordinates are the X-axis minimum and maximum values, respectively.
- Select all points of top curve
- Selects all points of the top curve. The entire curve can be translated on the Y axis by moving one of its points.
- Select all points of bottom curve
- Selects all points of the bottom curve. The entire curve can be translated on the Y-axis by moving one of its points.
- Select all points of both curves
- Selects all points of both curves. Both curves can be translated on the Y-axis by moving one of their points.
- Remove selected point of top curve
Removes the selected point of top curve. The previous point becomes the new selected point.
Not available if all points or one of the end points are selected.
- Remove selected point of bottom curve
- Removes the selected point of bottom curve. The previous point becomes the new selected point.
Not available if all points or one of the end points are selected.
Edit grid
The editor contains two edit grids, one for each curve. The top and bottom grid are intended to edit the top and bottom curves, respectively.
- Select point: By clicking on a grid lines, you may select the corresponding point in the associated curve. A cell can be also edited by selecting it and pressing the enter key.
- Edit point: You may double-click on a cell to edit the X-coordinate or Y-coordinate of a point.
The Y-coordinate value is bound by the Y minimum and maximum values.
The X-coordinate value is bound by the previous and next point’s X-coordinate.
A value is validated by clicking on another cell or pressing enter key.
- Paste special: The edit grid or a part of the edit grid may be filled by editing the grid content in Excel®, and then copying and pasting from the clipboard.
Only selected cells are updated, if the grid content is valid.
The X-coordinates of the first and last point cannot be edited. The corresponding cells are disabled.
The values used in the Excel® sheet must be specified in the current units.
=
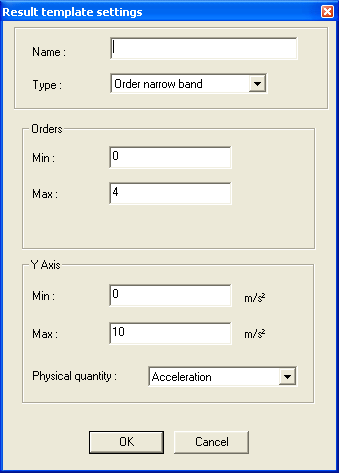
Order narrow band mask settings=====
Orders
- Min: Minimum value on X-axis.
- Max: Maximum value on X-axis.
Y axis
- Min: Minimum value on Y-axis.
- Max: Maximum value on Y-axis.
- Physical quantity: Physical quantity represented on Y-axis.
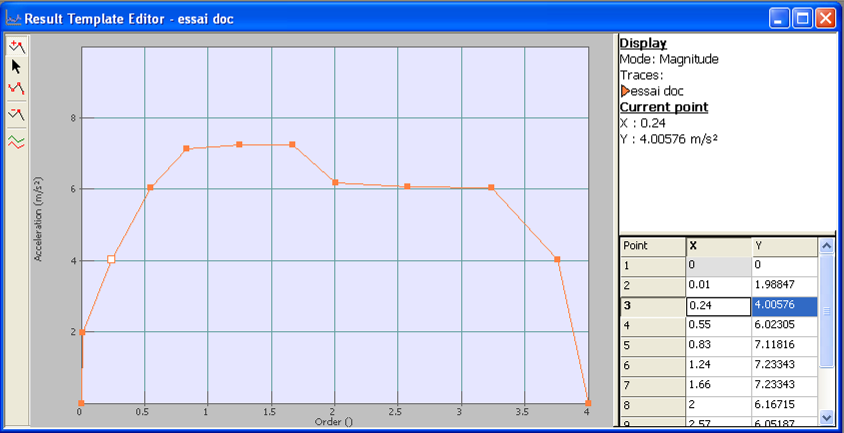
Order narrow band mask editor
- Add a point
- Switches to "Add point" mode. In this mode, a new point is created by clicking in the graph area.
- Select a point
- Switches to "Select" mode. The point is selected by clicking on it. It can be moved by dragging and dropping it. The drop area is limited by the next and previous point X-coordinates, and Y minimum and maximum values. The two end points can be translated on the Y-axis only. Their X-coordinates are the X minimum and maximum values, respectively.
- Select all points
- Selects all points of mask. The entire curve can be translated according to the Y-axis by moving one of its points.
- Remove selected point
- Removes the selected point. The previous point becomes the new selected point.
Not available if all points or one of the end points are selected.
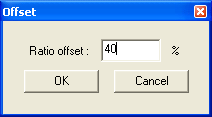
- Generate min-max mask
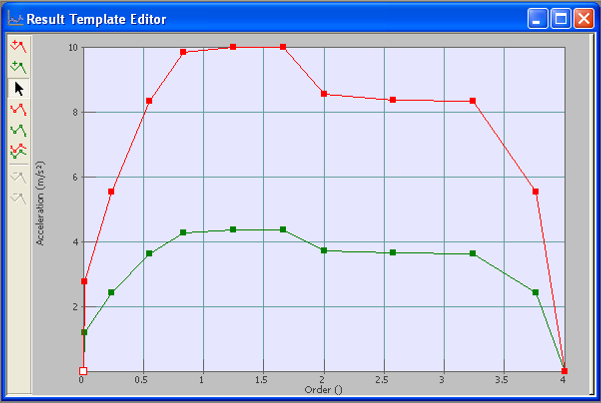
- Displays a dialog box used to generate a min-max mask from the mask edited, applying an offset ratio. The min-max mask is made up of two curves: from each point on the mask edited, two points with same X-coordinate are generated, applying the offset ratio negatively and positively on theY-coordinate.
A click on the OK button changes the mask edited to a min-max mask, which is displayed in the editor (see Min-Max mask editor).
- Add point: Used to add a point by right-clicking on the desired position.
- Remove point: Used to remove the designated point by right clicking on it.
Only available when the user has right-clicked a given point (except end points).
- Move point: Used to move the designated point by right-clicking on it. A left-click in the graph area determines the new position of the point.
- Y scale: Switches between linear and dB scale on the Y-axis.
Edit grid
- Select point: Clicking on a grid line selects the corresponding point in the graph area.
- Edit point: A double-click on a cell is used to edit the X-coordinate or Y-coordinate of a point. A cell can be also edited by selecting it and pressing the enter key.
The Y-coordinate value is limited by the Y minimum and maximum values.
The X-coordinate value is limited by the X-coordinate of the previous and next point.
A value is validated by clicking on another cell or pressing the enter key.
- Paste special: The edit grid or a part of the edit grid may be filled by editing the grid content in Excel®, and then copying and pasting from the clipboard.
Only selected cells are updated, if the grid content is valid.
The X-coordinates of the first and last point cannot be edited. The corresponding cells are disabled.
The values used in the Excel® sheet must be specified in the current units.
Virtual inputs
This group gives access to the real-time computation between channels.
See Chapter 2 ASB - § Sources Virtual inputs for details
Link
This part of the Tools tab provides a link to external software. One a target is selected, each mousse click on the Execute button launches the target software. As a reminder, the target software can be any executable file from windows (.bat, .exe, shortcuts, etc...). Simply add one target in the c:/OROS/NVGated Data/Links directory and you will be able to use directly for the NVGate interface
.
=
Select application:===== Displays the application selected within the list of applications available. All applications must be located in the directory Links.
=
Execute===== Runs the selected application.
Ribbons


