NVGate Ribbons overview
Ribbons Overview
The Vision interface gathers the analyzers functionalities in simple, clear and easy to identify tabs organized according to the main operations (First steps, measuring, results edition, configuration build-up, automation, general setup etc…).
Graphic user interface
Tabs & Groups
The Vision interface layer features 7 standard tabs. Each tab contains a set of groups which gathers settings, info and buttons about one topic (e.g. disk, FFT or transducers).
=====Actions:=====
The groups contain buttons, setting and check boxes of different types.
- Buttons: Left click on it lead to an action or open a dialog box.
- Examples:
for auto scale or
for inputs connection
- Status buttons: These buttons work like the standard ones but they can be activated or de-activated. They are used for changing a state. An activated button is slightly darkened.
- Examples:
that switches between on-line and post-analysis modes,
or
for enabling the marker manipulations.
- Settings: Provide a direct access to one of the ASB setting. Allow to continuously check the setup.
- Examples:
- Multi-actions: These buttons works as the standard ones but it is possible to
select their action from a list. When an action item is selected from the list, it became the default action of the button, the icon is changed.
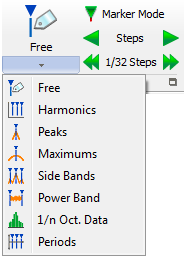
Examples are: Marker, or User selection.
Status buttons: These buttons change and show the status of the active element (windows, trace, etc..). Selecting one of the item in their list will apply this status to the active element. The status buttons change depending on the applied changes to the element (or change of element). It is useful to monitor and see immediately in what state is a 3D or the active user for ex.
Note: The buttons are highlighted when the mouse pointer pass over an active button.
On line help on Vision ribbons
The content of the Vision™ ribbons are connected to the on-line help.
In order to get help from one of the Vision element, activate the help mode by clicking on the upper right question mark. The cursor switches to a pointer + pointer marks. Then click on the desired item. The corresponding page of the reference manual will be opened.
Note that the latest pdf reader software are supported with NVGate V9.00: Acrobat reader 32 or 64 bits and Acrobat and any other pdf reader. The ability to open the manual at the corresponding pages is supported by Adobe™ products only. OROS recommend using acrobat reader using the on-line help functionality.
Minimize ribbon and full screen
In order to gain space on the NVGate screen during acquisition and analysis the NVGate ribbon can be minimized. It operates like in the MS Office suite:
Use the upper right arrow to minimize or reset the ribbon size. When the ribbon is minimized the tab header remains visible. Their content is accessible by clicking on the corresponding tab header.
The full screen function has been improved. It hides the application top bar as well as the windows bottom bar.
For gaining space, OROS recommend to undock the workspace and to hide it during standard operations. About 99% of the NVGate functions are accessible from the Vision™ ribbons.
File Menu
A unique "File" menu is available on upper left for input/output file operation. It allows loading/saving setups and provides access to the on-line help
Status bar
At the bottom of the screen a fixed status bar maintain a continuous monitoring of the inputs and analysis:
Tabs
Operation with Vision
With Vision the software entries are organized in a logical operations way. There is 7 different tabs corresponding to 3 main operations type:
1. Measure – Setup – Custom
2. Measurements
The principal goal the instrument is to measure noise and vibrations. The tabs corresponding to such operations are gathered at the top left of the interface: Home & Measurements.
3. Setup and fine tuning
This section of the Vision tab offers a clear way to build or modify a measurement or post-analysis configuration. That covers the main steps of a measurement setup. These steps are respectively managed by the Acquisition, Analyses and Display/Graphs tabs.
The "home" tab
This first tab features 2 mains services, which are proposed when entering the software (first time and regularly)
- Entering directly in the different modes of the software (start group)
- Set up the general options of the instrument (other groups).
Start Group
This group gathers the entry points for setup selection or building tools as well as the access to the different software modes (measurements editor, post analyze, model load).
New… Open the NVGate Start dialog which is dedicated to make the first steps in the software. The start dialog is also displayed at each NVGate Start until the user deactivated the option in the bottom left of the dialog.
It propose 3 tabs, the last selected tab will be active recalling this dialog.
Quick Tab
The quick tab load predefined setups of the instrument for either post-processing or on-line analysis.
The first column (1) is for the channel count selection. Selecting more channels than the actual configuration will not activate non-existing channels.
The second column (2) allows choosing a typical application. Activating the Waterfall check box will enable the gather results in the waterfall.
The third one select on-line acquisition (that run also in the office mode, simulating the inputs signals) or post-processing (a sample signal is provided)
Click on the Go button to load the predefine setup. This setup contains customized items:
- Layouts
- ASB setup
- Control panel
- Macros (called from the control panel)
The mapped directory is the quick directory in the workbook library which is defined in the NVGate Environment paths. Default is: C:\OROS\NVGate data\Workbook Library\Quick\.
Setups name should match one of the user selection combinations:
AAA_M_W_N
- AAA is the analysis mode (FFT, REC, ORD, etc..)
- M is the mode: O=On-line, P=Post-analysis
- W is present for the waterfall check box
- N is the number of channels
If the setup corresponding to the user selection does not exist, the "Go" button is disabled
Advanced Tab
This tab works like the quick one except that it shows user defined models. Actually the list maps a directory on the current computer which contains models.
The mapped directory is the advanced directory in the workbook library which is defined in the NVGate Environment paths. Default is: C:\OROS\NVGate data\Workbook Library\advanced\.
After saving a model the model directory can be copied at this location it will be proposed in the advanced tab. A text box is displayed while the mouse passes over the model. The content of this text box (flyover) are entered as the workbook comments prior to save it as a model.
Projects Tab
This tab allows recalling project from the project manager database with a selection of recent projects by selecting "load" and choosing one project in the list
In addition it allows starting the creation of a new setup for either post-analysis or on-line acquisition/analysis.
Select the Create new radio and choose on-line or post-analysis, the press "Go" to start the setup sequence.
Connect inputs: allows connecting the front-end signals to the different plug-ins. This is dedicated to on-lien acquisition and analysis. The inputs signals are connected (i.e: to be processed by.) to the plug-in according to the following table:
Type |
Tab | Compatible analysis plug-ins |
| Dynamic | Inputs, universal inputs (from Inputs tab), torsional, Virtual inputs | Recorder, Monitor, Virtual inputs, FFTx, SOAx, TDA, OCT, OVA, |
| Parametric | DC, CAN, universal inputs (from DC tab), Virtual DC | Recorder, Waterfall (Reference), Virtual DC |
| High resolution pulses | Ext sync | Recorder |
Connect Track: allows connecting the player tracks to the different plug-ins. This button replaces the Connect inputs one in the post analysis mode.
See Post-analyze command for operation
Post-analyze: allows connecting the recorded (or imported) signals as tracks to the different plug-ins for post-processing. The post analysis button indicates the software mode status:
(Enabled) indicate NVGate is in the post-processing mode
Clicking on the post-analysis button when it is enabled will switch to the on-line mode. Warning all existing tracks connection will be disabled without possible cancelation. It is recommended to save the current workbook prior to switch to post analysis.
(Disabled) indicates NVGate is in the on-line mode
Clicking on the post-analysis button when it is disabled will switch to the post-processing mode. Warning all existing front-end connection will be disabled without possible cancelation. It is recommended to save the current workbook prior to switch to post analysis.
Click on next to see the signal file selection dialog.
This dialog box shows all available signal files from the project manager data base. Once a signal file is selected, 4 different actions are possible:
Preview: Display the signal envelope (overview) in a new windows in the current layout. No analyses neither zoom are possible. Multiple files can be previewed at a time.
- Load in player: This will set the Player/Selected record/signal file with the current signal file. If the Player file or zoomed signal windows are already displayed with another signal file, the content of these windows is updated
- Load & Preview: Operate the Load in Player and display the signal in the Player file window. If a Player file or Zoomed file window is already present in the current layout, the content is updated.
- Post-analyze…: Applies the Load & Preview actions and shows the Track connection Dialog
Track connection dialog
In the post processing mode, the track signals are connected (i.e: to processed by..) to the plug-in according to the following table:
| Type | Tab | Compatible analysis plug-ins |
| Dynamic | Inputs | Recorder, Monitor, Virtual inputs, FFTx, SOAx, TDA, OCT, OVA, |
| Parametric | DC, CAN | Recorder, Waterfall (Reference), Virtual DC |
| High resolution edges | Ext sync | Recorder, signal Op. |
Edit Measurement: Load/Unload an existing measurement (i.e. a set of acquired/analyzed data with the measurement setup). The loaded measurement can be modified and saved. Editing a measurement allow modifying the results presentation (layouts, markers, masks, operators) and saving it in the measurement itself. The modified measurement can then be used for further reporting or for consultation.
The Edit Measurement button indicates the software active layer:
(Enabled) indicate a measurement is being edited: the layout and windows show the measured data and the ASV (Analyzer Setting Viewer) shows actual setting values at measurement time.
(Disabled) indicates that no measurement is edited. The current layout and windows show acquisition and/or analysis data.
Load Setup: Load an existing analyzer setup (a workbook or a model)
The available setups may come from the Models or even from existing project workbook. The models are not subject to unexpected modifications (as saving a project with modified settings).
The use of Models is recommended rather than the project ones.
Reset Workbook: Reset entirely the acquisition and analysis setting to their default value.
View group
Controls for the general interface windows arrangement.
Full screen: Put the active windows in full screen mode. The NVGate frame windows will take the whole screen space. The full screen is inactivated by clicking on it or in reducing the window with the upper right button
- Environment windows: These check boxes control the visibility of windows that provide control/command area:
Workspace: show/Hide the workspace windows that contains the Analyzer Setting Browser (ASB), the Project Manager (PM) and the Control Panel (CP).
Only one panel is displayed at a time. The user may switch between panels by clicking on the title bar of the desired sheet.
Log window: This windows track all changes in the analyzer. Logs are arranged in 3 separate tabs:
- Analyzer settings: Display all users’ and dependencies related changes in the ASB.
- Warning: Displays dynamic warnings related to the current setup (ex A & C acoustic filters are no more available when the sampling frequency is lower than 25.6 kHz). Raising a warning will automatically show the log window during 3 sec.
- Macro trace: log window for macro execution and debugging.
Recommended location: Bottom, Docked
Status: Displays the current status of the plug-ins (see chapter 1 ASB for details). General statuses are displayed in the bottom status bar, the Status window is made to show advanced status for accurate control of the acquisition/analyses. To add the statuses in this window, right click in the selected plug-in and select View states
Recommended location: Bottom, Docked
Example for the FFT plug in you may display:
- Block Overload: corresponds to the instantaneous overload indication within 1 FFT trigger block, for instance during a few milliseconds overload occurred, the current trigger block indicates overload, the following trigger block may not have any overload so indication "no overload" will be seen
- Analysis Overload: corresponds to overload indication over the measurement period. It means that during the whole measurement period there was (or not) an overload.
For instance: during a measurement, a short overload occurs, Block Overload will indicate "Overload on Channel x", Analysis Overload will indicate "Overload on Channel x", after overload occurred, Block Overload will indicate "No Overload", Analysis Overload will indicate "Overload on Channel x".
When pressing run again, Block Overload and Analysis Overload status will be reset.
When using Automatic overload rejection in FFT, Analysis Overload status take into account any occurring overload despite FFT block rejecting them for FFT calculation, the user will anyhow keep a trace of occurred overload.
These windows can be docked or floating. Environment windows are to be displayed temporarily for advanced setup. It is recommended to hide these windows for standard measurement/analyses.
Preferences group
These buttons provide direct access to the user’s preferences.
The user’s preferences are gathered in one unique dialog with multiple tabs. It is possible to navigate in these tabs from any of the entry point (the described buttons). See Chapter 7 User’s Preferences for details
General: Enter the preferences setting at the 1st tab. It allows customizing the scales font size, the refreshing speed as well as default specialized modes
Units & Quantities: Open the physical quantity tabs of the user’s preferences. It allows creating, modifying and removing the units and physical quantities used by the NVGate interface. Reminder: NVGate process SI units. The selected Units with are used for display only, the data are not modified by the units changes.
Data Management: Open the measurement properties setup. This tool allows managing the default and user defined properties. These property values are saved with the measurement and used to qualify it. Later, they may be incorporated into reports and for search functions.
Disk group
PC and Mobi-Disc management tools
Active Disk: Select the active disk. The active disk is the one which is mapped by the project manager. The disk where a signal file is located must be the active one in order to load it on the player (play back, post process, exploration). The active disk can be:
The PC one. Available in office mode only.
One of the Mobi-disk connected through a USB cable. Available in office mode only.
The Analyzer disk (Mobi-Disk or fixed). Available in connected mode only.
Manage: Open the disk manager in order to manage the signal files saved on it. See "Disk management" topic from Chapter 3: "Hardware Management" for details.
Format: Format the active disc. Attention all saved data on the formatted disk will be definitely deleted. Not available when PC disk is selected. See "Disk management" topic from Chapter 3: "Hardware Management" for details.
Download: Select available signal file on the active disk that match the project present on the project manager. To recover signal files from a record session made with another PC use the manage button. See "Disk management" topic from Chapter 3: "Hardware Management" for details.
User group
NVGate operates with users’ preferences and authorizations. Personalized profiles can be memorized and recalled while starting the software.
A user profile contains:
- Default display preferences (colors, scale type, mode, units, etc..)
- Saving modes (default name, incrementing, confirmation mode, data protection and visibility)
- Waterfall (view, default reference, colors, extractions, filling and type)
- Marker (colors, limits, interpolation)
- Report colors palette
- Units for each physical quantity
- Export modes
- Floating/docked windows location and visibility
The User group allows managing NVGate users’ profiles.
User button Part 1: It allows selecting the current user. Attention changing from one user to another one will reset the current NVGate analysis configuration to the default one defined by the new user.
User button Part2: It allows creating and deleting users from the active .usr profile files.
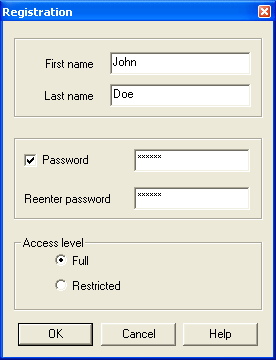
- New: Used to create a new user
First name: First name of the user may be left empty. The first name is automatically formatted so that the first character is in upper case and the others are in lower case letters.
Last name: Last name of the user must be filled in. The last name is automatically formatted in letters.
Password: If selected, the user will have to enter his password to launch NVGate
Access level
-Full: The user is not limited within NVGate
-Restricted: The user is not authorized to access to all the functions of NVGate. The main characteristics of this type of user are:
| Authorized actions | Unauthorized actions |
|
|
Administrator: Allows Switching to a non-restricted user profile for administration of the current restricted user rights. In this case the current analyzer setup is not modified.
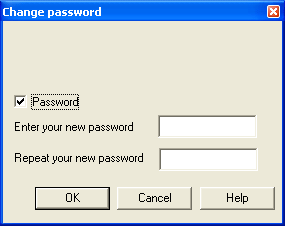
Password: Used to change the password. If necessary, the user must enter his current password and then enter the new password twice
Warning: Due to the GUI modifications, the restricted user profile limitations do not apply on NVGate version 7.00 and further until new notification. It is possible to run NVGate7 with the Legacy V6.00 interface to benefit from the restricted user capabilities. For such purpose runs NVGate7 with the following parameter: -legacy
By default the user is named ’Default user". User
The user profiles are saved in a file called NVGate.usr located in the NVGate.exe directory. This file is automatically created at NVGate start when it is absent. Attention: deleting the NVGate.usr file delete all users’ preferences including the default setting proposed by OROS.
It is possible to temporary change .usr file for special applications. To start NVGate with .usr different from the default one (NVGAte.usr) add the following to the command line: -usr=myfile.
Transducer group
This group manages the transducers database which is used by NVGate to automatically setup the inputs and trace front-end status at measurement time.
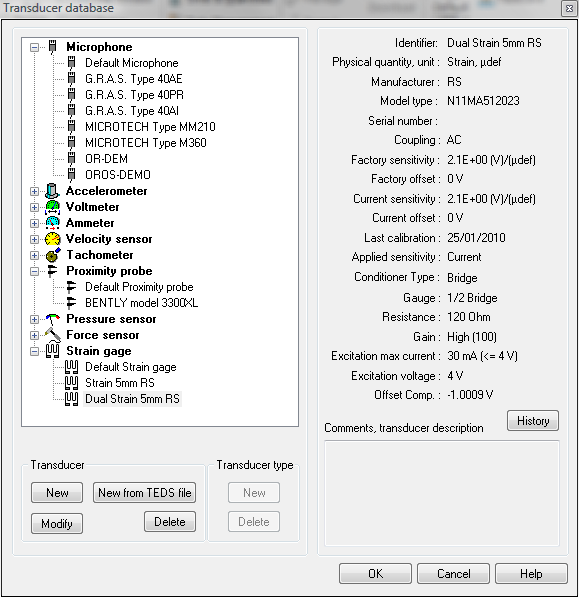
Database: Opens the transducer database dialog The left side displays all the transducers in the database in a tree form. They are grouped by type. For each type of transducer, there is a default transducer. The right side displays the information about the selected transducer.
- New: This button is available when a transducer or a transducer type is selected. It is called the "new transducer" dialog box. If a transducer is selected, all information related to the transducer is applied to the new transducer.
- New from TEDS file: This button allows opening a file .ted and so creating a new transducer with its characteristics in the transducers database.
- Delete: This button is not available when a default transducer is selected. It removes the selected transducer from the database.
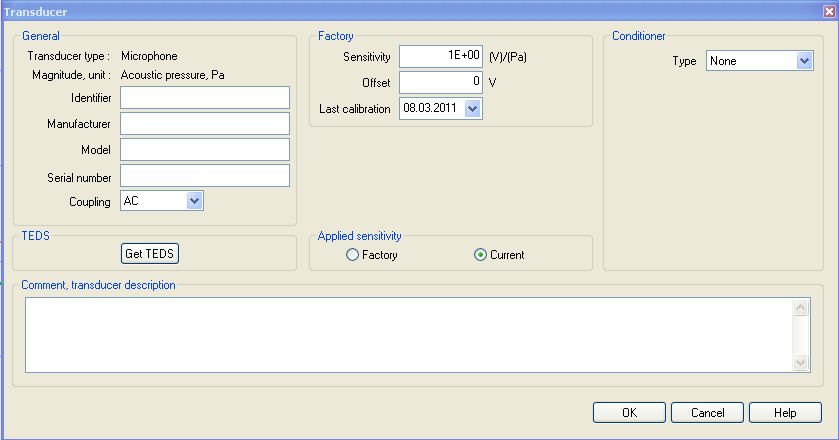
- Modify: This button is not available when a default transducer is selected. It is used to modify the characteristics of the transducer. Clicking on the modify or new button opens the transducer definition dialog box:
- Transducer type: Can be a pre-defined type (microphone, accelerometer...) or a user-defined type.
- General:
Magnitude, unit: Magnitude and unit associated with the transducer type
Identifier: Name that will be used to identify the transducer. This identifier must be unique. This is the only field that must be filled in. The others contain optional information.
Manufacturer: Name of the company that manufactures the transducer.
Model: Identifies the transducer.
Serial number: Unique identification, this must appear on the transducer itself.
Coupling: When the transducer is connected to an input, this coupling will automatically be set.
- TEDS:
By clicking on Get TEDS, a file .ted can be selected to set automatically the characteristic values of the transducer.
- Factory values: Sensitivity, offset, last calibration.
These values can usually be found on the calibration chart of the transducer. For maintenance calibration, use the update button to set the new values
- Current values: Sensitivity, offset, last calibration.
Displays the current sensitivity and offset. The update button may be used to set new values, in the event the transducer is not calibrated with NVGate.
The history button is used to retrieve all calibrations that have been performed on the transducer.
- Applied sensitivity:
Factory: applies sensitivity of the calibration chart of the transducer.
Current: applies sensitivity read on the TEDS file of the transducer.
- Comment, transducer description: Free text area
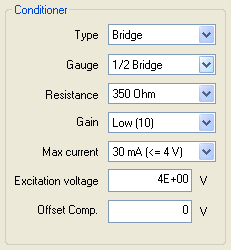
- Conditioner: Has to be change if you use and X-Pod conditioner. The XPod is a device that can be fixed on the OR362/OR382 side.
- Type: bridge signal conditioning for strain gauges, dynamic pressure, force and acceleration measurements.
- Gauge type: Full, Half or Quarter bridge mount. The completion resistors are included in the Xpod,
- Resistance: Bridge completion resistor: 120 or 350 Ohms for quarter bridge mount.
- Gain: Bridge gain: 10 or 100 depending on the required precision and range.
- Max current: the provided current can be limited to 30 mA up to 4 V and 12 mA up to 10 V.
- Excitation voltage: Each Xpod provides an excitation voltage from 0 to 10 V.
- Offset Comp.: Bridge offset comp: Can be used for manual balance of the bridge,
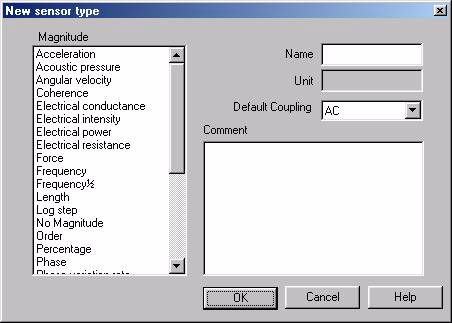
- New Transducer Type: This button is available when a transducer type is selected. A new transducer type is necessary when the pre-defined type does not fit the needs. It is used to gather transducers with the same magnitude.
- Magnitude: Magnitude that will be associated with the transducer type and all transducers of this type.
- Name: This name will be used to identify the type. It must be unique.
- Unit: Current unit of the magnitude.
- Default coupling: default coupling value that will be used when a new transducer is created. This value can be changed individually.
- Comment: Free text area
History: This tool is used to see how transducer sensitivity and offset change over time. Information about every calibration is displayed, making it easy for the user to see if the transducer behavior is constant.
- Current sensitivity: This is the sensitivity level obtained during the last calibration. If the transducer has never been calibrated, the factory sensitivity is selected. This sensitivity is used when the transducer is selected on an input
- Current offset: This is the offset obtained during the last calibration. If the transducer has never been calibrated, the offset sensitivity is selected. This offset is used when the transducer is selected on an input
- Graph: Displays the calibration values. A pop-up menu is available by right clicking on the graph.
It is used to select the sensitivity graph, the offset graph or both. It is also possible to hide/display the factory values. There is also a marker to highlight the calibration.
Merge multiple transducer databases into one. The merged TDB is the one currently used by NVGate (file: transducers.tdb located in the NVGate.exe directory) Clicking on Merge open the database to merge browser. Both native (.cdb) and comma separated values (.txt) formats are available. For the csv, the format is the same as the export one, with one line per transducer.
In case of conflict (the same transducer does not features the same setup in the 2 databases) a specific dialog box is proposed.
Only conflict lines are displayed.
- On the left side the current NVGate® database called Mine
- On the right side the imported one called Theirs
The non-matching settings are written in red, and the current choice (the one which will be saved) is shown on a green background. The default choice is to save the current NVGate® settings (Mine).
The operator may apply 3 types of operations, selected by a right click on the line of interest:
- Use mine: The current NVGate® setting is kept. The calibration histories from the imported and current database are merged.
- Use theirs: The imported setting will be applied and saved. The calibration histories from the imported and current database are merged.
- Do nothing: The corresponding transducer is ignored and nothing is changed
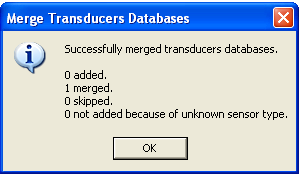
At the end of the merge operation a summary of the modification is presented
Export: Allows exporting the current database (file: transducers.tdb located in the NVGate.exe directory) in csv format.
The exported file contains one line per transducer with the following field.
Only the latest site calibration information are exported in the txt file.
D-Rec group
This group manages D-rec (Direct recording) setups. D-rec allows recording signals with the analyzer without any PC or connection.
New: Create a new recording configuration and save it in the analyzer memory. From this button, NVGate will propose a set of dialog boxes that guide the user through the necessary settings to build a D-rec setup. The displayed dialogs are the following:
1. Channels connection
2. Event connections
3. Recorder properties
4. Records setup management
Item #1 and #3 are exactly the same as the standard ASB dialogs for the channels connection and the recorder setup.
Item #2 is also the same but only a subset of the events is handled by D-rec: Recorder trigger on Edge on Ext. synch, Level and delta level on DC inputs and periodic event only.
Item #4 allows managing the setups saved in the analyzer. (See Setup below for details)
Setup: Manages the D-rec Setups through the following dialog box. The D-rec setups can be written, removed, imported and exported from this dialog box. To write an NVGate configuration in the hardware, press the "Add current setup" button. The current front-end and recorder settings will be saved in the analyzer. Note that all active channels (IN, DC, EXT and CAN) will automatically be connected to the recorder tracks.
The Delete button removes definitely the selected setup(s) from the analyzer memory".
One of the D-rec setups saved in the analyzer can be set as the default setup when starting the D-rec. Check it in the "Default" column. The default setup is loaded when the operator
Each setup can be exported in text file to be used as a reference of the D-rec settings when using it on-site to match the transducers and cables. To create a description file, use the "Export as txt" button.
It is possible to recover, control or modify an existing D-rec setup which is already saved in the analyzer. The "Import in ASB" function will overwrite the current ASB with the configuration saved in the analyzer.
The "Measurement" tab
This tab is dedicated to be used during measurement time, featuring useful tools used during this step. This tab occurs naturally after the Home one and its Start group.
The measurement tab offers powerful controls and commands for:
- Monitoring Traces, Windows and Layouts scanner to keep an eye on any signal and analysis results
- Recording with arming and target selection (off, on analyzer, on PC)
- Front-end control, with an easy access to Check ICP, Check TEDS, Calibration, Bridge balance and the sampling frequency control
- Saving data with trace memorization, saved result selection and print report buttons.
Control group
These settings control the general analyzer status and the recorder activity
Run: (CTRL+R) This button control the general analysis and recording start. The plug-in with connected channels/tracks will start their process one the run is activated.
Note: The monitor and the Time Domain Analysis (in free run mode) process is continuous; it do not depends on the run status.
Note: the trigger/start status of the plug-ins may block their process, waiting for an event.
Warning: Pressing the run button during an analysis lead to reset all current analyses, restarting all averages from 0. The analyzed data will be lost.
Pause: (Pause): Suspend or un-suspend the current analysis.
Note: If the recorder is running, its starts / finishes a record.
Stop: (CTRL+S) Stops all the current analyses and recording.
After requesting a stop, the plug-ins finished their current block. When all the plug-ins has switched to Stopped the analyzer switch to the Stopped status
Note: The analyzed results and recorded signal are saved when the analyzer switch to stop. This is the default behavior. It may be changed from the user preferences (see user preferences chapter)
Note that another Run/Pause/Stop button is always available in the status bar (bottom left)
Arm: (CTRL+SHIFT+R) Arm the recorder. Prepare the recorder to start immediately on the run. Arming process can lap a few seconds.
Note: modifying a setting of the analyzer will disable the arming. It is then necessary to re-arm it.
If the recorder is not armed, it will take a few second to achieve the arming prior to effectively start recording the data.
- Note: the recoer can be armed from the ASB: (Recorder /Trigger/ Recorder) See Chapter 1 ASB - § Recorder/Trigger settings for details.
Manual trigger: (CTRL+T) generate a manual trigger event. This event is available for the event list and can be associated to the plug-in triggers (start/stop or trigger). See acquisition tab description.
Warning: While the manual trigger is not associated to a plug-in, it has no effect.
Record status: Controls the recorder location and activity.
- If the setting is set to Off, the icon is grayed
- If the setting is set to PC, the data are recorded on the PC HDD
- If the setting is set to Analyzer
Record mark: Allow adding a mark with comments while recording. These marks are available when the signal file is edited.
Front-end group
Control/command of the general acquisition setup.
Auto-range (CTRL+SHIFT+A). Controls and start the auto-ranging procedure. See Chapter 1 ASB § Front-end/Auto-range for details
Check ICP: Checks if an ICP transducer is correctly connected to each input for which the coupling is set to ICP. It measure the DC polarization voltage through time averaging and opens a window with the results:
- Short circuit: DC voltage < 4V (the sensor may be faulty)
- ICP detected: DC voltage between 4V and 20V (an ICP sensor is detected)
- No connection: DC voltage > 20V (no ICP sensor is detected), open circuit
- Un-stabilized input: DC voltage was not stabilized after 40 s.
See Chapter 1 ASB - § front-end/inputs settings for details.
Bridge auto-zero: Balance the inputs connected through the Wheatstone bridge Xpod. See Chapter 1 ASB - § front-end/inputs settings for details.
Control/command the Front-end sampling frequency.
Note: The plug-in analyzer and the recorder can reduce respective their bandwidths independently. This setting fixes the acquisition time accuracy and fixes the max signal bandwidth. See Chapter 1 ASB - § front-end/inputs settings for details.
Save group
Manages the results and signal saving and allows direct report generation.
Print Report. This button refreshes the content of the active report document (Word or Excel) and prints it to the default printer. See Chapter 5 Report & tools § Reporting for details.
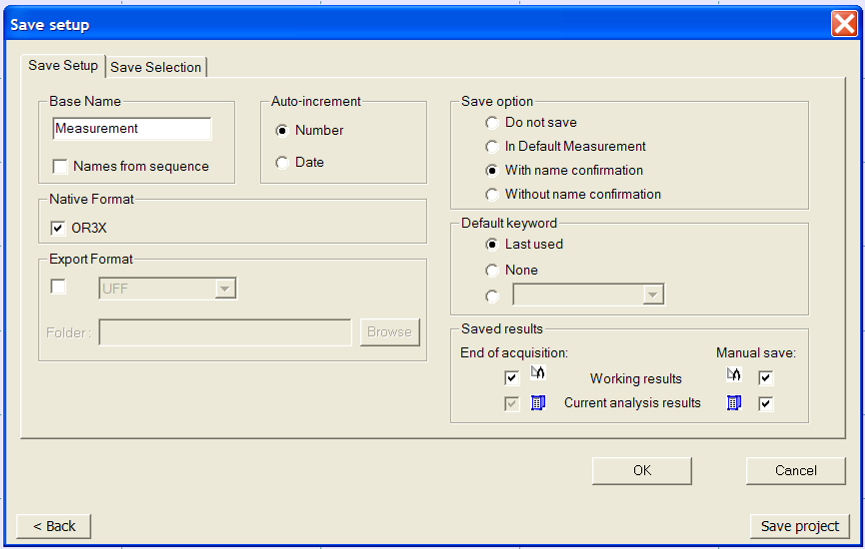
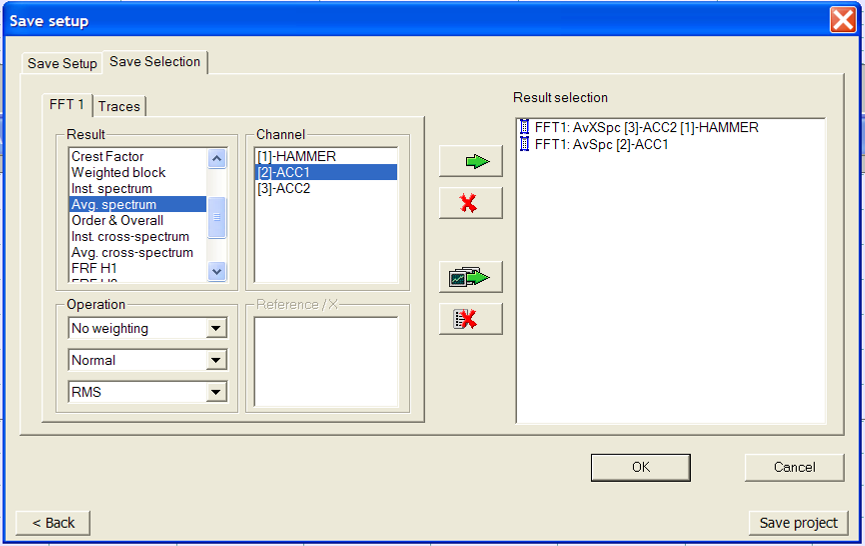
Save setup: Defines the way the result and signal are saved. It opens the Save setup dialog which contains 2 tabs.
Save setup tab:
- B
- Base name: The name the new measurement will have. A suffix is automatically added to the name if the specified name is already in use.
- Names from sequence: Select this option to link the measurement name to the corresponding sequence fields of the sequence currently in use.
See also "Sequence" topic from Chapter 5: Reports & Tools.
- Native format: Determines whether the measurement should be saved in OR3x format. If not selected, the new measurement will not appear in the project manager.
- Export format: Used to export the new measurement in an external format. A folder must be specified to receive the converted result.
See more details about the export formats in the "Export" topic from the "Chapter 7: User preferences".
- Auto-increment: Used to insure the new measurement has a unique name.
| Number | Adds a number to the Base name. The first available increment is used |
| Date | Adds date information to the Base name. The date format is dd-mm-yyyy hh’mm’ss" or mm-dd-yy hh’mm’ss according to the regional settings of the PC |
- Save option: This option determines the way in which the measurement will be created when the analyzer stops
| Do not save | No measurement will be created. The only way to save the results selected is to perform the Save Result command manually |
| In default measurement | The measurement is created with the name "Default measurement". If a measurement with this name already exists, it is overwritten. |
| With name confirmation | A dialog box will be displayed when the analyzer stops. It will suggest a name using a Base name and an auto increment choice. |
| Without name confirmation | The measurement is created with a name automatically generated from the Base name and the auto increment choice. |
- Default keyword: Used to choose the keyword that will be associated with the new measurement. Refer to the preference section for more information.
- Saved Results
- Current Analysis result: Results obtained from an acquisition.
- End of acquisition: open automatically a dialog box to save the results when the analyzer stops.
- Manually: allow to save the results manually.
- Working results: Results obtained after an operation based on already saved analysis results, for example a result calculated with an operator.
These results can be only saved manually.
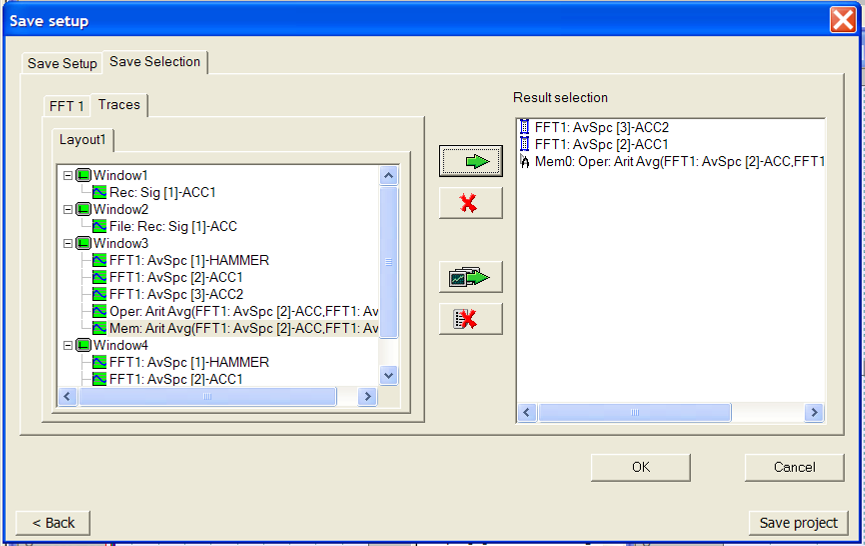
Save selection tab:
Results provided by the plug-ins
- Result selection: List of results provided by the plug-in analyzer selected. Multiple plug-ins may be selected if all results selected are compatible (which means that they can be displayed in the same result window).
- Channel selection: List of plug-in analyzer channels connected, available for the result selected.
- Operation: in the top combo-box, list of weighting that can be applied to results selected. In the middle combo-box, list of derivation/integration operations which can be applied. In the bottom combo-box, list of display units.
- Reference / X: List of plug-in analyzer channels connected. This can be the reference. Available for results that require a reference only (cross-spectrum, for example).
- Tracked order: List of tracked orders on channel selected. Available if result selected is an order result.
- Traces
List of traces available in the project coming from current analysis results and working results.
Save measurement: : Save the result and signal. The result/signal can be saved when:
- There is at least one result selected in the save selection,
- The analyzer is stopped
- The results exists
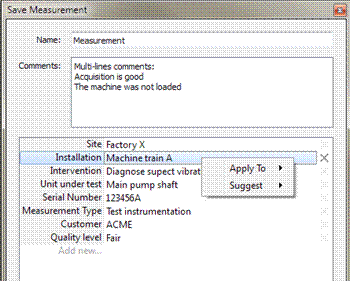
By default the save measurement displays the following confirmation window.
The Save Measurement dialog will show the visible properties with their suggected values:
This dialog box allows entering:
- the measurement name to identify your data
- An associated keyword that allows filtering the project manager
- User’s comments (Use the CTRL+Enter to add lines)
In Addition, the measurement can be informed with properties which are used to help retrieving the files and their meaning.
The properties are attached to the measurement and filled while saving the data or by editing the properties from the project manager. The properties belong to 3 different categories:
- The OROS properties are automatically filled by NVGate: Date, Author, Protection, Project name, Signal location and Number and type of saved results.
- The OROS user properties are already created by NVGate. Their values, but must be filled by the operator: Comments, Site, Installation, Intervention, UUT, Serial number, Measurement type and Default type
- The Users parameters are created and filled by the operator while saving or by editing the properties. Ex: TestCampaign, R&DProject or Customer name. Users parameters can be predefined from the ribbon: Measurement/Preferences/Measurement Properties
Note that users’ properties will pollinate. It means the new properties type will be automatically added on the future measurements. The same occurs if you import or copy a measurement which contains unknown users’ properties.
The OROS User properties easily cover a wide range of situations. Especially the fourth following items:
- Site is for the location of the measurement. It can be a ship, a test track, a test cell, an aircraft or a factory.
- Installation is for the tested machinery. It can be a diesel engine, a car, a jet engine, a pump, a machine tool, etc…
- Intervention describes the type of acquisition/analysis: qualification, overhaul check, prototyping, diagnostic, routine data collection, first run, etc…
- Unit Under Test (UUT) indicates precisely which part is tested: a tire, a bearing, a transmission, etc…
- Measurement type: Describes the type of measuring; Acoustic, diagnostic, rotating, etc..
- Default (or Defect): The identified defect on the UUT.
Managing properties
To enter the property values, click on the right cell of the corresponding line and add text.
To remove a property from the measurement, use the cross on the right side of the corresponding line.
To add a property fill the bottom left cell with the property name and use the tab or click on the right cell to enter its value.
By right clicking on the property line you can hide it or change the suggestion mode. In order to save your entered values from one measurement to the next one, select Same as previous. Same as today will reset the suggestion as soon as the date of the latest saved measurement is different from current day.
Note: Measurement’s properties can be edited from the Project Manager by right clicking on the desired measurement.
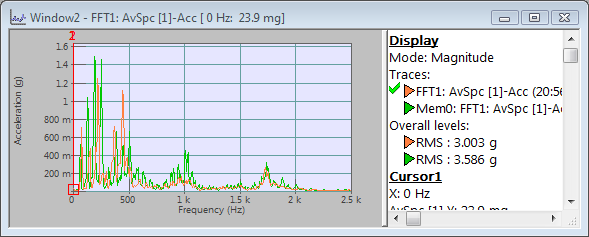
Memorize trace (Ins): Creates an instant copy of the active trace in the active window. The memorized trace add incrementally traces called Memx in the current window
These memorized traces can be added to the save selection using the "add to result selection" entry of the window contextual menu.
See chapter 2 Display - § Window menu for details
=
Graphs group===== The graph group purpose is to navigate (i.e. scan) all existing displays and to provide basic scaling tools.
Type
Browsers : Allows browsing in the Traces, Windows or Layouts. Depending on the pressed arrow (left or right) the item will be scanned in different side.
- Traces (up/down key), the positive scan is the creation order (from the oldest to the latest added traces in a window).
- Windows (CTRL+TAB) the positive scan is the inverse of the focus (from the latest to the oldest clicked/activated).
- Layouts (CTRL+SHIFT+SPACE ), the positive scan is the creation one (from the oldest to the latest created Layouts ).
Auto-scale (CTRL+A) : Adjust the Y scale of all the windows in the current layout. The scales are adjusted to the largest trace amplitude (min and max) in each graph. A 10% margin is added to these values to facilitate visibility.
Note: The minimum Y scale width cannot be lower than the active signal precision.
Cursor selection : Select the mouse mode (i.e. the cursor type).
Scale mode (CTRL+F5) This mode is used to modify scales using in the mouse graph, by moving the cursor on the scale. The cursor shape changes depending on the position of the mouse on the scale. Use the mouse wheel or the Up/Down arrows to change the scale value. If the Ctrl key is pressed, the changes are five times smaller, for more precise adjustment of the value modified.
| Mouse cursor | Position on the scale and action |
|
, |
On the lower left part of the scale. Only the minimum value of the scale is modified. |
|
, |
On the upper right part of the scale. Only the maximum value of the scale is modified. |
|
, |
On the center of the scale. Both minimum and maximum values are modified, in the same direction. This performs a translation of the scale |
|
, |
On the center of the scale, with Shift key pressed. Both minimum and maximum values are modified, in the opposite direction. This zooms in/out. |
Zoom mode (CTRL+F6): In this mode, left-click drag using the mouse in order to draw a rectangle to zoom into. When the left-button is released, the displayed area corresponds to the area defined by the rectangle.
If the size of the rectangle is smaller than the active signal precision displayed in the window, the zoom is not completed.
Cursor mode (CTRL+F7): In this mode, left-click on the cursor and drag it using the mouse in order to move it.
Move mode (CTRL+F8): In this mode, left click on the window and use the mouse to drag.
Rotate (CTRL+F9): In this mode, left-click on a 3D window and drag using the mouse to, change the orientation of the view. Left-right mouse dragging rotates the view around the Y-axis, top-bottom dragging around the X-axis.
Marker mode (CTRL+F10): In this mode, left-double clicking on a window adds the selected type of marker, - if compatible -, to this area at this position. See Display/graph tab in this chapter for details.
Layout selection: Allows selecting a layout from the active Layout list and display it.
Reset Scale: Reset X, Y and Z axis scale of the active window to their default values.
Default values are:
- Y scale: Active input range
- X Scale: max bandwidth
- Z scale default profile/waterfall depth
=
Transducers group===== Manage the transducers calibration and automatic recognition prior to measurements:
Calibration: Initiates the calibration procedure tool.
All current analyses and recording must be stopped prior switching to calibration.
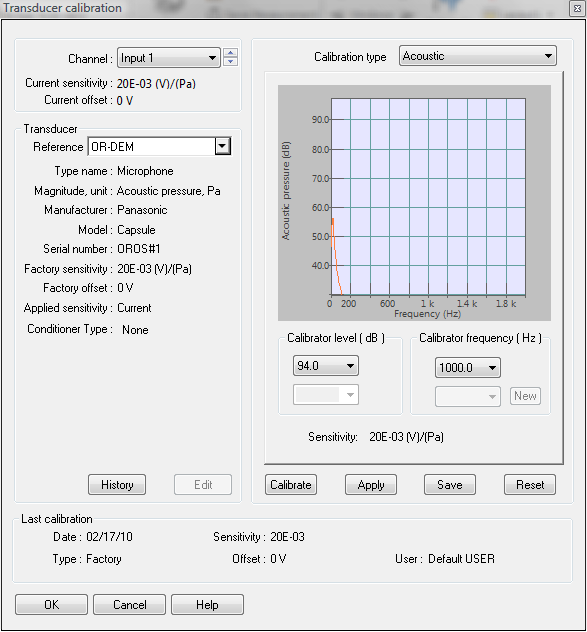
The following dialog box is used to calibrate the inputs connected to a transducer.
- Channel: This is the channel to be calibrated. It can be selected using the drop-down list or the up and down arrow. It is available for calibration of all dynamic and DC inputs. When a channel is selected, the sensitivity and the offset are immediately updated.
- Reference: This is the transducer selected on the channel. It is necessary to select a transducer in order to calibrate the input. If the transducer used is not in the list, a default transducer can be used. Information about the transducer is displayed.
- History: See "Transducer" chapter p 82. This button is not available when a default transducer is selected, since it does not refer to unique transducer.
- Edit: Similar to the "new transducer dialog".
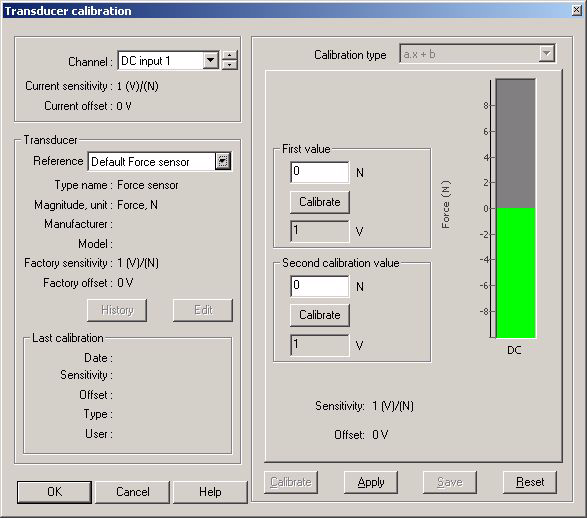
- Calibration type: This field is automatically updated, depending on the type of transducer selected.
| Calibration type | Description |
| Acoustic | The transducer is a microphone |
| Vibration | The transducer is an accelerometer (possible unit in g or in m/s²) |
| Frequency | The transducer is associated with a dynamic input and is not a microphone or an accelerometer |
| a.x + b | The transducer is associated with a DC input
|
- Acoustic, vibration and frequency calibration: The spectrum measured is displayed. The frequency range is linked to the calibrator frequency. It is possible to right click in the plot area to perform an auto-scale on the Y-axis.
- Calibrator level: Indicates the level of the calibrator. This values is used to determine the new sensitivity of the transducer
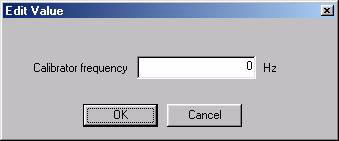
- Calibrator frequency: Indicates the frequency of the calibrator. It is used to check that the maximum level measured is at the correct frequency. It is also used to select the best frequency range for the calibration. The most common calibrator frequencies are suggested. It is also possible to choose a user-defined frequency.
- New: Used to select a user-defined calibrator frequency
- Calibrate: Starts the calibration. The analyzer detects the maximum level, checks that frequency is near the calibrator frequency, and determines the new sensitivity.
NB: In case of 1-DSP analyzer with 4 inputs @ 51,2kHz connected to the octave plug-in, it is not possible to perform the calibration (DSP power limit reached). In such situation, down the sampling frequency to 25,6kHz or disconnecting the inputs from the octave plug-in for the time of the calibration will allow calibrating the sensors.
Detect TEDS: Start the sequence for detecting transducers (or missing one) equipped with an electronic datasheet inside (TEDS: Transducer Electronic Data Sheet) connected to the front end.
As the TEDS sequence occurs automatically when an input coupling is set to ICP+TEDS, the Detect TEDS button is used for re-checking after transducers or cables modifications. The result of check will be visible on the warning window and may lead to add new transducers to the TDB.
Only the inputs with their coupling set to ICP+TEDS will be checked.
Applying the ICP+TEDS coupling to any (set of) input(s) will activate a recognition sequence on the corresponding input(s). The result can be the following;
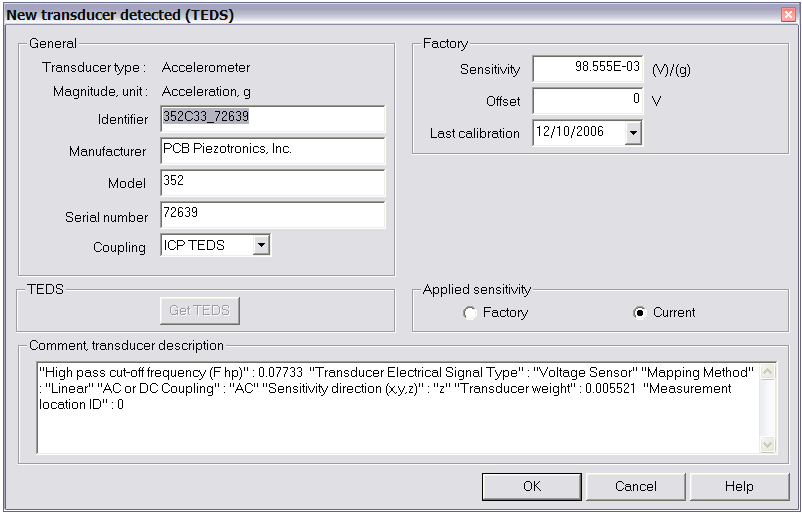
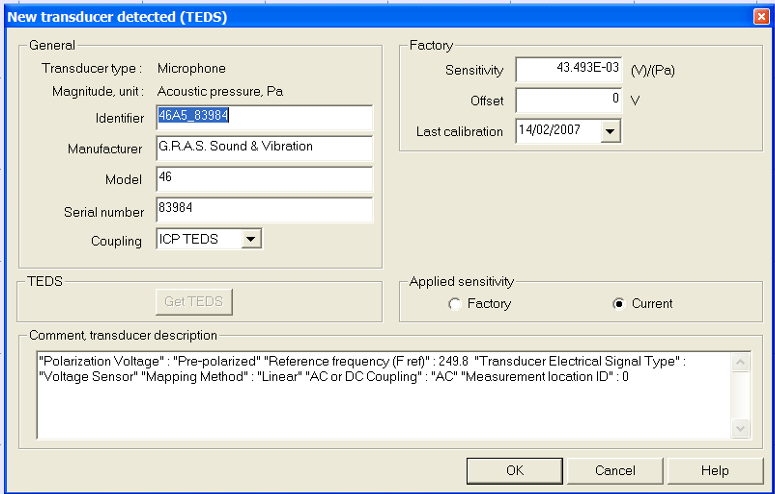
- A new transducer (not in the current NVGate® transducers database) is connected to the corresponding input. NVGate® proposes to add the new transducer in the Transducer database. A dialog box lets the user change the transducer properties:
The content of the TEDS is used to fill the transducer properties. The data from the TEDS that have no correspondence in the transducer database are copied in the comment area. The name is proposed as the concatenation of type and serial number. User may change it.
- A known transducer (existing in the database) is recognized in the corresponding input. NVGate® will notice it in the log window (which is popped up automatically).
- There is no TEDS transducer connected to the corresponding input. A warning is issued in the log window for each input in this situation.
Warning the TEDS Detection will applies a negative voltage (-5 V) to the corresponding inputs, this may affect incompatible transducers.
OROS 3-Series TEDS management fulfills the IEEE 1451.4 - 2004 revision 1 standard for:
|
Template # 25 |
|
Template # 27 |
|
Template # 28 |
|
Template # 29 |
The transducers which are compatible with IEEE 1451.4 - 2004 revision 1 are automatically recognized by the OROS 3-Series analyzers. In order to protect transducers that are electrically incompatible with the TEDS reading, there is a special coupling ICP + TEDS.
All other transducers types will generate a warning specifying that they are not supported.
There are two ways to add a TEDS transducer to the transducers data base:
Connect a TEDS transducer on a channel.
Select ICP TEDS for the input coupling.
All the characteristics of the transducer are automatically detected.
A warning confirms that a new transducer has been detected.
The window below is displayed.
The new transducer is added to the transducer database.
- Used a TEDS File
To use a TEDS file, click on New from TEDS file in the transducer database window.
By selecting the file, all the characteristics of the transducer are imported in the transducer database where anew transducer is added.
The "Acquisition" tab
This tab provides all the necessary entries to setup the front-end and the use of any channels in details. It separates the acquisition channels setup from the outputs, triggering, tachometer, and filters ones. A special group is available to manage the recorder setup.
While switching to post-analysis the inputs group is swapped to player track group which control the player operations, track connections and track setup.
Source dispatcher groups
The Inputs, Outputs, Tachometers, Events and Filters groups operates in the same way.
The External sync. Inputs benefit of special button due to their importance in rotating applications.
Inputs group
The inputs group allows dispatching the front-end channels to the plug-in analyzer and setting up the front-end. These settings are available in the on-line mode only.
Connect inputs: This button allows dispatching the front end inputs (all type) to the analysis modules. See Chapter 1 ASB - § Connection wizard for details
Inputs: Allows modifying the dynamic input properties. Available when at least one inputs is active. See Chapter 1 ASB - § Inputs for details
Parametric: Allows modifying the parametric input (DC) properties. Available when at least one DC input is active. See Chapter 1 ASB - § DC inputs for details
External sync: Allows modifying the digital trigger inputs properties. Available when at least one Ext synch input is active. See Chapter 1 ASB - § External synchs for details
CAN: Allows modifying the CAN parametric input properties. Available when at least one CAN input is active. See Chapter 1 ASB - § CAN for details
XPod: Allows modifying the XPod conditioner properties (Gauges, temperature). Available when at least one XPod is connected to the analyzer or in off-line to simulate it See Chapter 1 ASB - § Xpod for details
Tracks group
In the Post-analysis mode, the inputs group switches to the Player management with and is replaced by the Track settings.
The Track group allows dispatching the recorded tracks to the plug-in analyzer and setting up the signal post-process. These settings are available in the post-analysis mode only.
Note: Clicking on the bottom right icon (
) opens the player plug-in properties dialog allowing a full access to all the settings.
Connect Tracks: This button allows dispatching the signal tracks (all type) to the analysis modules. See Chapter 1 ASB - § Connection wizard for details
Record num: Define the record number (i.e. a section in the file defined during the acquisition) to be post-processed. See Chapter 1 ASB - § Player/Selected record for details
Start offset: Define the start position of the signal to post-process or playback on the generators: (0 <= Start Offset < Stop Offset). See Chapter 1 ASB - § Player for details
Stop offset: Define the end position of the signal to post-process or playback on the generators: (Start Offset < Stop Offset <= selected record duration). See Chapter 1 ASB - § Player for details Note: The Start, Stop and Record num can be handled directly from the Player file or Player Zoomed signal windows with the start and stop cursors and/or the bottom slide
r
Playback mode: Allows choosing between a continuous and a step/step post-process. .
- Continuous: the signal analyses are processed as fast as possible between the start and stop offset.
- Time step: the signal analyses are processed step by step. The step duration is defined by the Step setting (see hereafter). Each new step is manually (or automated by a macro) triggered through the Next step setting (see hereafter)
See Chapter 1 ASB - § Player for details
Step: defines the time duration if play back step in the "Time step" analysis mode. The player switches to "pause" every "time step" second.
- See Chapter 1 ASB - § Player for details
Next step: defines the time duration if play back step in the "Time step" analysis mode. The player switches to "pause" every "time step".
- See Chapter 1 ASB - § Player for details
Recorder group
This group controls the recorder plug-in setup.
Note: Clicking on the bottom right icon (
) opens the recorder plug-in properties dialog allowing a full access to all the settings.
Bandwidths: Opens the bandwidths definition dialog. The recorder support up to 4 different bandwidths:
| Type | Range | Mode |
| FS 1 | 2.048 S/s to FSF | User define |
| FS 2 | 2.048 S/s to FSF | User define |
| Ext. Synch | Front-end Sampling Freq (FSF) | Automatic |
| Parametric inputs | 15 Hz | Fixed |
- See Chapter 1 ASB - § Recorder for details
Mode: defines the time frame recording type. It can be:
- Start to stop: Records between a start and a stop event (can be run/stop)
- Start to time: Records for a fixed duration after a start event (can be run)
- Time to Stop: Records a fixed duration until a stop event (can be the manual stop)
- See Chapter 1 ASB - § Recorder/Mode for details
Records: defines the maximum number of records in the signal file. See Chapter 1 ASB - § Recorder/Mode for details
Duration: Set the maximum duration of a record. This value cannot exceed the available duration (see here after) for Start to time and Time to stop mode only See Chapter 1 ASB - § Recorder/Mode for details
Format: allows selecting the recorded data length:
- Normal: 32 bit floating point coding for each sample. Keep the full dynamic and precision.
- Compressed: 16 bit floating point coding for each sample. Reduce the size of the file(s) but reduce also the dynamic to 96 dB. Not recommended for low amplitude signal without auto-ranging. Adapted for exportation of signal in 16 bit format (Wav, txt)
See Chapter 1 ASB - § Recorder/Mode for details
Available: Display the maximum possible recording duration depending the current recorder setup. Read only. The max duration is computed from the free space of the selected hard disk, the number of tracks (and their corresponding sampling frequency) and the number of records Note in time to stop, the max duration may also be limited by the local available memory (PC/Analyzer) for the description blocks. See Chapter 1 ASB - § Recorder/Mode for details
Outputs group
Manages the generated signal on the front-end outputs (generators)
The left button (signals) allows selecting the signal type from the list and connecting it to the available outputs (1 to 6) .The others buttons open the signal settings and manage the generators activity.
Signals: Shows the list of available signals and let the users connect it to the outputs. See Chapter 1 ASB - § Connection wizard for details
The available signals are the following:
Sine: Opens the pure sine properties dialog for adjustment. Pure sine = 1 fixed frequency, 1 amplitude. Adapted for single mode excitation. Possibility to generate a fixed voltage with F=0.
Multi-sine: Opens the Multi-sine properties dialog for adjustment. Multi sine = n fixed frequencies, 1 amplitude Adapted for multi-mode excitation and FFT analysis
Swept-sine: Opens the Swept-sine properties dialog for adjustment. Swept-sine = 1 sweeping frequency, 1 to 6 proportional amplitudes Adapted for swept sine and MiMo excitation
Chirp: Opens the Chirp properties dialog for adjustment. Chirp = Continuous short term variable frequency (1 analysis block), 1 amplitude. Adapted for damping measurement and FFT analysis
Random Noise: Opens the Random noise properties dialog for adjustment. True Random noise = Infinity of frequencies, 1 amplitude, generated randomly. Adapted for non linear responses measurement. In addition to these predefined signals, the content of a file and the replication of an input is also available to be connected on the generators. See Chapter 1 ASB - § Resources/Output signals for details
Outputs settings: Manages the generated signal settling, (Mute, transition time) See Chapter 1 ASB - § Front-end/Output settings for details
Tachometers group
Manage the tachometer resources. This group allows selecting the tach type (source, setup) and associates it with the plug-in analyzers and waterfall
The left button (Select) allows dispatching the different tachometer type to the plug-in analyzers. The others items open the corresponding event detection setup.
Select: Shows the list of available tachometer sources and allows plugging it to the plug-in and waterfall. See Chapter 1 ASB - § Connection wizard for details
Inputs: Opens the properties dialog for the tachometers based on a dynamic input
Ext. Synch: Opens the properties dialog for the tachometers based on a high speed oversampled Ext Synch input.
Fractional: Opens the properties dialog for the tachometers that derives from another one. Fractional tach. computes RPM speed for a non accessible shaft by using gear ratio setting. Adapted for gear boxes and transmissions. Note: the fractional tach. cannot be settled from the Vision interface, use the ASB for it.
Combined: Opens the properties dialog for the tachometers computed from other ones. Adapted for CVT. Note: the combined tach cannot be settled from the Vision interface, use the ASB for it.
Profile: Set up the tachometer profiles duration. These graphs are available for the Tachometer module in the Add/Remove graph dialog. The profile displays continuously the tachometer speeds with a memory depth defined by the profile setting.
Resolution: Set up the tachometer profiles update rate. See Chapter 1 ASB - § Resources/Tachometer for details
=
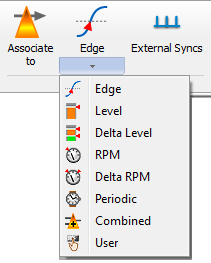
Events group===== Manage the event and corresponding triggers. This group allows selecting the event type (source, setup) and associates it with the plug-in analyzers triggers
The left button (Associate to) allows dispatching the different possible event (internal or external) to the plug-in analyzers.
The 2 others items open the corresponding event detection setup.
Associate to: This button opens the corresponding Event properties. The opened dialog shows both the source signal setup and the detection settings (may be spitted in different tabs) See Chapter 1 ASB - § Connection wizard for details
- Events properties: This button opens the corresponding Events properties dialog for setup.
The available event types are:
Edge: Detect when the signal from an input or a recorded track cross a threshold.
Level: Detect when a signal (from parametric input or statistical extraction form the TDA or monitor) is below or above a level
Delta-Level: Same as the Level but generates an event at each step
RPM: Detect when a tachometer is below or above a specified angular speed
Delta-RPM: Same as RPM but generates an event at each step
Periodic: Generates events periodically at a fixed rate
Combined: Generates an event which is the result of a combination of 2 events. Possible combinations are: OR, AND and AFTER.
User: Generates an event when the operator presses the corresponding event button in the software/remote controller interface.
External synch: Properties of the Ext synch trigger inputs. See Chapter 1 ASB - § Resources/Events for details
Filters group
Manage the filters definition and position. These filters operate on the time domain series. They can be applied in various locations onto the signal process (Inputs, Plug-in channels, Outputs, Player tracks)
The left button (Apply to) allows dispatching the filters to the different possible location in the signal process..
The second button allows selecting a filter type and opens the corresponding setup.
Apply to: This button opens the filter dispatching dialog:
Filters are available only for tachometers, outputs, aux. Outputs, edge detection, FFT, and Sync. Order and only after being activated using the ’Inputs’, ’Outputs signals’, ’Tachometers’ or ’Event’ connections previously described.
All filters are available, and by adding any filters to any channel, the properties of filters and channel selected are displayed and filters are applied in the current measurement:
See Chapter 1 ASB - § Connection wizard for details
- Filter properties: This button opens the corresponding filter properties dialog for setup.
The available filter types are:
High/Low pass: Filter the high or low (depends on setup) frequencies of a signal
Pass/stop band: Filter or reject (depends on setup) the specified bandwidth.
Integrator: Integrates or double integrates the signal. The high pass for avoiding divergences is included. Useful for acceleration to velocity/displacement conversion.
Differentiator: Derivate the signal. Useful for torsional velocity conversion in angular acceleration See Chapter 1 ASB - § Resources/Filter for details
Warning: Due to bandwidth compatibility, the filters use is exclusive of the plug-in. I.e: Once a filter is associated to a location (ex: a plug-in channel) it can be used on the same plug-in channels only. The front-end is considered as a plug-in.
The "Analyses" tab
In this tab, the software gathers the analyses controls. Each group corresponds to a plug-in analyzer. The content of this tab depends on the purchased optional plug-in.
The Monitor<ref>Excepted for the OR34-VibeShot licenses. </ref> and the waterfall plug-in are always available as standard features of the OROS 3-Series analyzers.
Monitor group
The Monitor plug-in offers simple and powerful ways to monitor the measured signals. This 4 channels plug-in runs independently from the general analyzer status (running/Paused/stopped) with the capability of swapping connected channels at any time.
The second capability of the monitor is to extract statistical component of the signal in a specific bandwidth. Extracted levels can be used for triggering and waterfall references.
The monitor runs its analyses on a specific processor (DSP) allowing a totally independent computation for the regular analyses.
Note: Clicking on the bottom right icon (
) opens the monitor plug-in properties dialog allowing a full access to all the settings.
NONE Inputs: Opens the channels sources selection. Allows choosing which input or track is monitored. Up to 4 ch at a time. The channel sources can be swapped at any time without influence on the other signal processing (analysis, record, play-back) of the instrument. See Chapter 1 ASB - § Monitor and waterfall/ Monitor for details
Average decay: Setup the exponential spectrum average decay of the FFT part.
NONE Overall analysis: Opens the statistical extraction setting. This dialog set up the filter characteristics and the averaging of the extracted values (DC, RMS, Min/Max, Kurtosis)
Filter: Allows applying the filter (Tick on) or bypassing it (No Tick). The Bypass is immediate without delay. See Chapter 1 ASB - § Monitor and waterfall/ Monitor for details
Time Domain Analysis group (Optional)
The TDA plug-in is designed to get the most from the time domain signal completing the frequency/order analyses. This plug-in offers flexible signal overview and statistical extraction in parallel.
Note: Clicking on the bottom right icon (
) opens the TDA plug-in properties dialog allowing a full access to all the settings.
- Synchronization: Controls the plug-in synchronization with the general analyzer status:
Linked to run: The plug-in is controlled by the general Run / Pause / Stop controls. It operates synchronously with the Other plug-in (except the Monitor)
Free run: The plug-in runs continuously independently from the general Run/Pause/Stop. Note: The start/stop trigger continue to control the plug-in processing
Range: Setup the analysis range for the plug-in. This value is maximized by the front-end sampling frequency divided by 2.56.
Note: Each plug-in feature an independent bandwidth.
NONE Average: Setup Average type for the statistic extraction. It can be exponential with a sliding decay or linear. Multiple linear averaging are obtained by setting the TDA/Trigger/Repeat to : End of averaging
Average duration: Setup the average duration. In Exponential mode it specifies the non decayed part of the signal. In linear mode, it specifies the complete duration. In Linear repeated mode, it specifies the short duration. See Chapter 1 ASB - § Analysis plug-in/ TDA for details
FFTx group (Optional)
The FFT plug-in provide frequency distribution of the analyzed signal. It runs an FFT algorithm.
Note: Clicking on the bottom right icon (
) opens the FFTx plug-in properties dialog allowing a full access to all the settings.
Note: Up to 4 FFT plug-in can be present in the software configuration, each of them running independent analyses on the same or different channels.
NONE
Range: Setup the analysis range for the plug-in. This value is maximized by the front-end sampling frequency divided by 2.56.
Note: Each plug-in feature an independent bandwidth.
NONE Lines: Select the analysis resolution in number of frequency lines. The resolution = Range / (Lines-1) in Hz
NONE Average: Select the domain of averaging:
- Spectral: the spectra module are averaged together
- Time: the trigger block are averaged together -> provide absolute / relative phase
- Frequency domain synchronous (FDSA): The complex spectra are averaged together (real/img) after phase synchronization on one spectral line -> allows synchronous time averaging (STA) without a trigger.
See Chapter 1 ASB - § Analysis plug-in/ TDA for details
Synchronous order group (Optional)
The SOA plug-in provide order distribution and extraction of the analyzed signal related to a tachometer. It runs re sampling + FFT algorithms
Note: Clicking on the bottom right icon (
) opens the SOAx plug-in properties dialog allowing a full access to all the settings.
Note: Up to 2 SOA plug-in can be present in the software configuration, each of them running independent analyses on the same or different channels.
Max order: Setup the order analysis range for the plug-in from 6.25 to 400.
NONE Associated tach: Select the tachometer to be used for signal re-sampling. The order results provided by the SOAx plug-in are related to this tachometer speed
NONE Order resolution: Select the analysis resolution in orders. Ranges from 1/32 (0.03125) to 1 order.
NONE Average: Select the type of averaging. Linear, exponential peak hold and ref. peak hold See Chapter 1 ASB - § Analysis plug-in/ SOA for details
/nth octave group (Optional)
The 1/n Octave plug-in provides constant percentage band spectra. It runs filter and detector. This plug-in complies the IEC 60 804 and 62 260 standards.
Note: Clicking on the bottom right icon (
) opens the 1/n OCT plug-in properties dialog allowing a full access to all the settings.
NONE Upper band: Setup the center frequency of the highest frequency band
Lower band: Setup the center frequency of the lowest frequency band
NONE Resolution: Select band resolution: from 1 band per octave to 24 band per octave.
NONE Type: Select Averaging type. This setting features a mix of different averaging modes such as time weighting, classic, constant band* time and repeated Leq.
NONE Average duration: Define the total average duration and the linear duration for exponential.
NONE Short duration: Define the short average duration for the linear repeated and Leq. See Chapter 1 ASB - § Analysis plug-in/ 1/n Octave for details
Overall acoustic group (Optional)
The overall acoustic plug-in provides sound pressure level measurement. This plug-in complies with the IEC 61672 standard. It runs 3 RMS detectors + 1 peak per channel.
Note: Clicking on the bottom right icon (
) opens the 1/n OCT plug-in properties dialog allowing a full access to all the settings.
Detector: opens the detectors properties. 1 peak and up to 3 RMS detector can be activated. They process all plug-in channels simultaneously.
NONE Average: Select the averaging type from Linear and 3 short Leq (1s, 1/8s and user defined
NONE Average duration: Define the total average duration.
NONE Short duration: Define the short average duration for the linear and user defined short Leq See Chapter 1 ASB - § Analysis plug-in/ Overall acoustics for details
Waterfall group
The so called waterfall is a stack for analysis results and reference. It allows storing results from different plug-ins in a synchronized database. These data are viewed with the 3D waterfall or profiles graphs.
Note: Clicking on the bottom right icon (
) opens the 1/n OCT plug-in properties dialog allowing a full access to all the settings.
NONE Add/remove: Opens the waterfall add/remove result dialog. This dialog allows selecting the list of result to be collected by the waterfall plug-in.
- Plug-in analyzer tab: A tab is displayed for each plug-in analyzer connected. This displays waterfall source results.
- Result: List of results provided by the plug-in analyzer selected. This can be the source of the waterfall plug-in analyzer.
- Channel: List of plug-in analyzer channels connected, available for the result selected.
- Reference / X: List of plug-in analyzer channels connected. This can be the reference. Available for results that require a reference only (cross-spectrum, for example).
- Tracked order: List of tracked orders on the channel selected. Available if result selected is an order result.
- Waterfall: List of 3D Waterfall displays. These waterfalls can be displayed versus any one of the references selected in the "Reference and profiles" list.
- References & Profiles: List of profiles and references provided by the waterfall plug-in. All scalar profiles selected can be used as references, except monitor scalars, sound level meter scalars, and orders.
Adds a new Waterfall. If the result selected is a scalar, a new profile is added to the "References and profiles" list. Otherwise, a new Waterfall is added to the "Waterfall" list.
If the Waterfall or profile already exists, the clicking on this button has no effect.
If a tracked order is selected, all orders tracked on the channel selected are added.
Removes the selected result from the corresponding list.
NONE Mode: Select the data collection synchronization:
- One shot: The waterfall is fulfilled in one shot from its start trigger to the stop one.
- Continuous: the plug-in is fulfilled as a rolling buffer (FiFo) memorizing the last data only.
Depth: Defines the maximum number of slices to be collected. In the continuous mode it defines the depth of the rolling buffer. See Chapter 1 ASB - § Monitor and waterfall/ Waterfall for details
The "Display/Graphs" tab
This tab covers the results display control. It allows creating, fulfilling, arranging and viewing the windows and layouts. It controls the scale, units, weighting and data operations of any graphs, manages the waterfalls and extraction graphs and the markers.
Windows group
This part of the display/graph tab manages the windows creation, their refreshment and the infotrace view/hide.
See Chapter 7 - § Graph for details
Note: Clicking on the bottom right icon (
) opens active window properties dialog. The content of this dialog varies depending on the windows type.
See Chapter 7 - § Graph for details
Add/remove: Opens the add/remove windows dialog. This dialog allows creating and arranging the traces, graphs, windows and layouts. Layouts/windows/traces
- One tab is displayed for each layout. Each tab is made up of a tree showing the windows and results displayed in each window.
- Creates a new layout. A dialog box used to name the new layout is displayed by clicking on the button. A new tab is created and selected, corresponding to the new layout.
- Creates a new window, in the layout of the selected tab. A dialog box used to name the new window is displayed by clicking on the button.
- Adds the results selected in the window of the layout tab. If the layout does not contain any windows, a new window is created. A dialog box that shows the name of the new window is displayed. If a result is selected in the layout tab, a click on this button has no effect.
- Renames the window selected in the layout tab. If no window is selected, a click on this button has no effect and an error message is displayed in a message box.
- Deletes the selected window or trace selected in layout tab.
Plug-in analyzer tab: A tab is displayed for each plug-in analyzer connected.
- Result selection: List of results provided by the plug-in analyzer selected. Multiple plug-ins may be selected if all results selected are compatible (which means that they can be displayed in the same result window).
- Channel selection: List of plug-in analyzer channels connected, available for the result selected.
- Operation: in the top combo-box, list of weighting which can be applied to results selected. In the middle combo-box, list of derivation/integration operations which can be applied. In the bottom combo-box, list of display units.
- Reference / X: List of plug-in analyzer channels connected. This can be the reference. Available for results that require a reference only (cross-spectrum, for example).
- Tracked order: List of tracked orders on channel selected. Available if result selected is an order result.
Waterfall tab
- Analyzer result: The list of plug-in analyzers connected that provide Waterfall source results is displayed in the combo-box. The list of results provided by the plug-in analyzer selected, which can be a waterfall source is displayed in the list-box below.
- Channel selection: List of plug-in analyzer channel connected, available for the result selected.
- Operation: in the top combo-box, list of weighting which can be applied to the results selected is displayed. In the middle combo-box, a list of derivation/integration operations that can be applied is displayed. In the bottom combo-box, a list of display units is displayed.
- Reference / X: List of plug-in analyzer channels connected. This can be a reference. Available for results that require a reference only (cross-spectrum, for example).
- Tracked order: A list of tracked orders on the channel selected. Available if the result selected is an order result.
External result tab: The "Externals results" tab allows displays results saved in measurements.
- Measurement selection: List of measurements classified by project.
- Result selection: List of results saved in the measurement selected. Multiple selections are not available.
- Operation: in the top combo-box, list of weighting which can be applied to results selected. In the middle combo-box, list of derivation/integration operations which can be applied. In the bottom combo-box, list of display units.
The left button is a multi-action button that can be assigned to differnts functions. To assign a function, select the corresponding item in the drop list. Note, assigning a function will apply it.
NONE Close all: Close all the windows in the active Layout
NONE Open infotrace: Opens or close (toggle) the infotrace of the active windows. The infotrace contains the trace(s) identification, the cursor and marker values and the section data for the 3D waterfall windows. See chapter 2 –Display - § area for details
NONE Refresh all: Force the refreshment of displayed data. Applies to all windows and all traces. Used in case of de synchronization between the hardware and the software.
NONE Freeze trace (F10): Freeze/unfreeze (toggle) the traces of the active window.
NONE Freeze all traces Freeze/unfreeze (toggle) all the displayed traces in the active Layout
Zoom group
Control the windows graphical zooms and auto-scaling.
NONE Y Adjust (CTRL+A): Adjust the Y scale of all displayed graph in the active Layout. See chapter 2 –Display - § Display window/graph menu / Y zoom for details
NONE X/Z Adjust (CTRL+Q): Adjust minimum and maximum values of the X or Z-scale so that every point on the axis is visible.. See chapter 2 –Display - § Display window/graph menu / X zoom for details
Reset scale (CTRL+Z): Reset the Y/X/Z scale of the active window. The default value of each scale depends on the inputs range for Y, The analysis bandwidth for X and the number of point for the Z one. See chapter 2 –Display - § Display window/graph menu for details
NONE Zoom in Y: Makes the Y-scale two times smaller.
NONE Zoom out Y: Makes the Y-scale tow time larger.
NONE Zoom in X: Makes the X-scale two times smaller and sets the minimum and maximum values so that the cursor is in the middle of the graph.
NONE Zoom out X: Makes the X-scale twice as large and sets the minimum and maximum values so that the cursor is in the middle of the graph.
View group
Browses the displayed windows and toggle the 3D/2D view
Cascade view: Toggle the active trace between 3D and 2D graphs. Applies to spectral (freq, order, 1/n oct) window only. Note the Cascade view is designed for monitoring purpose as it bufferize the data in the display. Buffered data cannot be manipulated or saved, use the waterfall plug for this purpose. See chapter 2 –Display - § Display window/window menu / Cascade view for details
Browse Windows (ALT+TAB): Scan the existing windows in the current layout.
NONE Browse layouts (CTRL+SHIFT+SPACE): Scan the existing layouts. Note the 2 latest viewed layouts are kept in the RAM memory. Note: using the CTRL+SPACE shortcut allow switching between these layouts
=
Tiles group===== Allows arranging automatically the windows in the current layout.
Automatic: Organizes windows in the best possible arrangement according to the type and contents of the graphs.
NONE Cascade: Cascades the windows according to the Windows operating system rules.
Vertical: Tiles windows horizontally according to the Windows operating system rules.
NONE Horizontal: Tiles windows horizontally according to the Windows operating system rules.
NONE Grid: Tiles windows in order to have all windows with the same size.
=
Marker group===== Features a complete set of real-time markers that help identifying typical signature and points of exception in both time and spectral graphs.
The marker group allows selecting and positioning the chosen marker.
.
The first button corresponds to the marker to be added. It is a multi-action button that gathers all marker type in its list.
NONE Free marker: Switch the cursor to deposit a free marker in the click location. The free marker can be positioned everywhere to add a legend in a spectra, profile, 1/n octave and waterfall section. See chapter 2 –Display - § Marker/free marker for details
Harmonic marker: Switch the cursor to deposit a set of harmonic in the click location. The harmonic marker can be positioned everywhere in a spectra and waterfall X/Y sections. See chapter 2 –Display - § Marker/harmonic marker for details
NONE Peaks marker: Switch the cursor to add a set of peak detection markers in the clicked graph. The peak marker detects automatically the peaks in the spectra and waterfall X/Y sections. See chapter 2 –Display - § Marker/peaks marker for details
Max marker: Switch the cursor to add a set of maximum detection markers in the clicked graph. The max marker detects automatically the maximum in the spectra and waterfall X/Y sections. See chapter 2 –Display - § Marker/Max marker for details
NONE Side band marker: Switch the cursor to add a side band marker at the clicked location. The Sideband marker can be positioned everywhere in a spectra and waterfall X/Y sections. See chapter 2 –Display - § Marker/Sideband marker for details
Power band marker: Switch the cursor to add a power band marker at the clicked location. The power-band marker can be positioned everywhere in a spectra and waterfall X/Y sections. It extracts the RMS power in the selected band taking in account the equivalent bandwidth of the weighting window. See chapter 2 –Display - § Marker/Power band marker for details
NONE 1/n Octave data marker: Switch the cursor to add a 1/n octave data marker at the clicked graphs. The 1/n octave data marker can be positioned in CPB spectra and waterfall X/Y sections of the same type. It extracts the list of the band levels in db or linear units into the infotrace. See chapter 2 –Display - § Marker/Octave marker for details
NONE Kinematic marker: Switch the cursor to deposit a set of harmonic in the click location. The harmonic marker can be positioned everywhere in a spectra and waterfall X/Y sections. See chapter 2 –Display - § Marker/Octave marker for details
Period marker: Switch the cursor to add a periodic marks at the clicked location. The period marker can be positioned trigger blocks. Operates like an harmonic marker but in the time domain. See chapter 2 –Display - § Marker/Kinematic marker for details
Record marker (CTRL+M) Using this shortcut while the analyzer is recording, add record marker to the signal. If there is a recording window, the maker is displayed. During the recording, a comment can be added to the record marker, via the properties dialog box.
The record marker is available from the Measurement\Control group. See Measurement tab§ in this document.
The rest of the group is dedicated to the marker adjustments:
NONE Marker mode: Switch between the marker mode (the cursor controls the marker) and the last used cursor mode. See this chapter (6) - §Tabs/ Measurement tab/graph group for details
Move marker: Moves the selected marker of the active window by one step of spectra resolution to the left or right
NONE Move marker by 1/32nd of step: Moves the selected marker of the active window by a 1/32nd of spectra resolution to the left or right. Allowed only if the marker is located in the vicinity (+/- 1 step) of a peak and the X& Y interpolation are enabled
D group
This group provides general purpose tools about the Waterfall 3D graphs.
The first button corresponds to displayed graphs. Each Waterfall windows may displays up to 4 different graphs. It is a multi-action button.
3D only: Shows the 3D graph only. This graph can be a 3D plot or a color map.
NONE X/Y only: Shows the X/Y extraction graph only. This graph contains the spectra at the cursor position and the X/Y sections.
Y/Z only: Shows the Y/Z extraction graph only. This graph contains the time (or ref) profile at the cursor position and the Y/Z sections.
NONE Extraction only: Shows the Order/frequency extraction graph only. This graph contains the order/frequency profile at the cursor position and the extraction sections.
All graphs: Shows all the graphs in a matrix.
See chapter 2 –Display - § Contextual menu/Window menu/Waterfall menu for details
The second button controls which way the 3D data are plotted. It is a multi-action button.
NONE 3D Isometric: Plot the spectra (or trigger blocks) along a Z axis with the same scale whatever is the position. The Z axis angle is modified by the rotate button.
3D perspective: Plot the spectra (or trigger blocks) in a true 3D space, taking in account the perspective. The global orientation of the gathered spectra can be changed using the rotate button. This type of view allows looking at the waterfall from any side
Time/frequency color map: Plot the spectra (or trigger blocks) on 2D map with the color representing the point amplitude. This plot show the Time (Y) Vs frequency (X) arrangement
NONE Frequency/time color map: Plot the spectra (or trigger blocks) on 2D map with the color representing the point amplitude. This plot show the Frequency (Y) Vs Time (X) arrangement
The last 3 items control the 3D graph rotation and manage the sections:
Rotate: Toggle the rotating mode. Allows rotating the 3D graphs with the mouse when enabled. Disabling this item return the mouse to the previous mode.
NONE Add section: Add a copy of the cursor location in each of the 3 extraction graph
Section manager: Open the waterfall section manager.
See chapter 2 –Display - § Contextual menu/Window menu/Waterfall menu for details
The "report" tab
This tab is dedicated to the report generation. It contains the necessary tools to build up or modify a template into MS Word™ or Excel™. The use of the tab is no more requested as soon a template has been build up; the report can be generated from the Measurement tab.
See chapter 5 Reports & tools - § Reporting for details.
The "Tools" tab
The tool tab contains powerful and helpful tools to automate repetitive tasks made with the analyzers
See chapter 5 Reports & tools - § Tools for details.
Status bar
The software interface features a status bar that shows continuously the different status of the hardware, analysis and ongoing actions.
The status bar is divided in 5 parts
====Controls
==
Allows starting, pausing and stopping the analysis.
See Measurement tab/control group for details
Plug-ins progress bars
Shows the individual analysis status of the active plug-ins. The Progress bars appear automatically when the plug-in are activated (i.e: Inputs or tracks are connected to their channels).
Ex:
Each progress bar displays:
- A progress bar:
- Indicates the current averaging number or analysis duration. In case of un expectable duration, the progress bar continuously run for one side to the other.
- The color indicates the real time status:
- Green = real-time, all sample are processed
- Red = the analysis has encountered a non real-time situation, sample have not been analyzed
- A text: (AVT) SSSS: AAA
- AVT = Average type
- SSSS= Plug-in status (Stop, run, Paused, triggering,)
- The text color indicates the current real-time status: Red = not real-time
Information area
In the top left of the status bar, contextual information and progress bar appear depending the on-going action. This concern the disk download, the setup and data saving and any long duration process from NVGate.
Inputs status LED
Shows the inputs/signal tracks status. The same status is displayed on the front-end LED.
| The input is not active | |
| The input is under loaded. The signal amplitude is more than 24 dB below the current input range | |
| Normal, the signal amplitude is between -24 dB and the input range. | |
| An overload has been detected since the last run. The signal on the input is no more overloaded | |
| The input is overloaded. |
A right-click on an active input status LED displays a pop-up menu. It is used to modify the range or any of the input parameters.
Front-end LED colors
For those who use OR36, Mobi-Pack and OR38 version 2, the front-end LED colors helps knowing what is connected and signal levels.
The LED statuses are:
| Status | Color on Front End | Color on XPod |
| Dynamic inputs normal | Green | None |
| Dynamic inputs underload | Cyan (clear blue) | None |
| Every input type overload | Red | Red |
| Parametric input normal | Yellow | None |
| Parametric input underload | Clear purple | None |
| Strain gauges normal | None | Blue |
| Thermocouple JKTNB | None | Yellow, Green, Brown, Pink, purple |
| PT 100, PT1000 | None | Blue, Grey (low white) |
Accept/reject
This function is used to accept or reject a measurement when the FFT trigger accept mode is set to manual.
=====Accept
=
Shortcut: Ctrl + Y. Accepts the last acquisition.
=====Reject
=
Shortcut: Ctrl + N. Rejects the last acquisition.
Battery
Shows the battery and powering status:
| The analyzer is powered by and external power | |
| The analyzer is running on its battery |
The battery level shows the available autonomy. The steps shows: 100%, 75%, 50%, 25% and 10% of battery charge. Note: The battery level is also replicated on the LCD screen of OR36 and OR38.
See user manual for details about battery
Connection mode
Depending the connection mode an analyzer or a display icon is displayed in the bottom right area.
| Office mode. The software processes data from a signal file (post-analysis) in the PC or simulates the inputs for preparing a measurement setup. | |
| Connected mode. The hardware is connected. The software runs the analysis on the DSPs directly from the inputs or post-processing signal files from the Mobi-disk. |
Note: a fly over the Analyzer icon with the mouse will show the internal temperature and fan status of the analyzer.
Acquisition status
| The acquisition and analysis are real-time | |
| The acquisition is not real-time. The analyzer is not working properly. Both software and hardware should be restarted |
File Menu
==
Project====
New
Opens the Start & Go. This dialog proposes to load predefined setups or to build a new one. See § Tabs/Home in this chapter for details
Load
Opens the dialog box to load a project. Select a project from the current base.
Save:
Saves the current project. If the current project is the default project, the Save command will act as the Save As.
Save As:
Saves the current project with a new name
==
Save setup as model==== Save the current setup in the C:\OROS\NVGate data\Workbook Library\user Directory. The models can be reloaded from the Load setup button in the Home Tab.
A Model includes the following items:
- Workbook
- ASB
- Layouts
- Control panel
- Save Setup
- Macros
- Sequences
- Signal file loaded in the player
After being saved, the model remains unchanged whatever the number of time it is used. In order to change a model it must be loaded, modified and saved as a model again with the same name.
==
Export====
Result files
Export results from the project manager to a user specified directory in various data format.
Project: Lists the projects that contain measurements. Only one project can be selected.
Measurement: Lists the measurements in the project selected. Select one or several measurements and click on the add button.
Batch list: Contains all the measurements that will be converted. Use the add/remove button to modify list content.
Format: This is the output format. The formats available are:
| Result | Signal |
| Mat: to be used with Matlab | Mat: to be used with Matlab |
| Txt: usable by any text or spreadsheet editor | SDF: Standard data format |
| UFF: Universal File Format | UFF: Universal File Format |
| Wav audio: Wav file, re-sampled to standard audio frequency (44.1, 48, 96 kHz) . To be used by any audio player | |
| Wav: Standard wav format, usable with OR2X technology | |
| Txt: Text usable by any text or spreadsheet editor |
See Chapter 7 User preferences- § Export" topic for more details
Output directory: The location on the disk where the files will be exported. During the export, a directory will be created for each project, and will contain the exported files corresponding to all selected measurements.
Signals files
Export Signal from the project manager records to a user specified directory in various data format.
See details from previous § Export result files
==
Import====
Import project
This command is used to import project that are not in the project database. It makes a copy of the project and makes it available to the current user, or whoever created the project. If a project already exists in the project base, a ~ (tilde) will automatically be added.
Directory: Select the directory in which you would like to look for the project. The "found project" list will display all projects that are immediately in the directory selected. If the "scan" button is pressed, all the projects that are contained in the specified directory will be displayed.
Found projects: Displays the list of projects found. Select one or several projects to import.
Import Files
This command is used to import results or signals. It makes a copy of the file and makes it available to the current user, or whoever created the file. The file will be included in a measurement If a measurement already exists in the project, a ~ (tilde) will automatically be appended.
- Reception project: Determines which project will receive the new measurement
- File type: One or several types can be selected. File type may be OR2X or OR3X
- Directory: Selects the directory in which you would like to look for the files. The "found files" list will display all the files that are immediately in the directory selected. If the "scan" button is pressed, all the files that are contained in the specified directory will be displayed.
- Found files: Displays the list of files found. Select one or several projects to import.
Recent projects
Displays the list of the most recent projects used by the current user.
Recent measurements
Displays the list of the most recent measurements used by the current user.
Help
Users’ manual
Load the users’ manual. Acrobat reader must be installed on the PC.
The user manual gathers all the guides and rules to uses the analyzer from its installation to advanced automated operations. It answer to the "How do I?" question.
Reference manual
Load the reference manual. Acrobat reader must be installed on the PC.
The reference manual contains the detailed description of each item of the analyzer. It can be loaded with the F1 key on any Item.
What’s new
Load the release note of the current NVGate version. Acrobat reader must be installed on the PC.
This is helpful identifying the latest features or getting instruction of items which are not already available in the reference manual
Web
Shortcuts to the OROS pages on the web. The myOROS website gathers many helpful information and example dedicated to OROS products users. Register on www.myOROS.com
Exit
Exit NVGate.
Shortcuts
General shortcuts
| F1 | On-Line Help |
| Ctrl + Space | Move from one layout to the next one |
| Ctrl + Tab | Move from one window to another one in the same layout |
| Page Up | Change Workspace tab (ASB, Control Panel, Project Manager) |
| Page Down | Change Workspace tab (ASB, Control Panel, Project Manager) |
| F10 | Freeze the active window |
| Move the cursor to the left | |
| Move the cursor to the right | |
| + | Zoom in on Y axis |
| - | Zoom out on Y axis |
| / | Zoom out on X axis |
| * |
Zoom in on X axis |
| Shift + F1 | Contextual help |
| Ctrl + Insert | Edit Copy |
| Shift + Delete | Edit Cut |
| Ctrl + X | Edit Cut |
| Shift + Insert | Edit Paste |
| Alt + Back | Edit Undo |
| Ctrl + R | Run |
| Pause | Pause |
| Ctrl + S | Stop |
| Ctrl + A | Y axis auto-scale on all windows |
| Crtl + Alt + A | Y axis auto-scale on active window |
| Ctrl + Shift + A | Auto-range |
| Ctrl + B | Next Step |
| Ctrl + C | Copy item content (ASB settings, mask) |
| Ctrl + V | Paste item content (ASB settings, mask) |
| Ctrl + D | Save current workbook |
| Ctrl + Y | Accept acquisition |
| Ctrl + N | Reject acquisition |
| Ctrl + 0 to 9 | Macro start |
| Ctrl + P | Print report |
| Ctrl + Q | Zoom auto-scale on Z axis |
| Ctrl + T | Manual trigger |
| Ctrl + M | Add record marker |
| Ctrl + W or Z | Full width on active trace |
| Insert | Memorize Trace |
| Ctrl + Delete | Remove Active Trace |
| Ctrl + F5, F6, F7, F8, F9, F10 | Change the mouse mode (display mode toolbar) |
| X/Y/Z +Shift + Mouse wheel (up) | Zoom in on (X/Y/Z) axis (+ Ctrl for small steps) |
| X/Y/Z +Shift + Mouse wheel (down) | Zoom out on (X/Y/Z) axis (+ Ctrl for small steps) |
| X/Y/Z + Mouse wheel (up) | Translate X/Y/Z axis positively (+ Ctrl for small steps) |
| X/Y/Z + Mouse wheel (down) | Translate X/Y/Z axis negatively (+ Ctrl for small steps) |
| Ctrl + F5 | Default mode activation (scale mode) |
| Ctrl + F6 | Zoom mode activation |
| Ctrl + F7 | Cursor mode activation |
| Ctrl + F8 | Move mode activation |
| Ctrl + F9 | Rotate mode activation |
| Ctrl + F10 | Marker mode activation |
| F2 to F9, F11, F12 | Macro Hot key |
Use the mouse wheel for 1D windows
Mouse wheel: move the min, the max or shift a scale.
Note: If you do not have a mouse wheel, you can use the top and bottom arrows
Template Editor
| Tab | Browse the objects on the active page |
| Alt Gr + Tab | Browse the objects on the active page in the opposite direction |
| Alt + Enter | Last selected object properties |
| Move one or several selected controls to the left | |
| Move one or several selected controls to the right | |
| Move one or several selected controls to the top | |
| Move one or several selected controls to the bottom | |
| Suppr | Delete one or several selected controls |
Use the mouse wheel for 2D windows
Cursor mode
Mouse Wheel: right/left move by 5 steps.
Mouse Wheel + CTRL: right/left move by 1 step.
Arrow mode
When the pointer is on the X or Y axis and on the min or max value, use the mouse wheel to move 5 pixels.
When the pointer is on the X or Y axis and on the min or max value, use the mouse wheel + CRTL to move 1 pixel.
When the pointer is in the middle of X or Y axis, use the mouse wheel to shift translation of the zoom area 5 pixels.
When the pointer is in the middle of the X or Y axis, use the mouse wheel + CRTL to shift of the zoom area 1 pixel.
When the pointer is in the middle of X or Y axis, use the mouse wheel + SHIFT to zoom quickly.
When the pointer is in the middle of X or Y axis, use the mouse wheel + CRTL + SHIFT to zoom.
<references/>

