NVGate Ribbons: Display

From OROS Wiki
Revision as of 09:01, 13 January 2022 by Lmagimel (talk | contribs)
Jump to navigation Jump to search

The "Display" tab covers the results display control. It allows creating, fulfilling, arranging and viewing the windows and layouts. It controls the scale of any graphs, manages the waterfalls and extraction graphs and the markers.

Display tab 2022.PNG

Windows group


Window group 2022.PNG

This part of the "Display" tab manages the windows creation, their refreshment and the infotrace view/hide.

See windows-graph page

Add/remove window

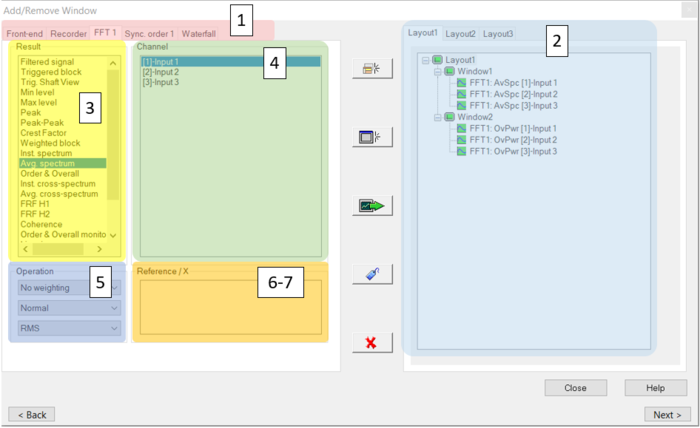
Add remove 2022.PNG Add/remove: Opens the Add/Remove window dialog, which allows to display the measurement results of the active plug-in analyzers. This dialog allows creating and arranging the traces, graphs, windows and layouts.

The maximum number of traces, windows and layouts available are:

- 32 Traces per window
- 32 Windows per Layout
- 16 Layouts per project.


Add remove windows 2022.PNG

1: A tab is displayed for each plug-in analyzer connected.

2: A tab is displayed for each layout. Each tab is made up of a tree showing the windows and results displayed in each window.

3: Result selection: List of results provided by the plug-in analyzer selected. Multiple plug-ins may be selected if all results selected are compatible (which means that they can be displayed in the same result window).

4: Channel selection: List of plug-in analyzer channels connected, available for the result selected.

5: Operation: in the top combo-box, list of weighting which can be applied to results selected. In the middle combo-box, list of derivation/integration operations which can be applied. In the bottom combo-box, list of display units.

6: Reference / X: List of plug-in analyzer channels connected. This can be the reference. Available for results that require a reference only (cross-spectrum, for example).

7: Tracked order: List of tracked orders on channel selected. Available if result selected is an order result.

Add remove new layout 2022.PNG Creates a new layout. A dialog box used to name the new layout is displayed by clicking on the button. A new tab is created and selected, corresponding to the new layout.
Add remove new window 2022.PNG Creates a new window, in the layout of the selected tab. A dialog box used to name the new window is displayed by clicking on the button.
Add remove add trace 2022.PNG Adds the results selected in the window of the layout tab. If the layout does not contain any windows, a new window is created. A dialog box that shows the name of the new window is displayed. If a result is selected in the layout tab, a click on this button has no effect.
Add remove rename layout 2022.PNG Renames the window selected in the layout tab. If no window is selected, a click on this button has no effect and an error message is displayed in a message box.
Add remove remove item 2022.PNG Deletes the selected window or trace selected in layout tab.


Waterfall tab

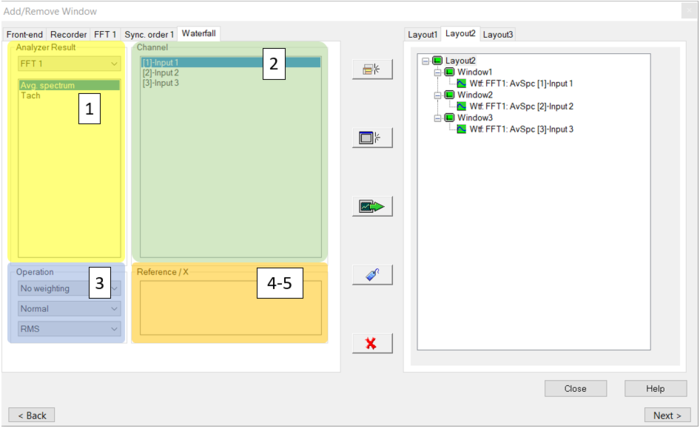
Add remove windows waterfall 2022.PNG

1: Analyzer result: The list of plug-in analyzers connected that provide Waterfall source results is displayed in the combo-box. The list of results provided by the plug-in analyzer selected, which can be a waterfall source is displayed in the list-box below.

2: Channel selection: List of plug-in analyzer channel connected, available for the result selected.

3: Operation: in the top combo-box, list of weighting which can be applied to the results selected is displayed. In the middle combo-box, a list of derivation/integration operations that can be applied is displayed. In the bottom combo-box, a list of display units is displayed.

4: Reference / X: List of plug-in analyzer channels connected. This can be a reference. Available for results that require a reference only (cross-spectrum, for example).

5: Tracked order: A list of tracked orders on the channel selected. Available if the result selected is an order result.

Other functions

View recording 2022.JPG View recording: Open the signal monitoring window on top of the current layout. In the case of this window is already opened in another layout, it swaps to this layout.
Reports Tools Ribbons 438.png Freeze trace (F10): Freeze/unfreeze (toggle) the traces of the active window.
Reports Tools Ribbons 439.png Freeze all traces: Freeze/unfreeze (toggle) all the displayed traces in the active Layout
Reports Tools Ribbons 437.png Refresh all: Force the refreshment of displayed data. Applies to all windows and all traces. Used in case of de synchronization between the hardware and the software.
Reports Tools Ribbons 436.png Open infotrace: Opens or closes (toggle) the infotrace of the active windows. The infotrace contains the trace(s) identification, the cursor and marker values and the section data for the 3D waterfall windows. See chapter 2 –Display - § area for details
Reports Tools Ribbons 435.png Close all: Close all the windows in the active Layout.
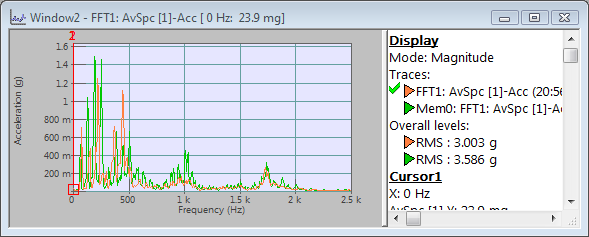
Memorize trace 2022.JPG Memorize trace: Creates an instant copy of the active trace in the active window. The memorized trace add incrementally traces called Memx in the current window.

Reports Tools Ribbons 291.png

These memorized traces can be added to the save selection using the "add to result selection" entry of the window contextual menu.
See memorize trace page for details.


Arrangement group

Arrangement group 2022.PNG

Reports Tools Ribbons 229.png Full screen: Put the active windows in full screen mode. The NVGate frame windows will take the whole screen space. The full screen is inactivated by clicking on it or in reducing the window with the upper right button.
Windows arrangement button 2022.png Allows arranging automatically the windows in the current layout.


Windows arrangement automatic 2022.png Automatic: Organizes windows in the best possible arrangement according to the type and contents of the graphs.
Windows arrangement cascade 2022.png Cascade: Cascades the windows according to the Windows operating system rules.
Windows arrangement vertical 2022.png Vertical: Tiles windows vertically according to the Windows operating system rules.
Windows arrangement horizontal 2022.png Horizontal: Tiles windows horizontally according to the Windows operating system rules.
Windows arrangement grid 2022.png Grid: Tiles windows in order to have all windows with the same size.

Display add layout 2022.PNG Add layout: Creates a new layout. A dialog box used to name the new layout is displayed by clicking on the button. A new tab is created and selected, corresponding to the new layout.


View group

View group 2022.PNG

Display switch layout 2022.png Browse layouts (CTRL+SHIFT+SPACE): scan the existing layouts. Note: the 2 latest viewed layouts are kept in the RAM memory. Using the CTRL+SPACE shortcut allows switching between these 2 layouts.
Display active layout 2022.png Active layout: Displays the name of the active layout. The selection list enables to activate any existing layout.
Display cursor 2022.png Cursor: If this button is activated, the mouse can move the cursor(s) on the displayed graphs.


Scales group

Control the windows graphical zooms and auto-scaling.

Scales group 2022.PNG

Display zoom 2022.PNG Zoom (CTRL+F6): When this mode is activated, the mouse pointer has following shape: Display Graphs Traces 17.png. Left-click drag using the mouse in order to draw a rectangle to zoom into. When the left-button is released, the displayed area corresponds to the area defined by the rectangle. Note: If the size of the rectangle is smaller than the active signal precision displayed in the window, the zoom is not completed.

To quit the zoom mode, press the zoom button again: this will activate the cursor mode.

Reports Tools Ribbons 444.png Zoom in Y: Makes the Y-scale two times smaller.
Reports Tools Ribbons 445.png Zoom out Y: Makes the Y-scale two times larger.
Reports Tools Ribbons 446.png Zoom in X: Makes the X-scale two times smaller and sets the minimum and maximum values so that the cursor is in the middle of the graph.
Reports Tools Ribbons 447.png Zoom out X: Makes the X-scale twice as large and sets the minimum and maximum values so that the cursor is in the middle of the graph.
Display autoscale 2022.PNG Autoscale (CTRL+A) : Adjusts the Y scale of all the windows in the current layout. The scales are adjusted to the largest trace amplitude (min and max) in each graph. A 10% margin is added to these values to facilitate visibility. Note: The minimum Y scale width cannot be lower than the active signal precision.
Display x z adjust 2022.PNG X/Z Adjust (CTRL+Q): Adjust minimum and maximum values of the X or Z-scale so that every point on the axis is visible.

See chapter 2 –Display - § Display window/graph menu / X zoom for details

Display scale 2022.PNG Scale (CTRL+F5): This mode is used to modify scales using the mouse in graphs, by moving the cursor on the scale. The shape of the mouse pointer changes depending on the position of the mouse pointer on the scale:

Display Graphs Traces 16.png
Use the mouse wheel or the Up/Down arrows to change the scale value. If the Ctrl key is pressed, the changes are five times smaller, for more precise adjustment of the value modified.
To quit the scale mode, press the scale button again: this will activate the cursor mode.

Mouse cursor Position on the scale and action
Reports Tools Ribbons 297.png
Reports Tools Ribbons 298.png
On the lower left part of the scale. Only the minimum value of the scale is modified.
Reports Tools Ribbons 299.png
Reports Tools Ribbons 300.png
On the upper right part of the scale. Only the maximum value of the scale is modified.
Reports Tools Ribbons 301.png
Reports Tools Ribbons 302.png
On the center of the scale. Both minimum and maximum values are modified, in the same direction. This performs a translation of the scale
Reports Tools Ribbons 303.png
Reports Tools Ribbons 304.png
On the center of the scale, with Shift key pressed. Both minimum and maximum values are modified, in the opposite direction. This zooms in/out.

Display move 2022.PNG Move (CTRL+F8): When this mode is activated, the mouse pointer has following shape: Display Graphs Traces 19.png. Left click on the graph and use the mouse to drag.

To quit the Move mode, press the Move button again: this will activate the cursor mode.

Reports Tools Ribbons 443.png Reset scale (CTRL+Z): Reset X, Y and Z axis scale of the active window to their default values, which are:
  • X scale: max bandwidth
  • Y scale: Active input range
  • Z scale: default profile/waterfall depth.


Markers group

Display markers 2022.PNG

Features a complete set of real-time markers that help identifying typical signature and points of exception in both time and spectral graphs.

Display marker mode 2022.PNG Marker mode: activates the Marker mode. Once the Marker mode is activated, the mouse pointer has following shape: Display Graphs Traces 21.png. The mouse pointer can be used to modify the marker position and properties.

To quit the Marker mode, press the Marker mode button again: this will activate the cursor mode.

Display marker type 2022.PNG Marker type selection: enables to select the active Marker type.


Reports Tools Ribbons 457.png Free marker: The free marker can be positioned everywhere to add a legend in a spectra, profile, 1/n octave and waterfall section.
Reports Tools Ribbons 458.png Harmonics marker: The harmonic marker can be positioned everywhere in a spectra and waterfall X/Y sections. Computes and displays harmonic values for the selected trace(s).
Reports Tools Ribbons 459.png Peaks marker: The peak marker detects automatically the peaks in the spectra and waterfall X/Y sections. Computes and displays peak values for the selected trace(s).
Reports Tools Ribbons 460.png Maximums marker: The max marker detects automatically the maximum in the spectra and waterfall X/Y sections. Computes and displays max values for the selected trace(s).
Reports Tools Ribbons 461.png Side bands marker: The Sideband marker can be positioned everywhere in a spectra and waterfall X/Y sections. Displays values for a central frequency and side frequencies (left and right) defined by a delta value.
Reports Tools Ribbons 462.png Power band marker: The power-band marker can be positioned everywhere in a spectra and waterfall X/Y sections. It extracts the RMS power in the selected band taking in account the equivalent bandwidth of the weighting window. Computes and displays power in signal range defined by start position and delta.
Reports Tools Ribbons 463.png 1/n oct data marker: The 1/n octave data marker can be positioned in CPB spectra and waterfall X/Y sections of the same type. It extracts the list of the band levels in db or linear units into the infotrace. Displays all band values.
Reports Tools Ribbons 464.png Kinematic marker: The Kinematic marker can be positioned everywhere in a spectra and waterfall X/Y sections. The Kinematic marker helps identifying the frequencies (or orders) which match the various rotating speed in machineries. These frequencies are linked with a fundamental one (usually the main shaft rotating frequency) by fixed ratio. These ratios depend on the machinery kinematics.
Reports Tools Ribbons 465.png Periods marker: The period marker can be positioned in trigger blocks windows. Operates like an harmonic marker but in the time domain. Computes and displays periodic values for the selected trace(s). The periodic marker allows identifying the periodicity and frequency of repeated phenomena identified into time series graphs.

See Marker page for more details.

Waterfall group

The Waterfall group offers a wide range of operation in order to go further in your measurement. It is possible to display XY and YZ sections as well as the extraction section. This group provides general purpose tools about the Waterfall 3D graphs.

Waterfall group 2022.PNG

See Waterfall display for more details.