NVGate Event definition
Event definition
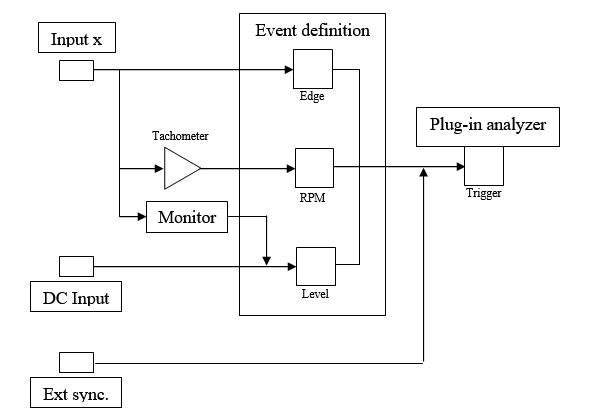
This module is used to define multiple events that can start, stop, and trigger the plug-ins or the source modules such as Recorder and Player.
Connect
On the acquisition tab, this area manages events and corresponding triggers. This group allows selecting the event type (source, setup) and associates it with the plug-in analyzers triggers
This button opens the corresponding Event properties. The opened dialog shows both the source signal setup and the detection settings (may be split in different tabs).
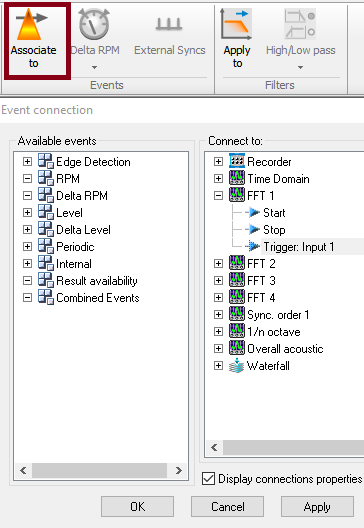
On this dialog box you can easily "drag and drop" events to "start", "Stop" or "trigger" any NVGate plug in.
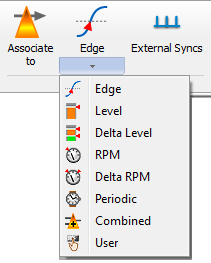
The available event types are below:
Edge detection
![]() Edge: Detect when the signal from an input or a recorded track crosses a threshold.
This module is used with the analog inputs (tach pulse or hammer impact). This trigger can be applied to any plug-in analyzer including Waterfall and Recorder.
Edge: Detect when the signal from an input or a recorded track crosses a threshold.
This module is used with the analog inputs (tach pulse or hammer impact). This trigger can be applied to any plug-in analyzer including Waterfall and Recorder.
- Label: the name of the event (by default Edge n, with 1 <= n <= 2).
- SourceInput 5 to input 8 are not able to be set as source using an OR35 analyzer.: selects the signal input source. The user can choose any Front-end fast analog input (in connected mode on-line) or from the Player (in post-analysis mode).
- Input 'filter': adds a digital filter before the edge detection process. The user can choose any filter from the list of the defined filters.
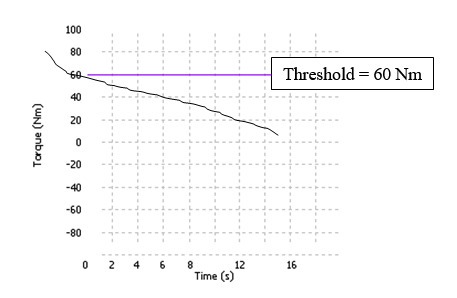
- Threshold: sets the signal threshold for edge detection. The threshold is expressed in the same unit as for the input signal. The value can be adjusted between +/- the full input signal scale (depending on the input range).
- Slope: selects the slope of the input signal on which a transition is detected.
| Slope | Description |
| Rise | The events are detected on rising edge of the input signal |
| Fall | The events are detected on falling edge of the input signal |
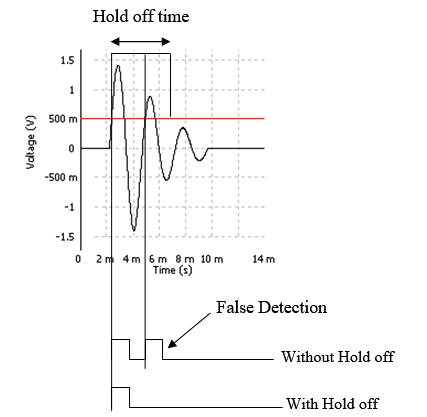
- Hold off: defines the minimum time (expressed in seconds) between the detection of two edges. If a transition is detected before this time has expired since the last valid event then the new edge is rejected. The user can enter any value between 0 and 36000s.
- Hystersis: defines the hystersis around the threshold. The value can be adjusted between 0 and the full scale of the input signal (depending on the input range). If Slope is set to RISE, the input signal must go below Threshold - Hystersis before a new event can be detected. If Slope is set to FALL, the input signal must go above Threshold + Hystersis before a new event can be detected. This setting is used to reject false edge detection following, for example, an input signal transition.
RPM
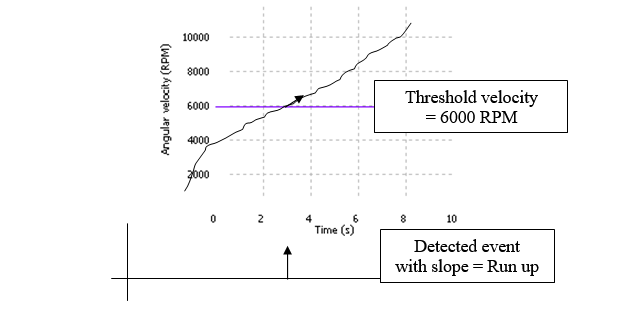
![]() RPM: Detect when a tachometer is below or above a specified angular speed. This module is associated with the Tachometer module. You need to first activate it on Tachometer plug in. This trigger can be applied to any plug-in analyzer including Waterfall and Recorder.
RPM: Detect when a tachometer is below or above a specified angular speed. This module is associated with the Tachometer module. You need to first activate it on Tachometer plug in. This trigger can be applied to any plug-in analyzer including Waterfall and Recorder.
- Label: the name of the event (by default RPM n, with 1 <= n <= 2).
- Source: selects the tach source. The user can choose any active tach as the source of the RPM event.
- Threshold velocity: defines the threshold velocity for detecting an event. The user can enter any value between the Min Speed and the Max Speed setting values defined in the tach source.
- Slope: selects the slope of the tach velocity evolution on which a transition is detected.
| Slope | Description |
| Run up | Events are detected on speed acceleration |
| Run down | Events are detected on speed deceleration |
- Hystersis: defines the hystersis around the threshold. The value can be adjusted between 0 and the Max Speed setting of the tach source. If Slope is set to RISE, the velocity must go below Threshold - Hystersis before a new event can be detected. If Slope is set to FALL, the velocity must go above Threshold + Hystersis before a new event can be detected. This setting is used to reject false edges detection following, for example, tach velocity transition.
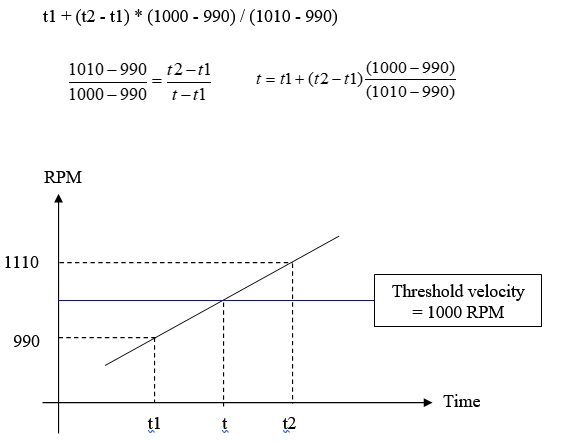
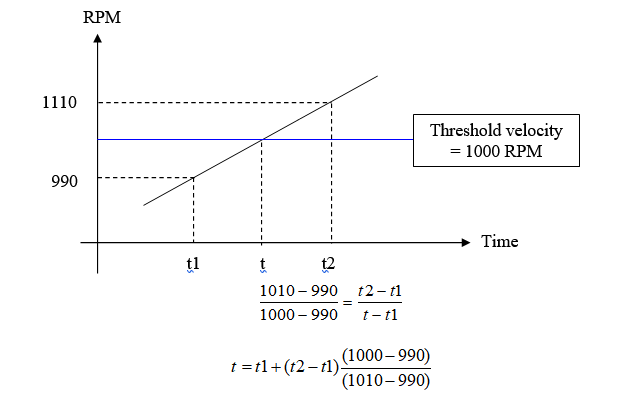
- Interpolation: used for the interpolation of the event date. For example, if Threshold velocity is 1000 RPM and if the tach delivers a revolution at 990 RPM beginning on date t1 and a revolution at 1010 RPM beginning on date t2:
- if the Interpolation is disabled, the event is detected on date t2
- if the Interpolation is enabled, the event is detected on date
- Average size: defines the average number used to compute the average speed. Revolution number n average speed is: avrg_speed[n-1] + (inst_speed[n-1] - avrg_speed[n-1]) / avrg_size.
Delta RPM
![]() Delta-RPM: Same as RPM but generates an event at each step. This module is associated with the Tachometer module. You need first to activate it on Tachometer plug in. It is used to trigger a plug-in by step. This trigger can be applied to any plug-in analyzer including Waterfall and Recorder.
Delta-RPM: Same as RPM but generates an event at each step. This module is associated with the Tachometer module. You need first to activate it on Tachometer plug in. It is used to trigger a plug-in by step. This trigger can be applied to any plug-in analyzer including Waterfall and Recorder.
- Label: the name of the event (by default Delta RPM n, with 1 <= n <= 2).
- Source: selects the tach source. The user can choose any active tach as source of the Delta RPM event.
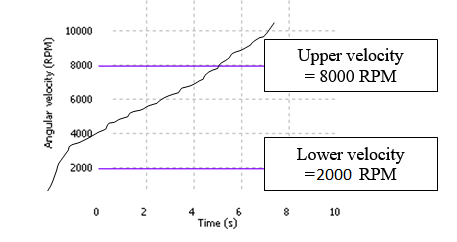
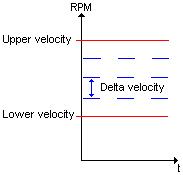
- Lower velocity: the level above which the velocity variation condition is tested for launching the delta RPM event.
- Upper velocity: the level below which the velocity variation condition is tested for launching the delta RPM event.
- Delta velocity: the variation in velocity that launches the event.
- Number of events: the number of events between Upper velocity and Lower velocity (considering Delta velocity).
- Slope: selects the slope of the tach velocity evolution on which a transition is detected.
| Slope | Description |
| Run up | Events are detected on speed acceleration |
| Run down | Events are detected on speed deceleration |
| First | The first event detected (during rise or fall) determines the slope of this event. |
| Any | Events are detected on speed acceleration and deceleration. |
- Interpolation: Used for the interpolation of the event date. For example, if Threshold velocity is 1000 RPM and if the tach delivers a revolution at 990 RPM beginning at the date t1 and a revolution at 1010 RPM beginning on date t2:
- If the Interpolation is disabled, the event is detected on date t2
- If the interpolation is enabled, the event is detected on date t1 + (t2 - t1) * (1000 - 990) / (1010 - 990)
- Average size: defines the average number used to compute the average speed. Revolution number n average speed is: avrg_speed[n-1] + (inst_speed[n-1] - avrg_speed[n-1]) / avrg_size.
Level
![]() Level: Detect when a signal is below or above a level
This module is used with DC inputs (optional) and/or associated with the TDA or Monitor module. This event can be applied to any plug-in analyzer including Waterfall and Recorder.
Level: Detect when a signal is below or above a level
This module is used with DC inputs (optional) and/or associated with the TDA or Monitor module. This event can be applied to any plug-in analyzer including Waterfall and Recorder.
- Label: the name of the event (by default Level n, with 1 <= n <= 4).
- Source: selects a DC input or a Monitor channel as source of the level event.
- Type: the type of measurement for level detection.
| Type | Description |
| DC | measurement of the input DC level |
| Min | measurement of the minimum signed input level |
| Max | measurement of the maximum signed input level |
| RMS | measurement of the input RMS level |
| Skew | measurement of the input skew level |
| Kurtosis | measurement of the input kurtosis level |
Hidden/fixed: The type is fixed to DC if the source is a DC input.
- Threshold: The threshold of the level event. The limitation is +/- Range peak of the source for DC, Min and Max types. The limitation is +/- 20 for skew. The value goes from 1 to 250 for kurtosis and from 0 to Range peak of the source for RMS. This setting can be displayed in dB if the measurement type chosen is RMS.
- Status:
| Status | Description |
| Above | The event is detected if the measured value is above the threshold. |
| Under | The event is detected if the measured value is below the threshold. |
Delta level
![]() This module is used with DC inputs (optional) and/or associated with the Monitor module. It is used to trigger a plug-in by step. This trigger can be applied to any plug-in analyzer including Waterfall and Recorder.
This module is used with DC inputs (optional) and/or associated with the Monitor module. It is used to trigger a plug-in by step. This trigger can be applied to any plug-in analyzer including Waterfall and Recorder.
- Label: the name of the event (by default Delta n, with 1 <= n <= 4).
- Source: selects a DC input or a Monitor channel as source of the level event.
- Type: the type of measurement for delta level detection.
| Type | Description |
| DC | measurement of the input DC level |
| Min | measurement of the minimum signed input level |
| Max | measurement of the maximum signed input level |
| RMS | measurement of the input RMS level |
| Skew | measurement of the input skew level |
| Kurtosis | measurement of the input kurtosis level |
Hidden/fixed: The type is fixed to DC if the source is a DC input.
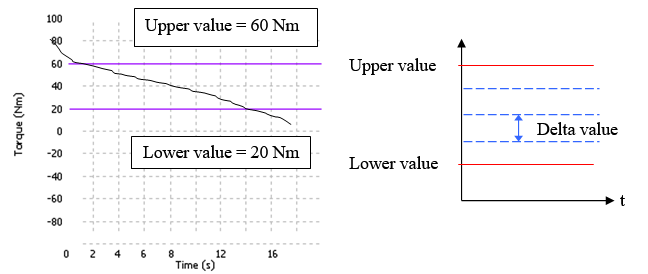
- Lower value: the lower level of the delta level event. Its minimum value is - Range peak of the source for DC, Min and Max types. It is 0 for RMS, - 20 for skew and 1 for kurtosis. This setting can be displayed in if the measurement type chosen is RMS.
- Upper value: the upper level of the delta level event. Its maximum value is Range Peak of the source for DC, Min, Max and RMS types. It is 20 for skew, and 250 for kurtosis. This setting can be displayed in dB if the measurement type chosen is RMS.
- Delta value: This setting can be displayed in dB if the measurement type chosen is RMS.
- Slope: selects the slope of the level evolution on which a transition is detected.
| Slope | Description |
| Rise | The events are detected on an increasing level |
| Fall | The events are detected on a decreasing level |
| First | The first event detected (during rise or fall) determines the slope of this event. |
| Any | The events are detected on a increasing or decreasing level |
Periodic
![]() Periodic: Used to trigger a plug-in by periodic step. This event can be applied to any plug-in analyzer including Waterfall and Recorder.
Periodic: Used to trigger a plug-in by periodic step. This event can be applied to any plug-in analyzer including Waterfall and Recorder.
- Label: the name of the event (by default Periodic n, with 1 <= n <= 2).
- Period: defines the event generation period. An event is generated every Period second (the first one is generated 1 period after the run). The user can enter a value between 2 ms and 1000000 s.
Combined events
![]() Combined: Generates an event which is the result of a combination of 2 events. Possible combinations are: OR, AND and AFTER.
Combined: Generates an event which is the result of a combination of 2 events. Possible combinations are: OR, AND and AFTER.
- Label: the name of the event (Default: Combination n, with 1 <= n <= 2).
- Event A: defines the first operand of the combined event. The user can choose any defined event as operand except for a combined event.
- User: defines the user used to detect a new event from the two operands, Event A and Event B.
| User | Description |
| A or B | An event is generated when event A or B occurs |
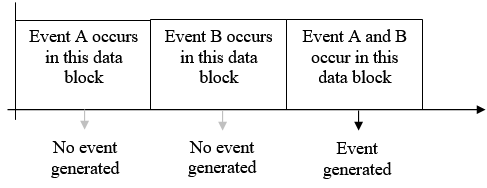
| A and B | An event is generated when both event A and B occur at the same time (in the same data block = 256 pts) Example:
|
| A after B | An event is generated when event A occurs after event B. |
- Event B: defines the second operand of the combined event. The user can choose any defined event as operand except for a combined event.
User events
![]() User: Generates an event when the operator presses the corresponding event button in the software/remote controller interface.
Four user events are available. These events are compatible with the macros. They are particularly useful to run several plug-ins at different time in the same analysis. It can also be put in the control panel or controlled by NVDrive.
User: Generates an event when the operator presses the corresponding event button in the software/remote controller interface.
Four user events are available. These events are compatible with the macros. They are particularly useful to run several plug-ins at different time in the same analysis. It can also be put in the control panel or controlled by NVDrive.
- Label: Allows to rename the event.
- Trigger: The user event’s triggering.
External Synch
![]() External synch: Properties of the Ext synch trigger inputs.
External synch: Properties of the Ext synch trigger inputs.
Monitoring Solution
If you would like more advanced trigger and actions, please have a look on the the monitoring solution.
