NVGate Project manager
TPROJECT MANAGER & USER PREFERENCES
Reference manual Vol 4
Table of contents
Results and setup management
Results and setup management
Introduction
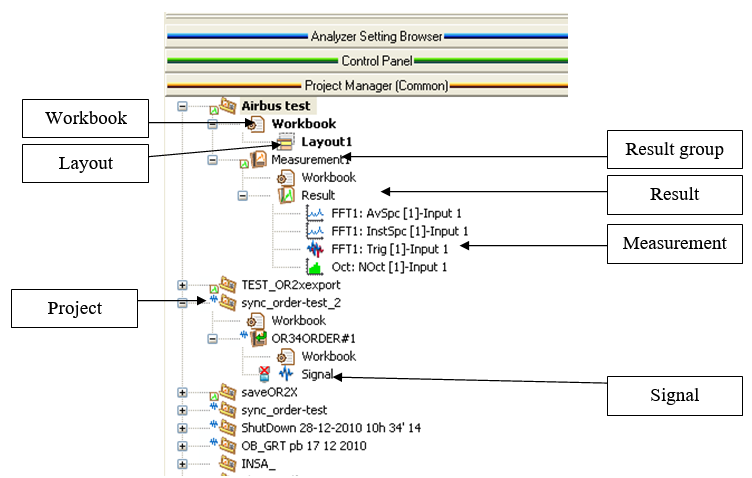
The Project Manager is made up of 3 main parts; the Workbook, the Project and the Measurement.
Project manager
The Project Manager is used to store all your projects, results, and measurements... There are several display options that enable you to show or hide certain items. You can display some results with drag and drop.
Item definitions
====Project
==
The project is the highest level of the organizational structure. It contains at least one workbook and can receive an unlimited number of measurements. The project has therefore two main aspects:
- Configuration of the analyzer and the interface using the workbook
- Storage of data using the measurements
There is always one active project. This is this project that receives the new measurements. The project workbook configures the analyzer. To load a project, select the load command in the pop-up menu associated with the project item.
====Workbook
==
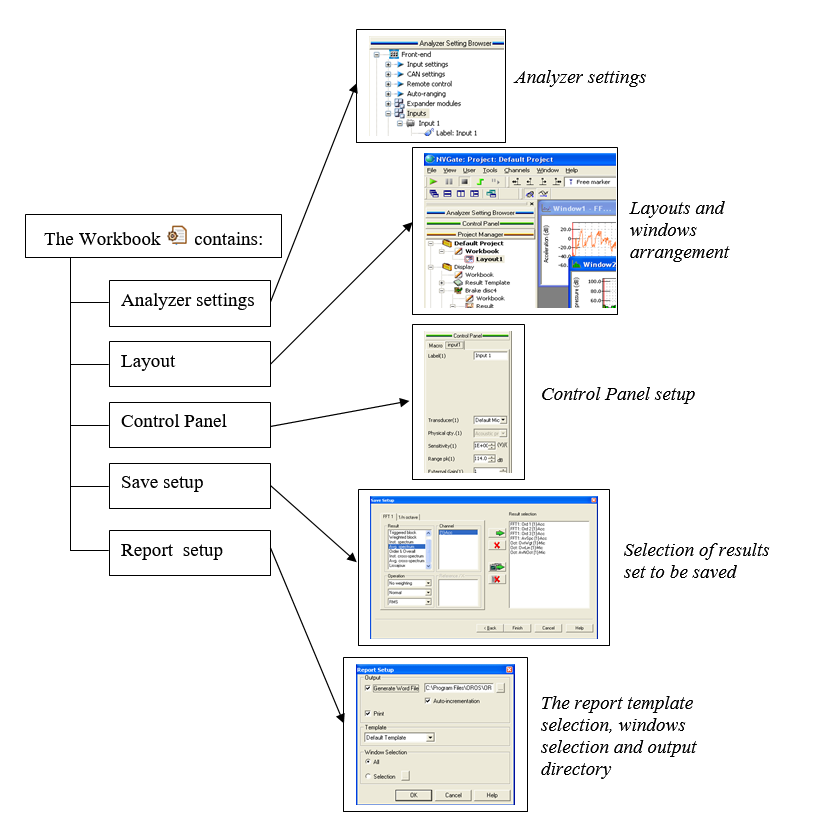
The workbook is designed to manage the analyzer and software setup. The table below gives the details of the functions managed by the workbook
| Analyzer setup | The value of all analyzer settings. |
| Layout | All windows displaying results are stored in layouts. |
| Control panel | The personalization of the control panel |
| Save setup | All results that must saved when a new measurement is created |
| Report setup | All information regarding report generation. |
Saving
The project workbook is saved when the project is saved. This can be done several ways:
- Select the "Save" command in the pop-up menu associated with the project item.
- Select the "Save project" command from the file menu
- Use the shortcut "Ctrl + D"
A workbook is created when a measurement is created. This workbook is the copy of the project workbook at the time the measurement is created. This allows you to recover the settings used for a measurement possibly reuse them.
Loading
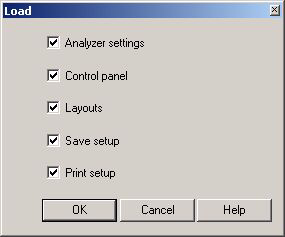
The workbook is automatically loaded when a project is loaded. It is also possible to load the content of any other workbook to the workbook of the active project. This load can be complete or partial and can be done by:
- Selecting the "Load" or "Partial load" command in the pop-up menu associated with the workbook item.
- Selecting the "Reload" or "Partial reload" command in the pop-up menu associated with the active workbook item. In this case, the last saved copy of this workbook is used.
- Select the "Change workbook" command in the pop-up menu associated with the project item.
This allows you to select any workbook from project database or any workbook template.
Activating
When a measurement is loaded, selecting the appropriate workbook can do the switch between the measurement and the result mode. This selection can be made by:
- Selecting the "Activate" command in the pop-up menu associated with the workbook item.
=====Layout
=
The layout is the part of the workbook that contains the graphic windows. There is no limitation of number of layouts, but the workbook always has at least one layout.
The windows displayed are the active layout windows. There are several ways to select a layout:
- Double-click on the layout item in the project manager.
- Select the load command in the pop-up menu associated with the layout item in the project manager.
- Selecting the layout from the tab "measurement" :
- Use the shortcut "Ctrl + Space bar" to switch to the previous active layout.
- Use the shortcut "Ctrl + Maj+ Space bar" to switch to the next the layout
Notes: The layouts are associated with the analysis mode (Measurement or Result mode) and are available only in the correct mode. Therefore, a name used for a layout in the measurement mode will not be available in result mode.
- The selected tabulation of the control panel is related to the layout. This is designed to minimize the selection in the workspace.
====Result Template
==
This item appears when results template are added to the project. They can be added from the Tab "tools": Mask or from the "Add to result template" menu in a window.
Displaying
To display the result template, Double-click on the item or select the "Display" command from the pop-up menu associated with the item
Editing
To edit and modify the template result, use the Tools\Result Template\Main menu or the "Edit" command of the pop-up menu associated with the item.
or
====Measurement
==
This item is designed to store data. The data can be of two types:
- Signals coming from the recorder
- Results coming from an analyzer (FFT, Octave, Waterfall...)
A measurement always contains one workbook, which is a copy of the workbook used to create the measurement.
The most important action that can be performed on a measurement is to load it to work in the measurement mode. This can be done from the pop-up menu associated with the item.
====Imported measurement
==
This item comes from the import of a result or a signal file.
The behavior of this item is similar to the behavior of a usual measurement item. It differs only in that the workbook associated with the measurement is empty. There is no information about the analyzer settings, or about the layouts and other workbook elements.
====Result group
==
This item gathers all results of a measurement. The two main actions that can be performed from this item are:
Displaying
Displays all the results of the measurement.
One window per type of result is created limited by the maximum curve the window can contain. This can be done from the pop-up menu associated with the item.
Exporting
Exports all the results of the measurement.
Exports the results in an external format (UFF…). This can be done from the pop-up menu associated with the item.
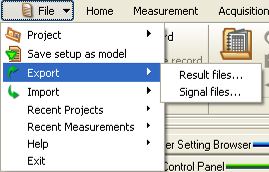
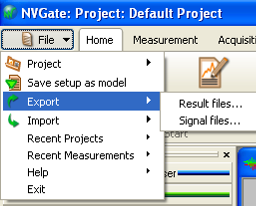
A command to export the results of several measurements at the same time is also available in the "File" menu.
For more details about the export formats, see the "Export" topic from the "Chapter 7: User Preferences".
Result
This type of item can belong to a Result group item, a Ref. Result Item or a Template Result item.
The icon associated with the item indicates the results type. The table below lists the different icons that can be found
The main action that can be performed from this item is to display the result.
A new window is created, containing the result. This can be done from the pop-up menu associated with the item. This can also be done by double clicking on the item.
====Signal
==
This item represents a signal file generated by the recorder. Depending on the analysis, the item points to file located on the PC or the analyzer hard disk (see "Signal location" topic p 18).
The mains actions that can be performed are:
Loading
Loading the file in the player:
Once loaded to the player, the signal can be displayed and post-analyzed. To load the file to the player, select the command "load in player" in the pop-up menu associated with the signal item. The signal file can also be loaded and displayed at once by double clicking on the signal item.
When the analyzer is connected, only files located on the analyzer hard disk can be loaded.
When the analyzer is not connected, only files located on the PC hard disk can be loaded.
In order to post-analyze the selected signal, a shortcut is available by right-clicking on the specified signal.
Uploading/Downloading
Upload\Download:
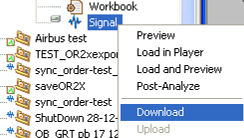
Used to transfer files to\from the analyzer hard disk from\to the PC hard disk. This can be done from the pop-up menu associated with the signal item.
A command to transfer several files at the same time is also
Signals management
NVGate signal provides signal storage devices and used hardware for single and multi-hardware acquisitions.
2 dialog allows that the signal properties and the disk manager.
available in the "home" tab.
Signal properties
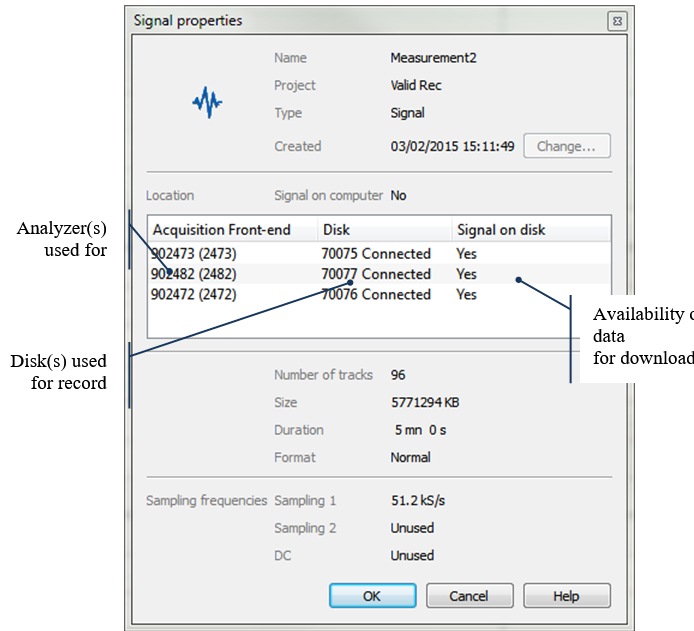
The properties of recorded signals includes location and traceability.
The analyzer(s) which have been used to record the signal are memorized in the column Acquisition Front-end. It is the easy to identify records that may be altered by a faulty input.
- Same thing regarding the used (Mobi-) disks.
- These information are memorized with the measurement itself. They are available even if the analyzer or the disk is not connected.
- The Signal on disk indicates the presence of record file on the connected disks: Yes/No or a question mark when the disk is not connected.
Disks manager
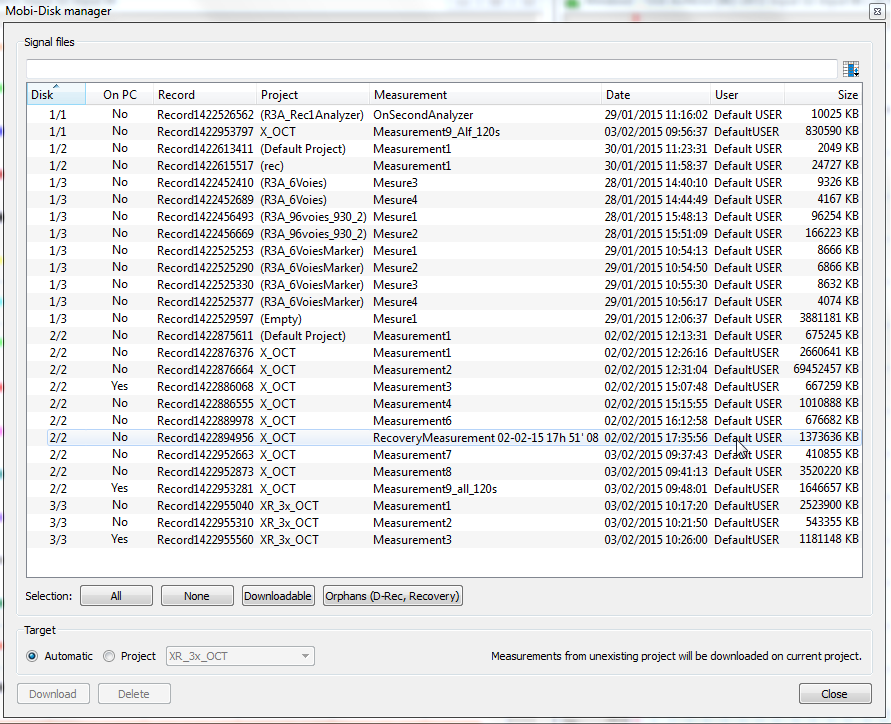
The disk management has also been adjusted allowing the management of multi-disk measurements. This dialog is accessible through the Home/Disk ribbon group.
Both Manage and Download button open it.
The dialog shows all records which have at least one file on the active disk(s): On analyzer(s) or on PC USB.
The preselection buttons have been synthetized in 3 categories:
- All / None: for backup or disk cleaning.
- Downloadable: Select records which have corresponding project & measurement in the Project Manager
- Orphans: Select records which haven't any corresponding project & measurement in the Project Manager
NB: Preselection buttons do not select partial records, i.e. one or more disks are not connected. Use manual selection to download an incomplete record. Warning this is a definitive action. It will be impossible to add missing files later.
The Target choice allows choosing the download destination:
- Automatic: add each signal file in the Project/Measurement used for its acquisition. Note that records without Project/Measurement correspondence in the Project manager will be added in the current project.
- Project: add the signal files in the selected project regardless their original project.
Exporting
Export:
Exports the signal file in an external format (wav…).
A signal can be exported only when it is located on the PC hard disk. The export can be done from the pop-up menu associated with the signal item.
A command to export several files at the same time is also available in the "File" menu.
For more details about the export formats, see the "Export" topic from the "Chapter 7: User Preferences".
Item status
Protection
An icon can appear to the left of the project, workbook, layout and measurement icon. When there is no icon, this means that the item is not protected. The table below explains the meaning of the 6 icons that can be found:
| The item is in read-only. This protection can be removed using the properties command by unselecting the read-only protection. | |
| The item does not belong to the current user and is protected by its user. The current user cannot modify this item. | |
| The item does not belong to the current user, but is not protected. The current user can freely use this item. |
Signal location
An icon to the left of the Signal icon indicates the location of the signal file. The table below explains the meaning of the 6 icons that can be found:
| The file is only on the analyzer hard disk | |
| The file is only on the PC hard disk | |
| The file is on both the PC and the analyzer hard disk | |
| The file is on the PC and the analyzer is not connected (The file might also be on the analyzer hard disk) | |
| The file is not on the PC and the analyzer is not connected (The file might also be on the analyzer hard disk) | |
| The file is not found on the PC or on the analyzer hard disk |
Active Items
When the action "Load" is performed for an item, then the item is active (the name of the item is displayed in bold).
An item is active when it is bold. The 4 items that can be active are:
Rules
Measurement creation
The way a new measurement is created is defined in the Save Setup dialog box using the Save Option property.
There are some specific cases where the behavior defined by the Save Option must be overridden:
- When the recorder is stopped, a measurement is created, overriding the "Do not save" choice
- When the recorder is stopped, the measurement takes an specific name, overriding the "In default measurement" choice
- For multi-analysis, the results corresponding to the different plug-ins are saved in separate measurements if the plug-ins do not stop simultaneously. While NVGate is Running (meaning that at least one plug-in is still running), the measurements are saved with "With name confirmation" unless the Save option choice is "Do not save".
Recovered project
Each time NVGate is not closed correctly and a default measurement is present in the project, the project is automatically loaded when NVGate is launched, to ensure that no data is lost. If the project was the "Default project", then to the user is prompted to rename this project "Recovered project".
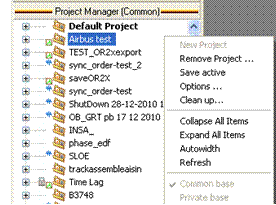
The contextual menus are accessible by right clicking on the area.
General
Appears by right clicking anywhere on the Project Manager background.
New project
This command opens the following dialog box. (select Project tab)
- Create new: Launche the following dialog box and start a setup wizard according to the following choices:
- On line Guide the user along the setup of an on-line & real-time analysis/recording. The inputs of the instruments will be proceed
- Post-analysis Guide the user along the setup of a pos-processing analysis/recording. The recorded/imported raw data will be proceed
- Name: It is necessary to enter a name that is not already used in the project base. The name "Default project" is also not allowed.
- Workbook
- Default: All the analyzer settings are set to default and all the windows are closed. The project created will be completely empty.
- Current: The new project is created using the current workbook settings. It is similar to the "Save As" command
- Model: The new project is created using the settings of a model workbook. It is equivalent to creating the project from an empty workbook and then loading a specific workbook
=
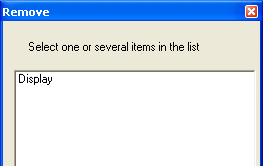
Remove project===== This command opens the following dialog box.
You may also remove one or several projects from the project base. The current project cannot be removed.
Save active
This command saves the current project and, if there is a measurement loaded, it also saves the current measurement.
Options
This command opens the following dialog box:
This option is used to modify the way the project manager is presented.
- Project: It is possible to hide projects that do not belong to the current user. This is particularly useful when there are multiple NVGate users on the same PC.
The project can be sorted alphabetically, chronologically or inversely chronologically
- Measurement: The measurement can be filtered by keyword. The keywords are assigned to the measurement when it is created, or can be changed in measurement properties. This option is very helpful when organizing measurement campaigns.
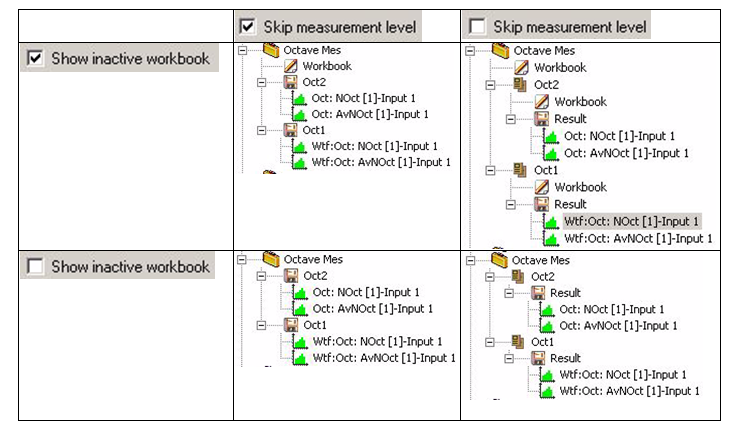
- General: It is possible to hide all the inactive workbooks and to delete the measurement level. The table below illustrates the differences
- Save in user preferences:
These settings can be stored in the user preferences and can be set in the preferences.
See "Chapter 7: User preferences".
Clean up
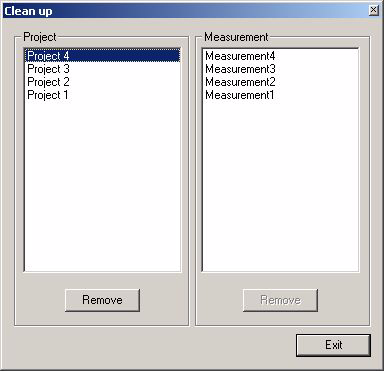
The purpose of the following dialog box is to accelerate the cleaning of the project base. It is used to remove projects or measurements.
- Project: The list contains all projects except the current one. Once a project is selected, it is possible to remove the full project or to select a measurement to remove. If several projects are selected, it is then only possible to remove the selected project.
- Measurement: When one project is selected, the list of project measurements is displayed and available to be removed.
Collapse all items
Collapses all the branch of the project manager tree. Only the project items are visible
Expand all items
Expands the entire branch of the project manager tree. All the items of the tree are visible. This can make the tree very large.
Auto width
Adjusts the width of the tree to the widest branch, so that every item is fully visible.
Project
- Save: This command is available only on the current project. It saves the project workbook.
- Save as: This command is available only on the current project. It saves the project with a different name. It is a way of copying the current project.
Properties
This command gives general information about the project.
It is possible to modify the project attribute. When "Read-only" is selected, it is not possible to modify the project. When "Read-only to all other users" is selected, the project cannot be modified by another user, but can be used freely.
"Allow access to" property must be set on "All users" to enable restricted users to use this project.
A comments area is available to add information. (Use "Ctrl + Return" to start a new line).
The "Stand alone" button is available only when the project is linked to a stand-alone session. It gives information about the session and may be used to abort the session.
Rename
This command is not available on the current project (Use "Save As" instead). It may be used to change the name of the project.
Load
This command loads the selected project. The project becomes the current project.
Remove
This command removes the selected project. The data contained is lost permanently.
Workbook
Load
This command loads the selected workbook to the current project.
Note: when the current project workbook is saved, the initial workbook (the one initially loaded) is not modified.
Partial load
This command is similar to the "Load" command, but only parts of the workbook are loaded.
The parts of the workbook that are not selected remain unchanged.
Reload
This command is available only for the current project workbook. This command reloads the workbook of the current project workbook. This means that the workbook recovers the setup it had the last time it was saved.
Partial Reload
This command is available only for the current project workbook. This command is similar to the "Reload" command, but only parts of the workbook are loaded.
The parts of the workbook that are not selected remain unchanged.
Save
This command is available only for the current project workbook. This command saves the workbook.
Save as Model
This command is available only for the current project workbook. This command saves the workbook in the workbook library. This makes the workbook available, however the project database will change in the future. The workbook models are available in the "Project\Change workbook" command and in the "New Project" command.
Activate
This command is available only for the current project workbook in result mode or for the current measurement in measurement mode. It changes the current mode
Add Layout
This command is available only for the current project workbook. It creates a new layout (with the desired name).
Remove Layout
This command is available only for the current project workbook. It removes the selected layout. This destroys all the windows that belong to this layout.
Properties
This command gives general information about the workbook.
It is possible to modify the workbook attributes. When "Read-only" is selected, it is not possible to modify the workbook. When "Read-only to all other users" is selected, the workbook cannot be modified by another user, but can be used freely.
A comments area is available to add information (Use "Ctrl + Return" to start a new line).
Layout
Rename
This command is used to rename the selected layout.
Properties
This command gives general information about the layout.
It is possible to modify the layout attributes. When "Read-only" is selected, it is not possible to modify the layout. When "Read-only to all other users" is selected, the layout cannot be modified by another user, but can be used freely.
A comments area is available to add information (Use "Ctrl + Return" to start a new line).
Measurement
EDIT
This command loads the measurement. The analysis mode is then set to "Result mode"
The Result editor is used for post-analysis of saved results. It allows to switch between 2 measurement workbooks in order to compare the results.
Rename
This command is used to rename the selected measurement.
Remove
This command removes the selected measurement. The data contained are permanently lost.
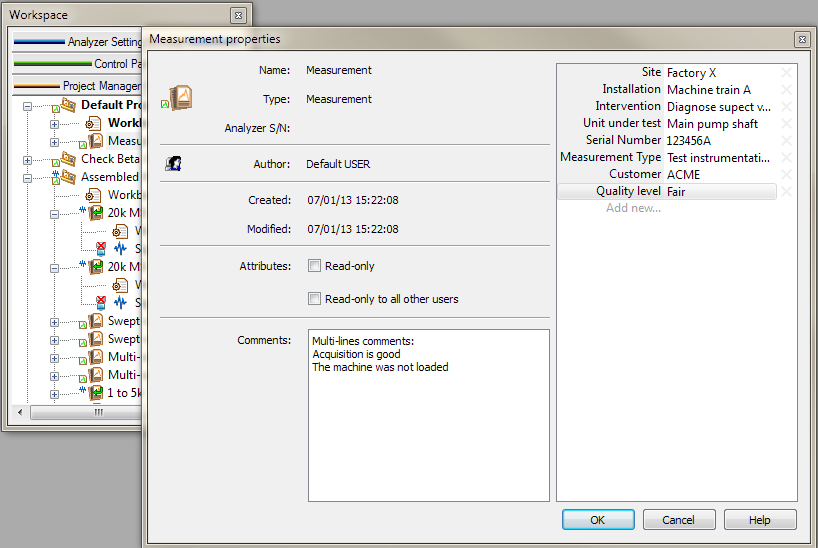
Properties
This command allows viewing or modifying the measurement properties in order to be used for future data mining.
It is possible to modify the measurement attributes depending on authorizations:
- When "Read-only" is selected, it is not possible to modify the measurement.
- When "Read-only to all other users" is selected, the measurement cannot be modified by another user, but can be used freely.
A comments area is available to add information (Use "Ctrl + Return" to start a new line).
Collapse items
This command collapses the entire branch of the selected measurement. Only the measurement item remains visible.
Expand items
This command expands the entire branch of the selected measurement. All items (workbook, results...) are expanded and made visible.
Result group
Remove
This command removes all the measurement result. The data are permanently lost.
Export
This command is used to export the result in an external format.
One or several formats may be selected from the list. It is possible to adjust the conversion via the preferences. The output directory is the folder where the new files will be created. The name will be used to create the output files. It should not contain any extension, as one will be added automatically depending on the format.
For more details about the export formats, see the export topic from the "Chapter 7: User Preferences".
Properties
This command gives general information about the results.
All the plug-ins that have provided results are listed, with their corresponding number of results.
Display
Displays all the measurement results. One window per type of result is created, limited by the maximum curve that the window can contain.
Result
Display
Displays the selected results in a new window.
Remove
This command is available only when the measurement is loaded. It is used to remove the result from the measurement.
Properties
This command gives general information about the result.
Add to template result
This command adds the selected result to the template results of the current project.
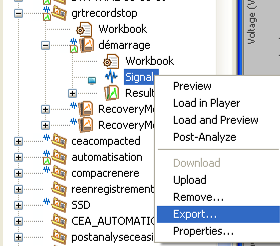
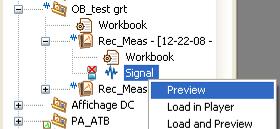
Signal
Preview
This command displays an overview of the signal. This command is available, even if the signal is on the analyzer hard disk and NVGate is in office mode.
Load in Player
This command loads the signal file to the player. It is then possible to display this signal, play the tracks on output, and perform post analysis.
Load and preview
This command combines the two previous commands.
Post-Analyze
This command loads the signal in the player and display the menu 'track connections' in order to define your post-analysis (drag and drop connected tracks to the plug-in analyzer you want to use).
If the time signal is recorded on the PC or on the Mobi-disc™, it is highly recommended to be in office mode (hardware inactive) in order to avoid low performances and malfunctions.
Download
This command is available only when hardware with a hard disk is connected and when the signal has not yet been downloaded. It transfers the recorded signal from the analyzer hard disk to the PC hard disk.
Upload
This command is available only when hardware with hard disk is connected and when the signal is not on the hard disk. It transfers the recorded signal from the PC hard disk to the analyzer hard disk
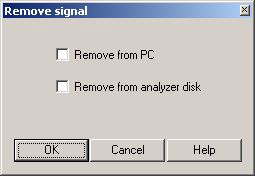
Remove
This command enables to remove the selected signal from the PC if the file is on the PC hard disk and from the analyzer hard disk of the hardware if connected and if the file is on the analyzer hard disk.
If, after removal, the file is not on the PC, or on the analyzer, the signal is permanently lost.
Export
This command is used to export the signal in an external format.
One or several formats may be selected from the list. It is possible to adjust the conversion via the preferences. The output directory is the folder where the new files will be created. The name will be used to create the output files. It should not contain any extension, as one will be added automatically depending on the format.
See more details about the export formats in the "Export" topic from the "User preferences".
Properties
This command gives general information about the result.
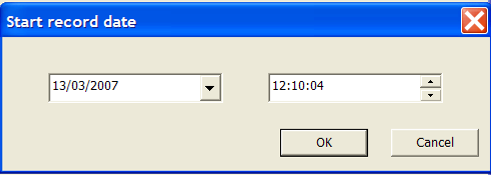
Change date: allows to change the date of the beginning of the signal. It used to display the absolute time.
User preferences
Introduction
The user preferences allow modifying and saving your preferred usages for future uses. NVGate propose to share the software use (from a unique PC) between multiple users allowing them to recall their preferences
The user preferences are saved in the user file (.usr).
Users preferences are accessible from the Home tab/ Preferences group
General
This page is dedicated to general NVGatesetting.
- Default project: When this option is selected, a new project called "Default project" is created when NVGate is launched.
- Last project: When this option is selected, the last project used is loaded when NVGate is launched.
- Default Model: This command is only available when the option "Start with default project" is selected. When this option is selected, the new project will be empty and all settings take their default values.
- Specific Model: This command is only available when the option "Start with default project" is selected. In this case, the new project is created using a workbook model from the library (using 'Load Model'). Use this option to create a project with some default settings and displays specific to your needs.
- Skip identification: This option bypasses user identification prompt. When selected, the last user is automatically selected. This will not work if the user has a password.
- Play sound: Option to produce a sound when a warning or an error is received.
Note: Your computer must have speakers for this option.
- Windows refresh rate: Used to slow down the window refresh rate. This option should be modified only for heavy configurations or when the host computer has a slow processor.
- Scale: Modifies the graph scale font size.
- Infotrace: Modifies the Infotrace graph font size.
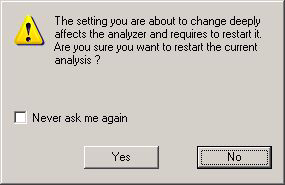
- Change of analyzer setting: When an important setting is modified while the Analyzer is running, a message informs the user that this modification will stop the current analysis.
- Auto-save configuration: Define the periodicity of the current setup automatic saving in minutes. In case of abnormal termination, NVGate will propose to recover the last saved setup. Attention if a large signal file is loaded in the player, a copy of this file will be saved periodically. Thus may lead to short freezes of the software and large disk space use.
- Specialized mode: choose between 'structural' (this mode is dedicated to the acquisition of modal data (through hammer acquisition or signals provided by up to 6 shakers) or 'rotating' (this mode is dedicated to rotating and reciprocating machines).
Select this option to block this message.
- LED size: Select the default size for the inputs led feedback in the status bar: Large or Small. This option is no more active since NVGate V7.00
Project manager
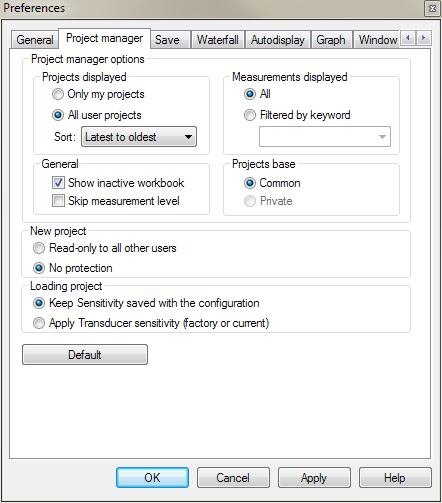
This preference page is used to configure the project manager.
Project manager options
- Only my projects: When this option is selected, only the projects that belong to the current user are displayed. This can be useful when NVGate is used by many users.
- All user projects: When this option is selected, the projects that belong to all users are displayed. This can be used to share data or set-ups between different users.
- Sort: The projects can be displayed in three different ways in the project manager:
| Alphabetical | The projects are classified by their name |
| Latest to oldest | The projects are classified by date created, with the newest project being at the top of the project manager |
| Oldest to latest | The projects are classified by date created, with the newest project being at the bottom of the project manager |
Measurements displayed
- All: all measurements are displayed even the measurements that do not belong to the current user.
- Filtered by keyword: the measurement can be filtered by keyword. The keywords are assigned to the measurement when it is created, or can be changed in measurement properties. This option is very helpful when organizing measurement campaigns.
General
It is possible to hide all the inactive workbooks and to delete the measurement level. The table below illustrates the differences
New project
This option sets the default protection that will be applied to a new project. This protection can be modified later via the project properties.
- Read-only to all other users: he current user does not want to allow other users to modify his projects. Other users can load the project, but will not be allowed to modify it.
- No protection: Any user can freely modify the current user's project.
Save
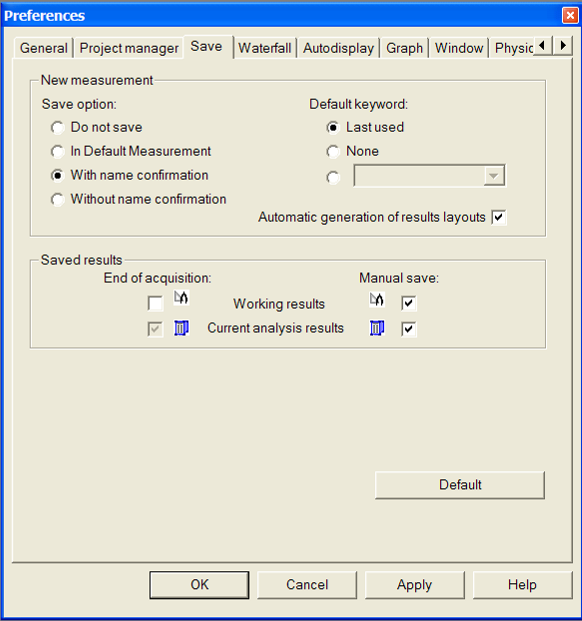
New measurement
- Save option: This option determines the way in which the measurement will be created when the analyzer stops
| Do not save | No measurement will be created. The only way to save the results selected is to perform the Save Result command manually |
| In default measurement | The measurement is created with the name "Default measurement". If a measurement with this name already exists, it is overwritten. |
| With name confirmation | A dialog box will be displayed when the analyzer stops. It will suggest a name using a Base name and an auto increment choice. |
| Without name confirmation | The measurement is created with a name automatically generated from the Base name and the auto increment choice. |
- Default keyword: Used to choose the keyword that will be associated with the new measurement. Refer to the preference section for more information.
- Automatic generation of results layouts: by checking this box, measurement will be saved with the corresponding layout and when this measurement will be open it will be possible to modify the current layout.
Saved Results
- Current Analysis result: Results obtained from an acquisition.
- End of acquisition: open automatically a dialog box to save the results when the analyzer stops.
- Manually: allow to save the results manually.
- Working results: Results obtained after an operation based on already saved results, for example a result calculated with an operator, or the computation of results from an edidted measurement such as FRF H2 from a saved H1. These results can be only saved manually.
Default: set all the parameters to their default values.
Waterfall
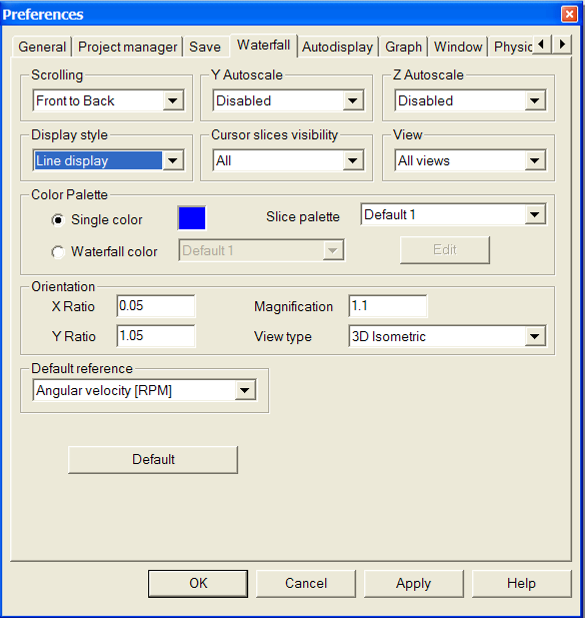
This preference page is dedicated to Waterfall window configuration. Settings specific to the type of result can be modified in the graph preference page.
- Display style
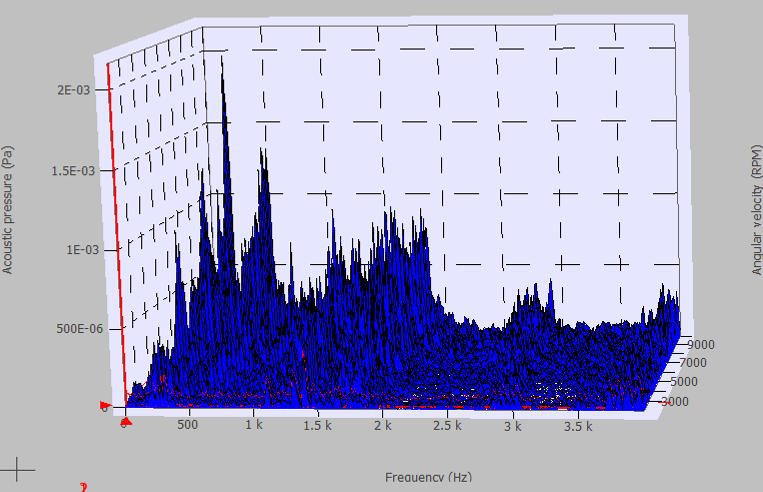
Used to select the Waterfall 3D view style. Three display styles are available:
- Line display: in this mode, each spectrum or block is displayed with a filled plane surface defined by the spectrum points. The fill color is the selected color for single color field.
- If Waterfall color is activated, the current palette is used to compute the color of the points and an interpolation is used to display the spectrum. If not, the spectrum is black.
- Point display: in this mode, only points are displayed. There are no links between them. This mode is useful for small computer configurations or for large Waterfalls with many points or a large depth. If the Waterfall color is activated, the current palette is used to compute the point color. If not, the points get the selected signal color.
- Solid display: this is a colored mode: it displays the Waterfall with interpolation between the points of each spectrum and between two consecutive points with the same x value. This mode is the same one used for the color spectrum view.
- Scrolling
Used to select the scrolling direction. Two are available:
- Front to back: the Waterfall is filled from front to back of the displayed box.
- Back to front: the Waterfall is filled from back to front of the displayed box.
- Color palette
Used to select the color mode used for 3D Waterfall displays. Two modes are available:
- Single color: no color interpolation is used for the points. This color is used for filling the plane in Line mode.
- Waterfall color: if checked, the selected palette is used for the color rendering and for the color spectrogram mode. The edit button displays the palette manager dialog box.
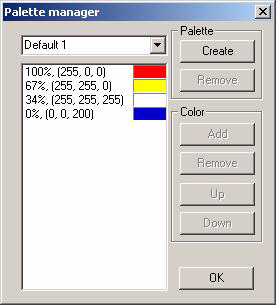
Palette manager
This dialog box is used to create and edit color palette.
Palette
Create: Creates a new palette.
Remove: Removes the selected palette.
Color
Add: Adds a key color to the palette.
Remove: Removes the selected key color from the palette.
Up: The selected key color move up from one step, if possible.
Down: The selected key color move down from one step, if possible.
Each color of the palette can be edited by clicking on a colored area. The percentage can also be edited by double-clicking on the text zone of each color.
- Z autoscale
Used to select an autoscale type. Two kinds are available:
- Disable: no autoscale is activated.
- Continuous: when a spectrum is not within the Z scale values, an autoscale is performed with no margin. This mode is not recommended for computers with limited processing power.
- Y autoscale
Used to select an autoscale type. Two kinds are available:
- Disable: no autoscale is activated.
- Continuous: when a spectrum is not within the Y scale values, an autoscale is performed with no margin. This mode is not recommended for computers with limited processing power.
- Cursor slice visibility
Used to choose the default slice visibility. Four choices are available:
- All: the default slices are displayed in all areas.
- Only in 3D: the default slices are Display only in the 3D area.
- Only in 2D: the default slices are Display only in the 2D area.
- No display: the default slices are not displayed in any area.
- Default reference
Used to select your default reference for your waterfall.
Note: If the measurement is loaded, then the waterfall is displayed as the measurement has been done.
If the Waterfall is displayed, then the reference is the one defined in the user preferences.
- View
Used to select a view mode in the Waterfall window: two modes are available:
- 3D View: only the 3D view is displayed in the window.
- All views: 3D view and slices areas are displayed in the window.
- Orientation
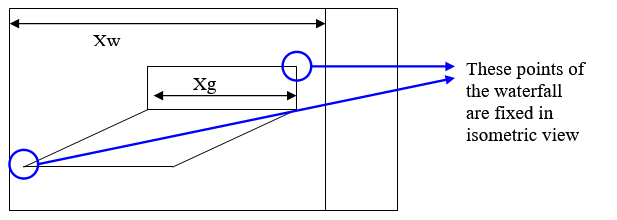
- X ratio: this setting displays the ratio between the window and the waterfall X-axis size.
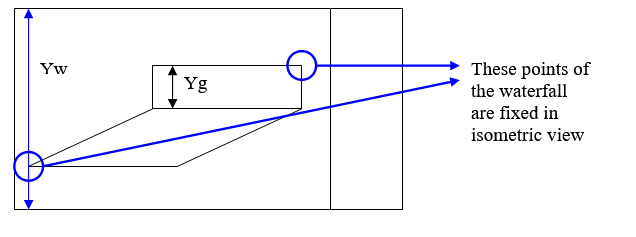
- Y ratio: this setting displays the ratio between the window and the waterfall Y-axis size.
- Magnification: this setting displays the position of the waterfall in the window in term of depth. The waterfall will be far in the window if the cam factor is large.
- View type:
- 3D isometric
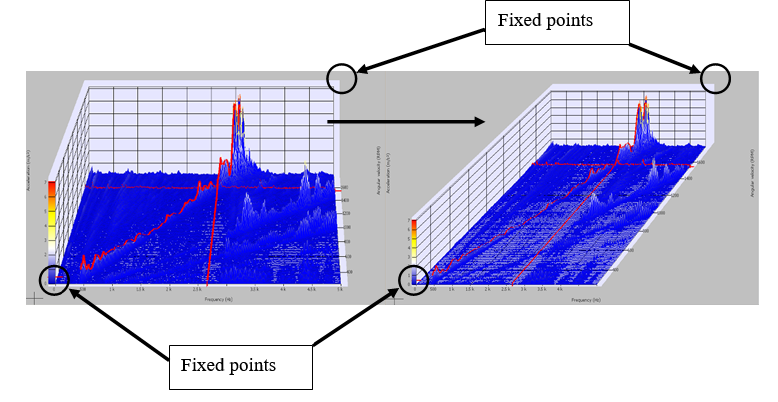
If isometric view is checked: you can change the position and dimension of the waterfall around two fixed points (see above).
- 3D perspective:
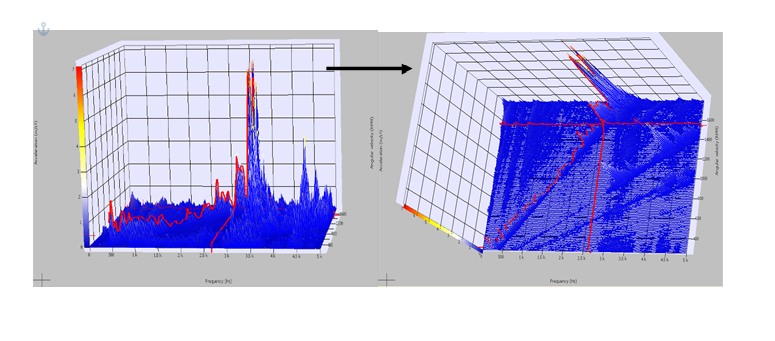
If Perspective is not checked: there is no fixed point, the waterfall can be moved in the 3D space. This view is an orthonormal view.
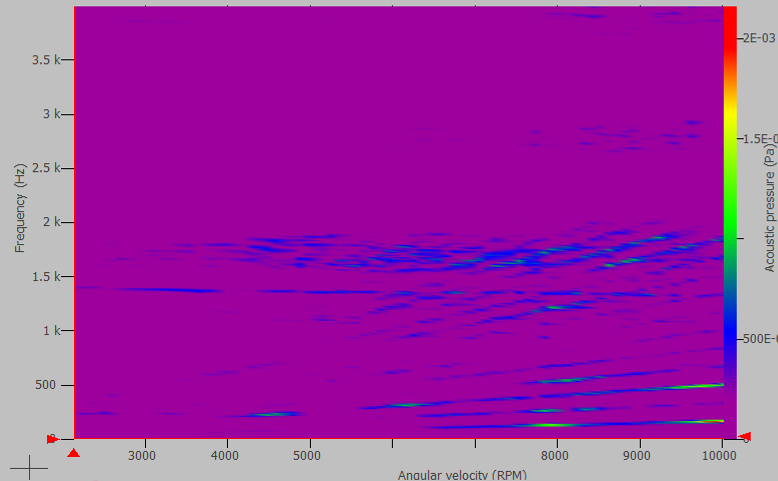
- Freq/Time Colormap:
- Time/Freq Colormap:
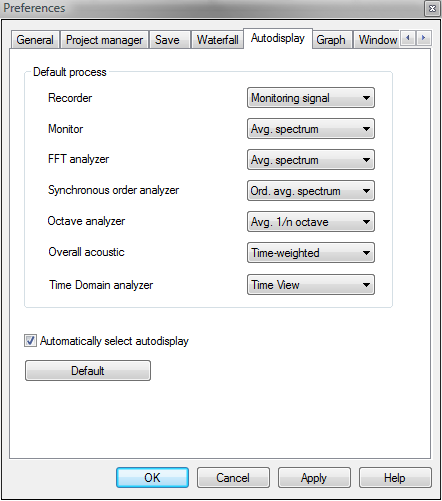
Autodisplay
This preference page is used to set up the type of result to be automatically displayed after input connections. It is possible to select the "Autodisplay" type of result for each available plug-in analyzer.
The plug-in analyzers available results are the same as in the "Add/Remove window" dialog.
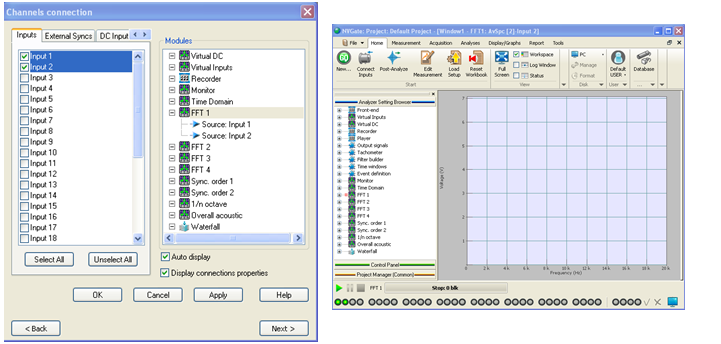
Example of a FFT Averaged spectrum result autodisplay:
---- |
| Input connection | The type of result selected in the autodisplay preferences is automatically displayed |
Graph
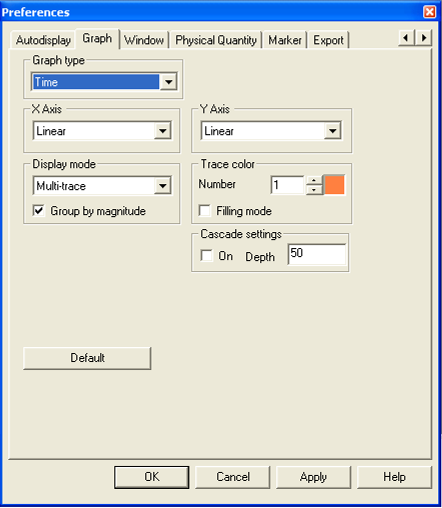
This window allows selecting the graph desired and changing the preferences corresponding to it.
Graph type: Used to select the kind of graph desired.
Time
- Graph type: Used to select the kind of graph desired in order to change the preferences.
If Magnitude gathering is active, when the window is in a simple multi trace mode (module, phase, real, imaginary... but not in multi trace module/phase, real/imaginary....), one area is created for each different Y magnitude in the window.
- X-axis: Select the X scale type. Two kinds of X scale are available (depending on the kind of window).
- Linear
- Logarithmic
- Y-axis: Select the Y scale type. Three kinds of Y scale are available (depending on the kind of window).
- Linear
- Logarithmic
- dB
- Display mode: Select the display mode to use for this kind of graph. Several display modes are available for each kind of graph.
- Trace color: Select the color for each trace of the graph. Only 32 traces can be displayed in the same graph.
If Filling mode is active, each trace of the window is filled with a color and has a black border. This option is especially useful for multi-graph modes. - Cascade settings: If mode Cascade is 'On' you can select the depth (the Z-axis) of the 3D Cascade view.
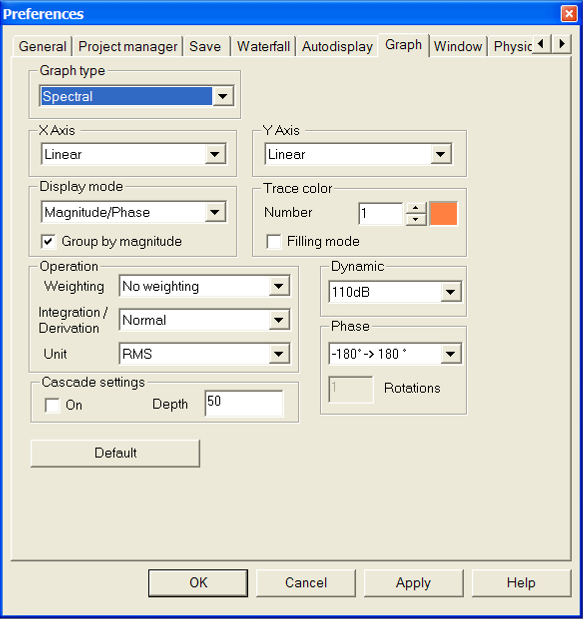
Spectral
- X-axis: Select the X scale type. Two kinds of X scale are available (depending on the kind of window).
- Linear
- Logarithmic
- Y-axis: Select the Y scale type. Three kinds of Y scale are available (depending on the kind of window).
- Linear
- Logarithmic
- dB
- Display mode
- Magnitude: overlays all magnitude traces on a single graph.
- Phase: overlays all phase traces on a single graph.
- Real part: overlays all real parts traces on a single graph.
- Imaginary part: overlays all imaginary part traces on a single graph.
- Magnitude/phase: overlays all magnitude traces on the upper graph and all the phase traces on the lower graph.
- Real/imaginary: overlays all magnitude traces on the upper graph and all the phase traces on the lower graph.
- Polar: overlays all complex traces on a polar graph: = magnitude, = phase.
- Real part 3D: displays all real part traces as a 3D graph arranged along the Z-axis.
- Imaginary part 3D: displays all imaginary part traces as a 3D graph arranged along the Z-axis.
- Magnitude 3D: displays all magnitude traces as a 3D graph arranged along the Z-axis.
- Phase 3D: displays all phase traces as a 3D graph arranged along the Z-axis.
- Real part multi-graph: displays all real part traces using one graph per trace in the same window.
- Imaginary part multi-graph: displays all imaginary part traces using one graph per trace in the same window.
- Magnitude multi-graph: displays all magnitude traces using one graph per trace in the same window.
- Phase multi-graph: displays all phase traces using one graph per trace in the same window.
- Phase/Magnitude: overlays all phase traces on the upper graph using 1/3 of window space and all the magnitude traces on the lower graph using 2/3 of the window.
- Merged Magnitude/Phase: displays all magnitude and phase part traces as a unique graph.
- Magnitude gathering: if this mode is activated and when a multi-trace mode is selected, an area is created for each different Y magnitude: all the signals with the same Y magnitude are in the same area. If there is only one different Y magnitude, all the signals are in the same area.
- Trace color
- Number: selects the trace number for color modification.
- Color box: click on this box to modify the color of the selected trace.
- Filling mode: if selected, all the curves of the windows are filled from:
- the bottom of the area if Y scale is a dB one or Logarithmic one
- the 0 value of the Y scale is linear.
- Dynamics
- 90 dB: resizes the Y-axis to 90 dB dynamics starting from +20 dBV.
- 110 dB: resizes the Y-axis to 110 dB dynamics starting from +20 dBV.
- 130 dB: resizes the Y-axis to 130 dB dynamics starting from +20 dBV.
- 150 dB: resizes the Y-axis to 150 dB dynamics starting from +20 dBV.
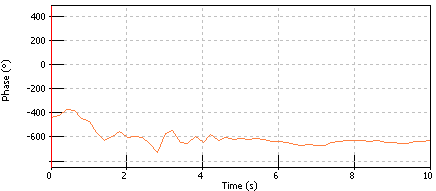
- Phase
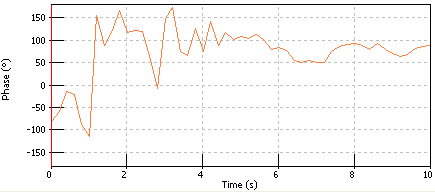
- -180° -> 180°: sets the phase graph Y-axis between –180° to +180°.
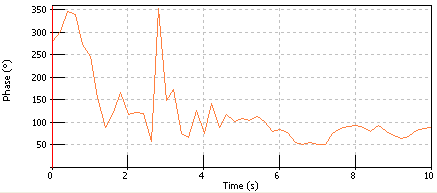
- 0 -> 360°: sets the phase graph Y-axis between 0 to +360°.
Rotations: sets the number of rotations to be displayed on the Y-axis.
Example for 5 rotations
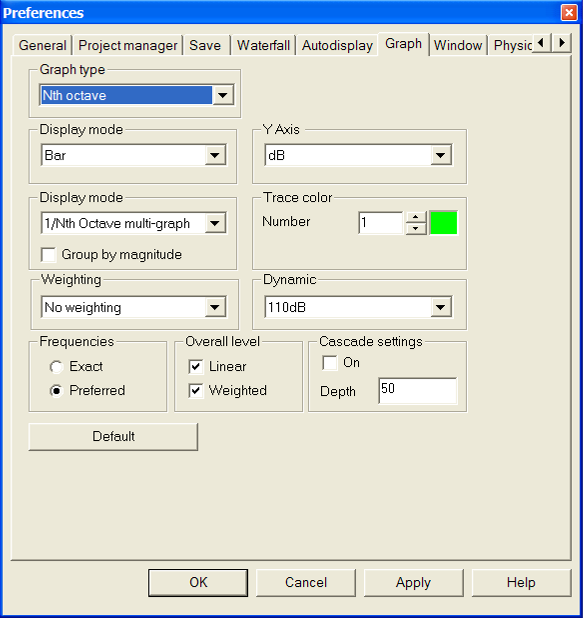
Nth octave
- Y Axis
- Linear: uses linear scale for Y-axis units.
- Logarithmic: uses logarithmic scale for Y-axis units.
- dB: uses reference dB scale for Y axis units.
- Display mode
- Bar: bar representation
- Step: step representation.
- Rectangle: overlaid rectangle
- Filled: overlaid filled rectangles.
- Display mode
- Multi-trace: overlays all traces on a single graph.
- Multi-graph: one graph for each trace.
- Magnitude gathering: if this mode is activated and when a multi-trace mode is selected, an area is created for each different Y magnitude: all the signals with the same Y magnitude are in the same area. If there is only one different Y magnitude, all the signals are in the same area.
- Trace color
- Number: selects the trace number for color modification.
- Color box: click on this box to modify the color of the selected trace.
- Weighting
Used to select the type of weighting desired.
- Overall level
- Linear: if checked, the linear global level is displayed.
- Weighted: if checked and available, the weighted level is displayed.
- Frequencies
- Exact: displays exact band center frequency.
- Preferred: displays preferred frequencies, i.e rounded values for the central frequencies. Preferred frequencies are only available for octave and 1/3rd octave windows: in the octave. If this mode is selected in 12th and 24th octave windows, exact frequencies are displayed.
- Dynamics
- 90 dB: resizes the Y-axis to 90 dB dynamics starting from +20 dBV.
- 110 dB: resizes the Y-axis to 110 dB dynamics starting from +20 dBV.
- 130 dB: resizes the Y-axis to 130 dB dynamics starting from +20 dBV.
- 150 dB: resizes the Y-axis to 150 dB dynamics starting from +20 dBV.
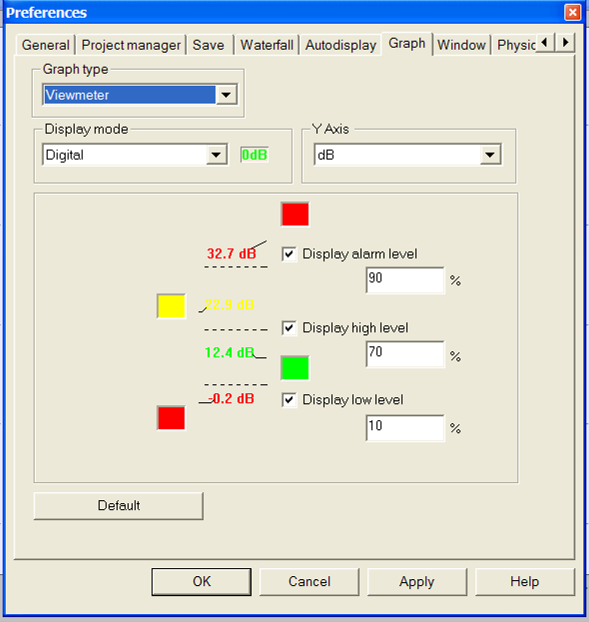
Viewmeter
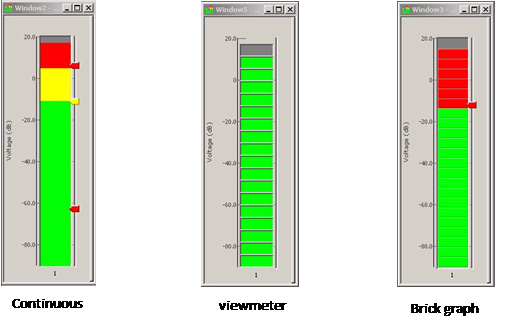
- Display mode: There are two types of display:
- Bar graph
- Digital display
- Y Axis
- Linear: uses linear scale for Y-axis units.
- Logarithmic: uses logarithmic scale for Y-axis units.
- dB: uses reference dB scale for Y-axis units.
- Display max, Display min: Displays the min and the max scalar value as a cursor. The color of the cursor can be freely selected. This property only applies to bar graphs.
- Display low level: Changes the color of the display when the value is below this level. The color can be freely selected.
- Display high level: Changes the color of the display when the value is higher than this level. The color can be freely selected.
- Display alarm level: Changes the color of the display when the value is higher than this level. The color can be freely selected.
- Brick height: Defines the height of the bricks for the viewmeter and brick display modes.
- Save as user preference: When this box is checked, the value is given as a percentage of the full scale, and may be applied to any graph.
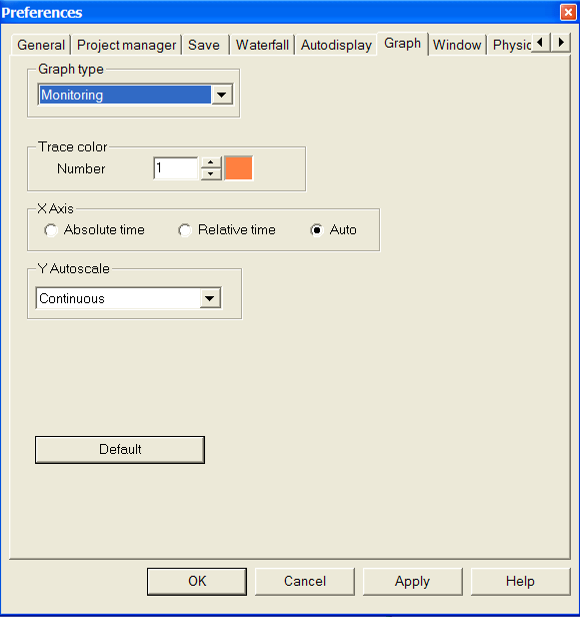
Monitoring
- Trace color
- Number: selects the trace number for color modification.
- Color box: click on this box to modify the color of the selected trace.
- X Axis
- Absolute time: displays the time from windows format.
- Relative time: displays the duration of the record. The beginning of the record is set to 0.
- Auto: selects absolute or relative time depending on the duration of the record. For records smaller than 2s, the relative time is displayed, for others, the absolute time is chosen.
- Y Autoscale
- Continuous: the Y scale is automatically adjusted to the current min and max y values of the window traces with a margin to facilitate visibility.
- Disabled: Y autoscale is not activated.
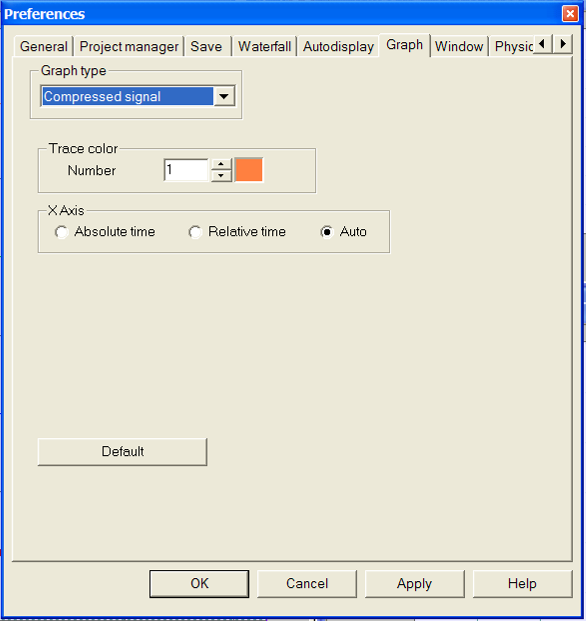
Compressed signal
- Trace color
- Number: selects the trace number for color modification.
- Color box: click on this box to modify the color of the selected trace.
- X Axis
- Absolute time: displays the time from windows format.
- Relative time: displays the duration of the record. The beginning of the record is set to 0.
- Auto: selects absolute or relative time depending on the duration of the record. For records smaller than 2s, the relative time is displayed, for others, the absolute time is chosen.
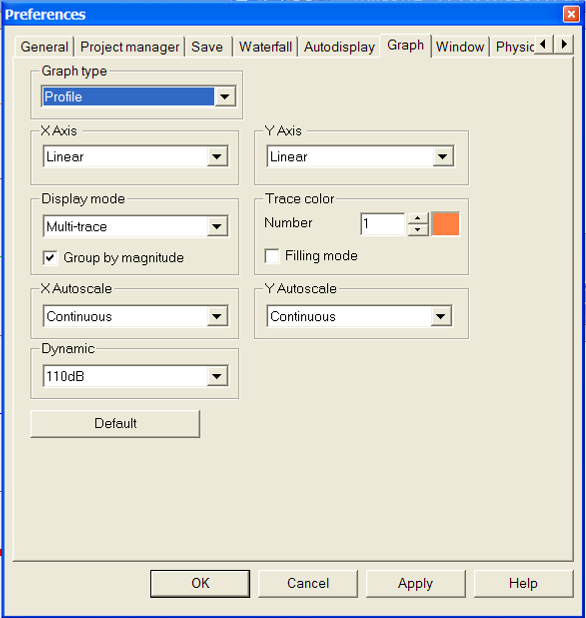
Profile
- X Axis
- Linear: uses linear scale for X-axis units.
- Y Axis
- Linear: uses linear scale for Y-axis units.
- Display mode
- Magnitude: overlays all magnitude traces on a single graph.
- Phase: overlays all phase traces on a single graph.
- Magnitude gathering: if this mode is activated and when a multi-trace mode is selected, an area is created for each different Y magnitude: all the signals with the same Y magnitude are in the same area. If there is only one different Y magnitude, all the signals are in the same area.
- Trace color
- Number: selects the trace number for color modification.
- Color box: click on this box to modify the color of the selected trace.
- Filling mode: if selected, all the curves of the windows are filled from:
- the bottom of the area if Y scale is dB or Logarithmic.
- the 0 value if the Y scale is linear.
- X Autoscale
- Continuous: the X scale is automatically adjusted to the current min and max x values of the window traces.
- Disabled: X autoscale is not activated.
- Y Autoscale
- Continuous: the Y scale is automatically adjusted to the current min and max y values of the window traces with a margin to facilitate visibility.
- Disabled: Y autoscale is not activated.
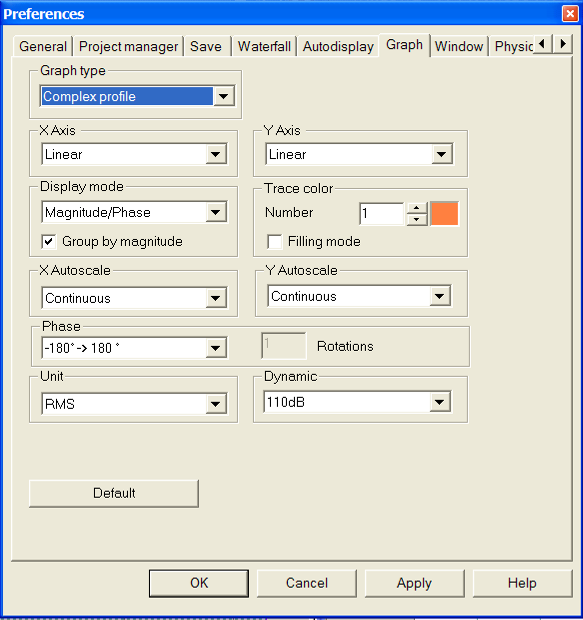
Complex profile
- X Axis
- Linear: uses linear scale for X-axis units.
- Y Axis
- Linear: uses linear scale for Y-axis units.
- Logarithmic: uses logarithmic scale for Y-axis units.
- dB: uses reference dB scale for Y axis units.
- Display mode
- Magnitude: overlays all magnitude traces on a single graph.
- Phase: overlays all phase traces on a single graph.
- Real part: overlays all real part traces on a single graph.
- Imaginary part: overlays all imaginary part traces on a single graph.
- Magnitude/phase: overlays all magnitude traces on the upper graph and all phase traces on the lower graph.
- Real/imaginary: overlays all magnitude traces on the upper graph and all phase traces on the lower graph.
- Polar: displays in polar coordinates, the phase and the amplitude on a single graph.
- Real part multi-graph: displays all real part traces using one graph per trace in the same window.
- Imaginary part multi-graph: displays all imaginary part traces using one graph per trace in the same window.
- Magnitude multi-graph: displays all magnitude traces using one graph per trace in the same window.
- Phase multi-graph: displays all phase traces using one graph per trace in the same window.
- Phase/Magnitude: overlays all phase traces on the upper graph using 1/3 of window space and all the magnitude traces on the lower graph using 2/3 of the window.
- Merged Magnitude/Phase: displays all magnitude and phase parts traces on a single graph.
- Magnitude gathering: if this mode is activated and when a multi-trace mode is selected, an area is created for each different Y magnitude: all the signals with the same Y magnitude are in the same area. If there is only one different Y magnitude, all the signals are in the same area.
- Trace color
- Number: selects the trace number for color modification.
- Color box: click on this box to modify the color of the selected trace.
- Filling mode: if selected, all the curves of the windows are filled from:
- The bottom of the area if Y scale is dB or Logarithmic.
- The 0 value if the Y scale is linear.
- Dynamics
- 90 dB: resizes the Y-axis to 90 dB dynamics starting from +20 dBV.
- 110 dB: resizes the Y-axis to 110 dB dynamics starting from +20 dBV.
- 130 dB: resizes the Y-axis to 130 dB dynamics starting from +20 dBV.
- 150 dB: resizes the Y-axis to 150 dB dynamics starting from +20 dBV.
- Phase
- -180° -> 180°: sets the phase graph Y-axis between –180° to +180°.
- 0 -> 360°: sets the phase graph Y-axis between 0 to +360°.
Rotations: sets the number of rotations to be displayed on the Y-axis.
Example for 5 rotations
- X Autoscale
- Continuous: the X scale is automatically adjusted to the current min and max x values of the window traces.
- Disabled: X autoscale is not activated.
- Y Autoscale
- Continuous: the Y scale is automatically adjusted to the current min and max y values of the window traces with a margin to facilitate visibility.
- Disabled: Y autoscale is not activated.
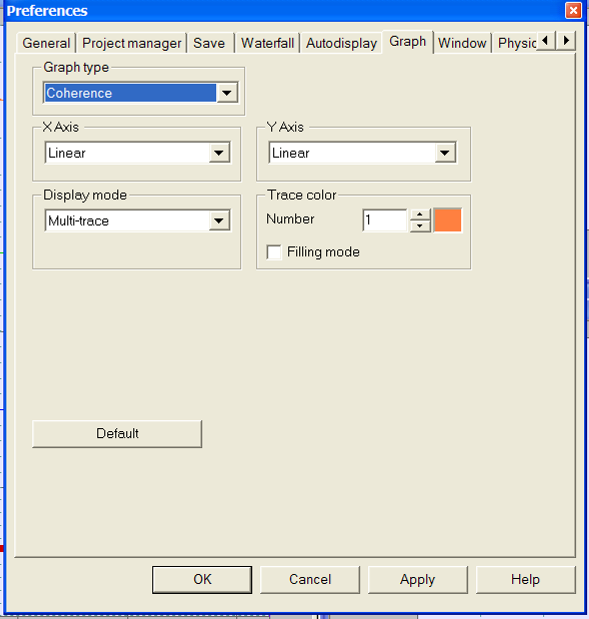
Coherence
- X Axis
- Linear: uses linear scale for X-axis units.
- Y Axis
- Linear: uses linear scale for Y-axis units.
- Display mode
- Multi-graph: overlays all traces on a single graph.
- Multi-trace: displays all traces using one graph per trace in the same window.
- Time multi-trace 3D: overlays all traces on a single 3D graph.
- Magnitude gathering: if this mode is activated and when a multi-trace mode is selected, an area is created for each different Y magnitude: all the signals with the same Y magnitude are in the same area. If there is only one different Y magnitude, all the signals are in the same area.
- Trace color
- Number: selects the trace number for color modification.
- Color box: click on this box to modify the color of the selected trace.
- Filling mode: if selected, all the curves of the windows are filled from:
- the bottom of the area if Y scale is dB or Logarithmic.
- the 0 value if the Y scale is linear.
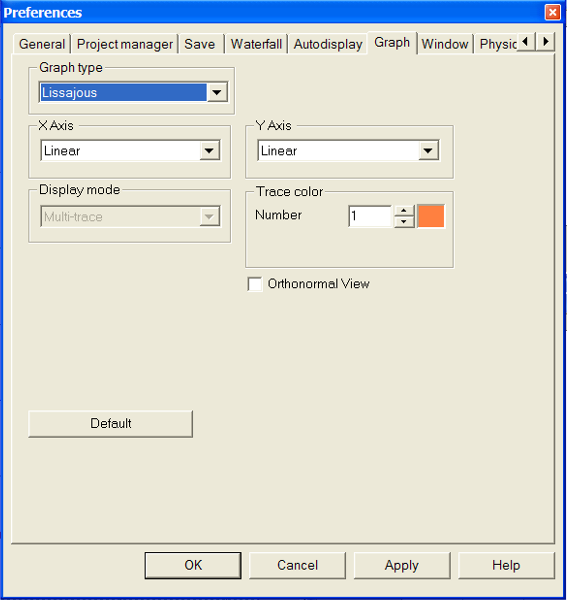
Lissajous
- X Axis
- Linear: uses linear scale for X-axis units.
- Y Axis
- Linear: uses linear scale for Y-axis units.
- Trace color
- Number: selects the trace number for color modification.
- Color box: click on this box to modify the color of the selected trace.
Window
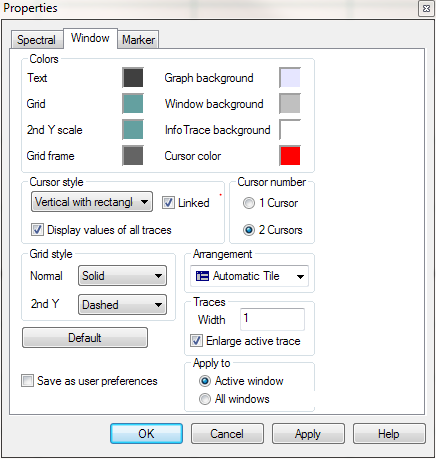
- Colors: Selects the different colors used in graphical displays.
Text: scale text color in the graph area
Grid: grid color used in graph area
Grid frame: color used for the graph area frame
Cursor: color for the cursors in the graph areas
Graph background: color used in the graph area background
Window background: color used for the background of graphical display windows
Infotrace background: color used for the infotrace background.
- Cursor style
Style: Selects the cursor style in graphical displays. The available styles are:
- Vertical line
- Vertical dashed line
- Vertical with rectangle
- Cross-hair
- Vertical + Horizontal
Linked: Enables links between the cursors of several windows: when one cursor moves, the other also moves. See cursor menu section for details.
Display values of all traces: if checked, all Y values for each trace will be displayed, not only for the active trace.
- Cursor number: Enables one or two cursors in the graphical display. Each cursor can be moved independently. The information of each cursor will be displayed (if activated) in the infotrace area. With 2 cursors enabled, the x and y difference will be displayed.
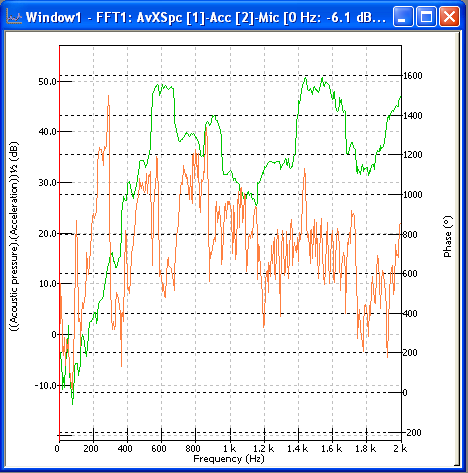
- Grid style: Selects the grid style in the graphical area for the scale and the second Y scale if available. The double grid is available when "Merged Module/Phase" display mode is selected from the window properties.
Grid styles available are:
- No grid
- Solid
- Dashed
- Arrangement: Selects the arrangement style used when a new window is created. Arrangements available are:
- No arrangement
- Tile horizontally
- Tile vertically
- Cascade
- Automatic tile
- Highlight active trace
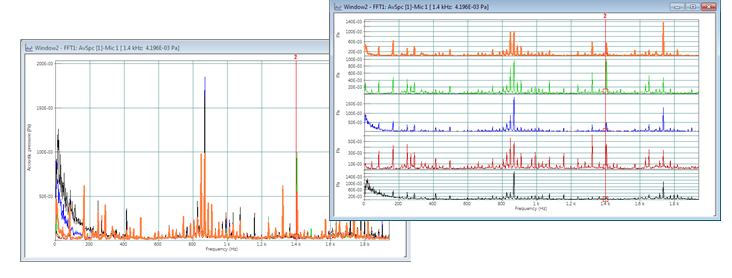
Multi-trace or multi-graph windows are useful with several inputs and multi-analysis operation. This type of graphs features now a way to highlight the active trace. A preference allows activating larger drawing for the active trace (+1 pixel on both sides).
It applies on 2D graphs except the compressed signals view (TDA TimeView, Recorder monitoring, Player signal, zoomed signal and signal preview). Both multi-graphs and multi-trace support this option.
This feature is activated in the default users' preferences. You can de-activate this option from the Home\Preferences\General dialog or the contextual windows properties menu: select the Windows tab and unselect the "Enlarge active trace" option.
Print colors
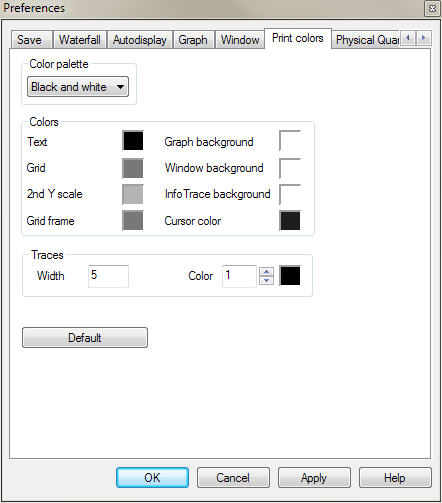
This preferences allows setting the way the report or copy/paste out of NVGate are plotted.
2 palettes are available one for B&W printer the other one for colored export.
Note the trace width depends on the printer resolution (dpi). A width of 1 in the screen correspond approximately to a width of 50 on a laser printer
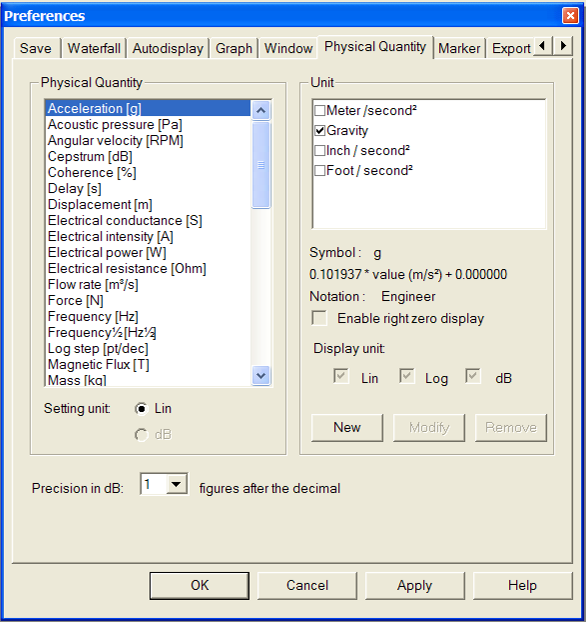
Physical quantity
| This preference page is dedicated to the choice of the units and the | associated options. |
- Physical quantity: Here all quantities that can be managed by NVGate are displayed. This list cannot be modified.
- Unit: Displays the list of available units for the selected quantity. The main information about the unit is displayed just below the list.
- New: Use this button to create a new unit for the selected quantity.
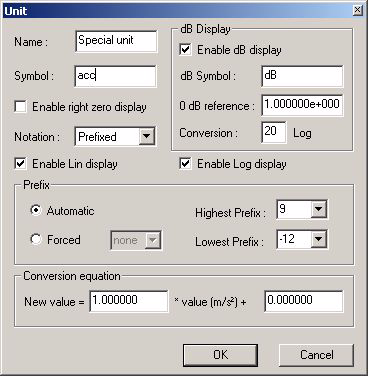
The following dialog box is used to define the units.
Name: Name that will be displayed when the unit is used
Symbol: Symbol that will be used when a value is displayed in this unit
Enable right zero display: If selected, the value will be filled by zero after the decimal
Notation
Fixed: When possible, the value is displayed without any exponent and without a prefix.
Prefixed: Prefix (u, m, k, M) used as exponent preference.
Engineer: Values are displayed with exponents in multiples of 3 ( -9,-6,0,3,6,9,12...)
Scientific: Values are displayed with exponents so that only one figure is used before the decimal
Time: Should only be used to display date and time
The following table shows the effect of the notation on the display of three values: 20000 m/s², 70700 m/s², 0.0002091 m/s²
| Fixed | Prefixed | Scientific | Engineer | |
| Right zero display enabled | 20000 70700 2.091 E-4 |
20.00 k 70.7 k 209.1 u |
2.000 E4 7.07 E4 2.091 E-4 |
20.00 E3 70.7 E3 209.1 E-6 |
| Right zero display disabled | 20000 70700 2.091 E-4 |
20 k 70.7 k 209.1 u |
2 E4 7.07 E4 2.091 E-4 |
20 E3 70.7 E3 209.1 E-6 |
Enable Lin display: Authorizes or not the use of a linear scale when displaying a result with this unit in a graph
Enable Log display: Authorizes or not the use of a logarithmic scale when displaying a result with this unit in a graph
- dB Display
- Enable dB display: Authorizes or not the use of dB scale when displaying a result with this unit in a graph
- dB symbol: This symbol will be added to the value when expressed in dB.
- 0 dB reference: Value used has the dB scale reference.
Example 2 E-5 Pa for Acoustic pressure in Pa
- Conversion: Used to convert linear values to dB values.
Example:
20 for Acoustic pressure in Pa because dB Value = 20*log (Lin_Value/2e-5), but 10 for the unit representing power.
- Prefix: If Automatic is selected, the lowest and highest prefix can be selected from the two lists on the right
If forced is selected, the value is always displayed with the selected prefix
- Conversion equation: Displays the coefficient to use for converting an SI value to a given units.
Example:
Value in_ = 0.101936 * Value in SI + 0 where Value in SI is m/s²
Value in Celsius = 1* Value in Kelvin - 273.15
- Hide view meter decimal digit(s) : This settings is only available for angular velocity. If the settings is selected the visualization of the view meter angular velocity will not have decimal digit.
Modify
Use this button to modify the selected unit. Only units created by the user can be modified. Refer to "New unit" for description of the parameters.
Remove
Use this button to remove the selected unit. Only units created by the user can be removed.
Precision in dB
General option (applied to every unit) to define the number of figures displayed after the decimal when using dB display.
Spare units and physical quantities
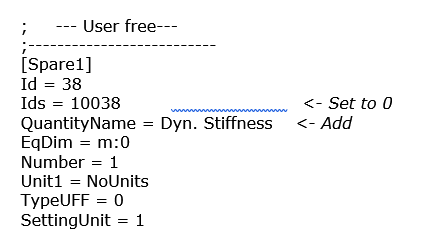
NVGate Features 4 "Spare units" to be used when requested physical quantity does not exist in the software. Actually these spare units are physical quantities. It is possible to rename it an choose the associated units
The procedure is as follow
1. Open the file orosunit.ini from the installation directory
2. In the MAGNITUDE DEFINITION section goes to the Spare ones
3. Set corresponding Ids to 0
4. Add a line QuantityName = new name
5. Start NVGate and create associated units
Example to create Dynamic Stifness magnitude:
For using special characters (ex Asian languages) the orosunit.in file must be encoded as UTF-8.
Note that the orosunit.ini file is overwritten at each new install of NVGate.
Marker
Free Marker page
Style
Selects marker drawing style used in graphical area. The available marker drawing styles are:
- Vertical line
- Vertical dashed line
- Vertical with rectangle
- Cross-hair
- Vertical + Horizontal
- Marker color: Selects the marker color used in the graphical area.
- Number color: Selects the marker number color used in the graphical area.
- Associated to active trace: If checked, the marker added will be associated with the active trace: the markers display the values only for the active signal. If not checked, the markers display all the values when not associated with a signal.
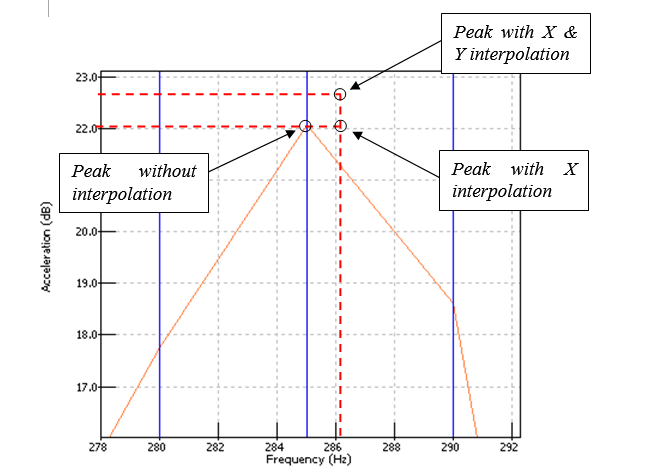
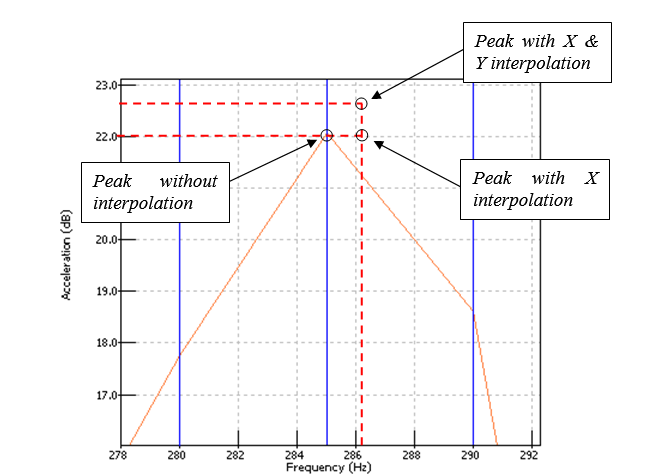
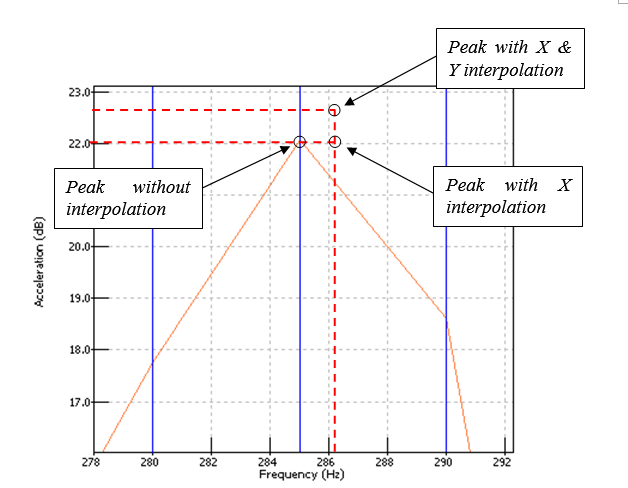
- Interpolation: This setting selects the interpolation of values displayed in the marker table.
- None: no interpolation applied.
- X: x interpolation is active.
- X & Y: x and y interpolations are active.
Note: the interpolated values of free markers will be available only if the free marker is placed on a peak. The peak detection criteria are the same as the peak marker adjusted in the User preferences. The marker can be moved by 1/32 step. The x value is computed with the selected weighted window.
Label setup
- Text color: Selects label color.
- Background color: Selects label background color.
- Display current position: displays automatically the coordinates of the selected point.
Line setup
- Display line: If checked, a line between marker and label is displayed
- Line color: Selects line color
- Line style: Selects line style. Available styles are:
- Full line
- Dashed line
For more details on the marker use, see the "Markers" topic from the "Chapter 2: Display".
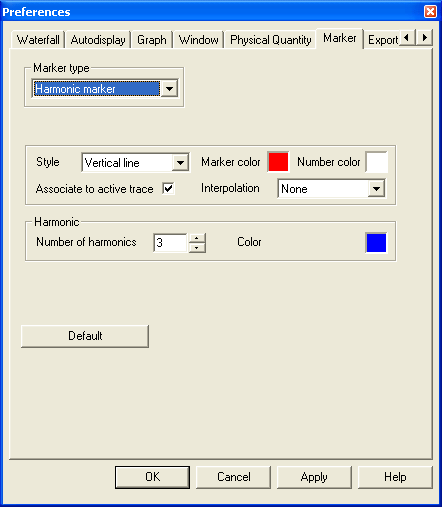
Harmonic marker page
Style
Selects marker drawing style used in graphical area. The available marker drawing styles are:
- Vertical line
- Vertical dashed line
- Vertical with rectangle
- Cross-hair
- Vertical + Horizontal
- Marker color: Selects the marker color used in the graphical area.
- Number color: Selects the marker number color used in the graphical area.
- Associated to active trace: If checked, the marker added will be associated with the active trace: the markers display the values only for the active signal. If not checked, the markers display all the values when not associated with a signal.
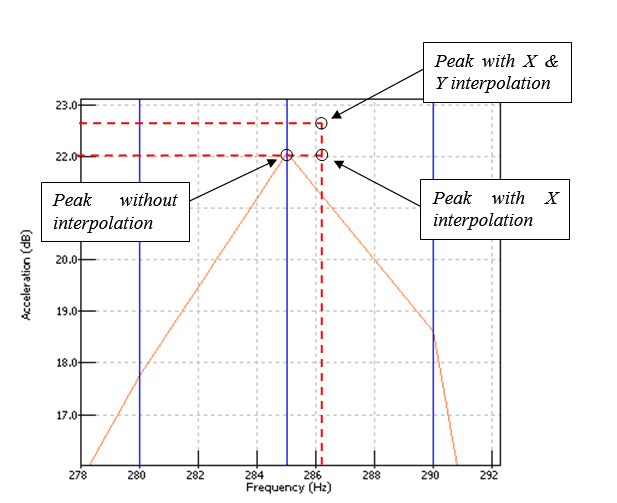
- Interpolation: This setting selects the interpolation of values displayed in the marker table.
- None: no interpolation applied.
- X: x interpolation is active.
- X & Y: x and y interpolations are active.
Note: the interpolated values of harmonic markers will be available only if the harmonic marker is placed on a peak. The peak detection criteria are the same as the peak marker adjusted in the User preferences. The marker can be moved by 1/32 step. The x value is computed with the selected weighted window.
Harmonic
- Number of harmonics: Selects the number of harmonics to find.
- Color: Selects harmonics color.
For more details on the marker use, see the "Markers" topic from the "Chapter 2: Display".
Peak marker page
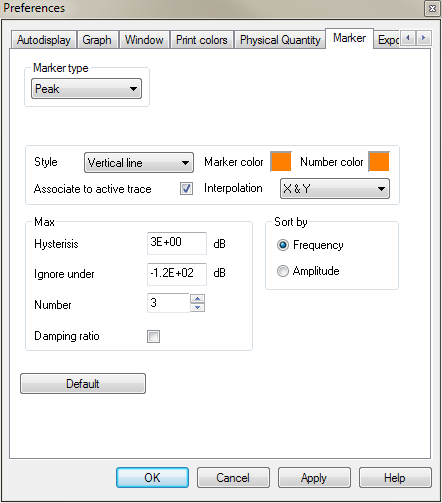
Style
Selects marker drawing style used in graphical area. The available marker drawing styles are:
- Vertical line
- Vertical dashed line
- Vertical with rectangle
- Cross-hair
- Vertical + Horizontal
- Marker color: Selects the marker color used in the graphical area.
- Number color: Selects the marker number color used in the graphical area.
- Associated to active trace: If checked, the marker added will be associated with the active trace: the markers display the values only for the active signal. If not checked, the markers display all the values when not associated with a signal.
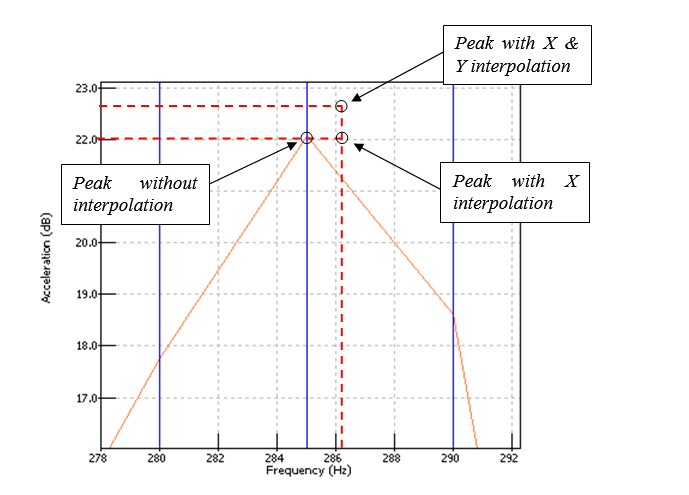
- Interpolation: This setting selects the interpolation of values displayed in the marker table.
- None: no interpolation applied.
- X: x interpolation is active.
- X & Y: x and y interpolations are active.
Max
- Number of peaks: Selects the number of peaks to find.
- Threshold: Defines the threshold used for the detection of peaks.
- Ignore under: Defines the absolute threshold used for the detection of peaks.
Sort by
In the Infotrace the 'Peak Marker Table' can be sort by:
- Frequency: in the marker table, results are displayed from the lowest to the highest frequency.
- Amplitude: in the marker table, results are displayed from the highest to the lowest amplitude.
Find peak algorithm
Finding peaks is only available for the Spectrum and Cross Spectrum traces. It looks for the peaks of the selected trace. It can be applied to the current frozen window or to all frozen windows in the workspace.
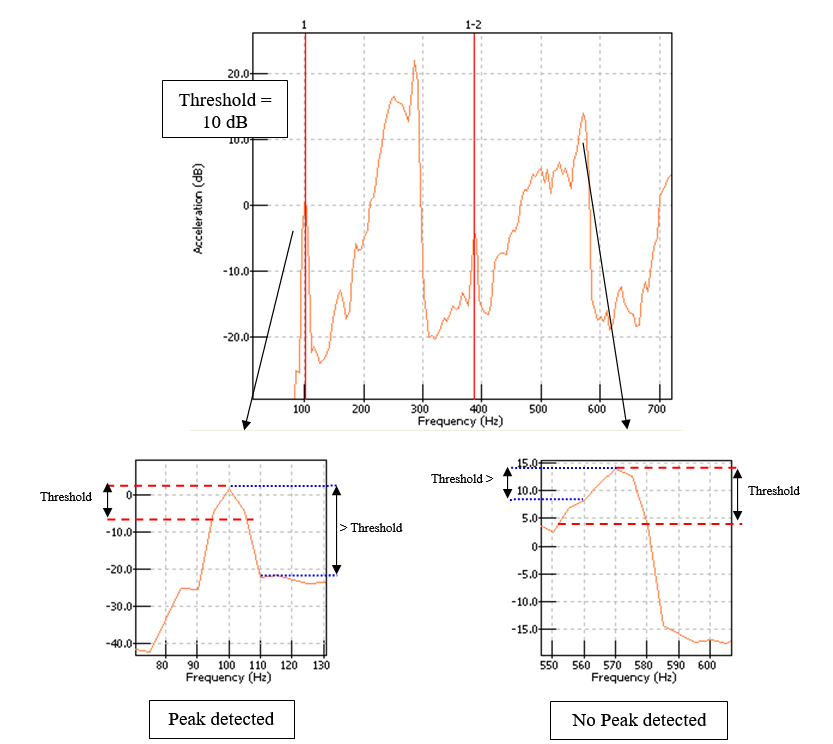
A spectrum line is detected as a peak if the two following conditions are met:
- The two adjacent spectrum line levels are lower than the central spectrum line level.
- The two following spectrum line levels are lower than the central spectrum level minus the peak threshold.
The next two pictures show how peaks are detected. The difference between the two figures is that the second peak threshold is greater than the first one and the peak is not detected.
- Threshold: In the example below, the "Threshold" is 10 dB.
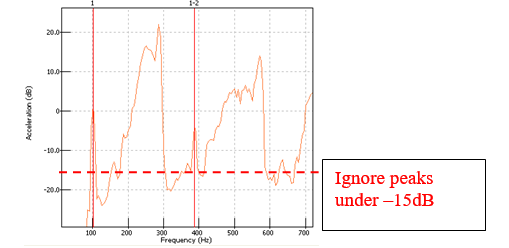
- Ignore under: Does not display the detected peak if the peak is under this value. In the example below, the "ignore under" value is –15 dB.
Damping ratio
damping ratio is calculated for each detected peak. The calculation is based on the Half-power-band-width method, where DR is the damping ratio:
The calculation of the damping factor is activated through the marker properties or preferences.
When it is activated an additional column is added in the corresponding marker table.
Warning, using nonhomogeneous weighting windows (i.e.: equivalent noise bandwidths are not the same) on FRF channels leads to incorrect peak interpolation and damping results.
For more details on the marker use, see the "Markers" topic from the "Chapter 2: Display".
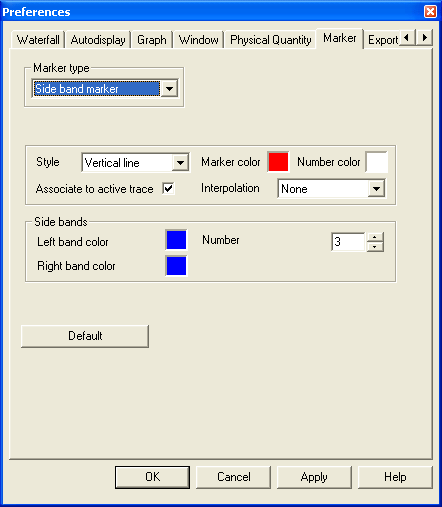
Side band marker page
Style
Selects marker drawing style used in graphical area. The available marker drawing styles are:
- Vertical line
- Vertical dashed line
- Vertical with rectangle
- Cross-hair
- Vertical + Horizontal
Marker color
- Number color: Selects the marker color used in the graphical area.
- Associated to active trace: If checked, the marker added will be associated with the active trace: the markers display the values only for the active signal. If not checked, the markers display all the values when not associated with a signal.
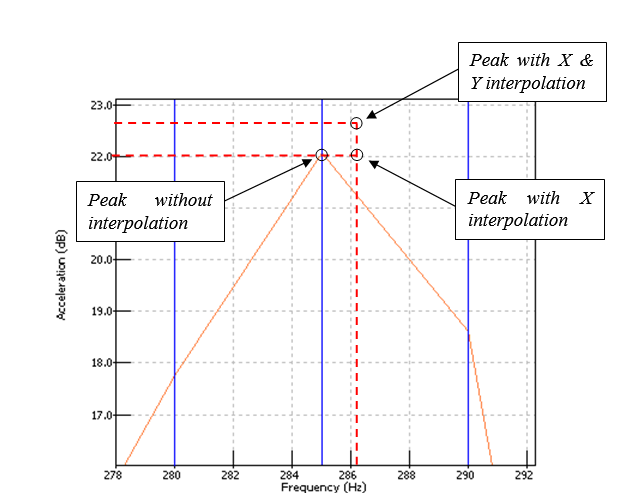
- Interpolation: This setting selects the interpolation of values displayed in the marker table.
- None: no interpolation applied.
- X: x interpolation is active.
- X & Y: x and y interpolations are active.
Side bands
- Left band color: Selects left band color
- Right band color: Selects right band color
- Number: Selects number of side bands to compute.
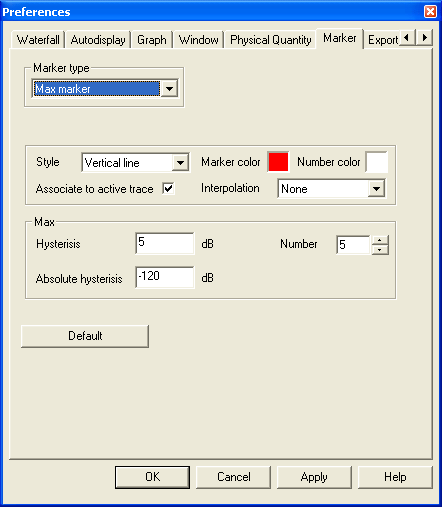
Max marker page
Style
Selects marker drawing style used in graphical area. The available marker drawing styles are:
- Vertical line
- Vertical dashed line
- Vertical with rectangle
- Cross-hair
- Vertical + Horizontal
- Marker color: Selects the marker color used in the graphical area.
- Number color: Selects the marker number color used in the graphical area.
- Associated to active trace: If checked, the marker added will be associated with the active trace: the markers display the values only for the active signal. If not checked, the markers display all the values when not associated with a signal.
- Interpolation: This setting selects the interpolation of values displayed in the marker table.
- None: no interpolation applied.
- X: x interpolation is active.
- X & Y: x and y interpolations are active.
Damping ratio
damping ratio is calculated for each detected peak. The calculation is based on the Half-power-band-width method, where DR is the damping ratio:
The calculation of the damping factor is activated through the marker properties or preferences.
File:Project Manager User Pref2 09.png
When it is activated an additional column is added in the corresponding marker table.
Warning, using nonhomogeneous weighting windows (i.e.: equivalent noise bandwidths are not the same) on FRF channels leads to incorrect peak interpolation and damping results.
For more details on the marker use, see the "Markers" topic from the "Chapter 2: Display".
Find max algorithm
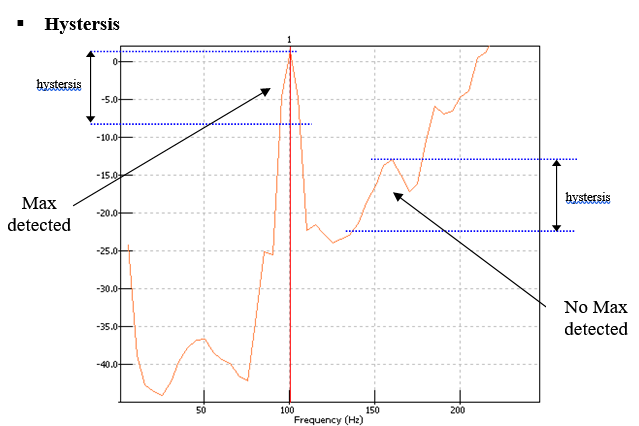
Looks for the maximum of the selected trace. It can apply to the current frozen window or to all frozen windows in the workspace A maximum is defined as a local maximum such that the variation in size of spectral density of ray, in relation to other local maximum surrounding it, is greater than a set threshold.
The following diagram shows how the maxima are searched for different maximum threshold values. In the first figure, the maximum threshold allows to find 2 maximum while in the second figure a larger maximum threshold found only one maximum.
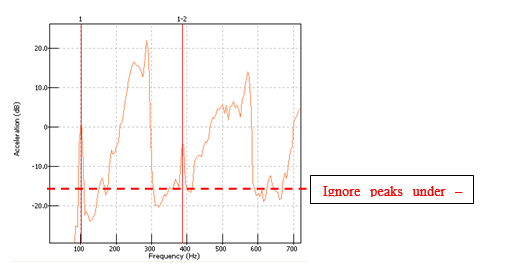
- Ignore under: Does not display the detected peak if the peak is under this value. In the example below, the "ignore under" value is –15 dB.
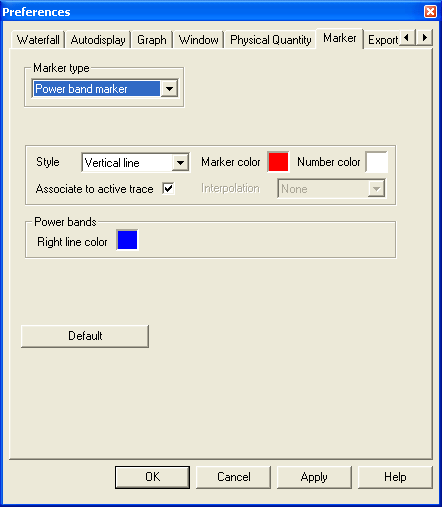
Power band marker page
Style
Selects marker drawing style used in graphical area. The available marker drawing styles are:
- Vertical line
- Vertical dashed line
- Vertical with rectangle
- Cross-hair
- Vertical + Horizontal
- Marker color: Selects the marker color used in the graphical area.
- Number color: Selects the marker number color used in the graphical area.
- Associated to active trace: If checked, the marker added will be associated with the active trace: the markers display the values only for the active signal. If not checked, the markers display all the values when not associated with a signal.
Power bands
- Right line color: Selects right line color.
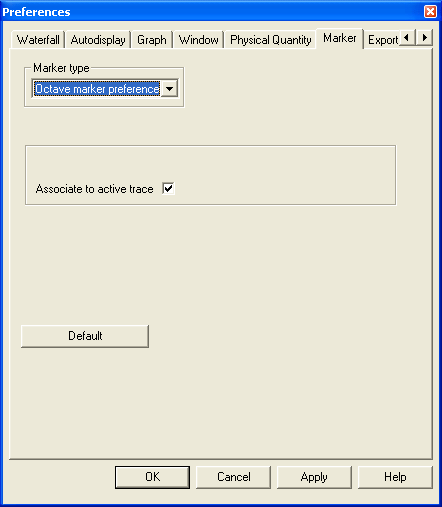
Octave marker page
- Associated to active trace: If checked, the marker added will be associated with the active trace: the markers display the values only for the active signal. If not checked, the markers display all the values when not associated with a signal.
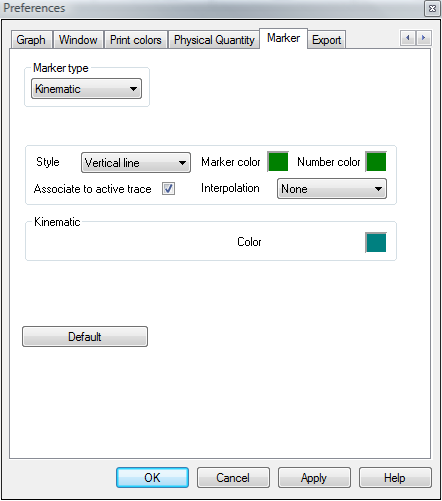
Kinematic marker page
Selects marker drawing style used in graphical area. The available marker drawing styles are:
- Vertical line
- Vertical dashed line
- Vertical with rectangle
- Cross-hair
- Vertical + Horizontal
- Marker color: Selects the marker color used in the graphical area.
- Number color: Selects the marker number color used in the graphical area.
- Associated to active trace: If checked, the marker added will be associated with the active trace: the markers display the values only for the active signal. If not checked, the markers display all the values when not associated with a signal.
- Interpolation: This setting selects the interpolation of values displayed in the marker table.
- None: no interpolation applied.
- X: x interpolation is active.
- X & Y: x and y interpolations are active.
Note: the interpolated values of harmonic markers will be available only if the harmonic marker is placed on a peak. The peak detection criteria are the same as the peak marker adjusted in the User preferences. The marker can be moved by 1/32 step. The x value is computed with the selected weighted window.
Export
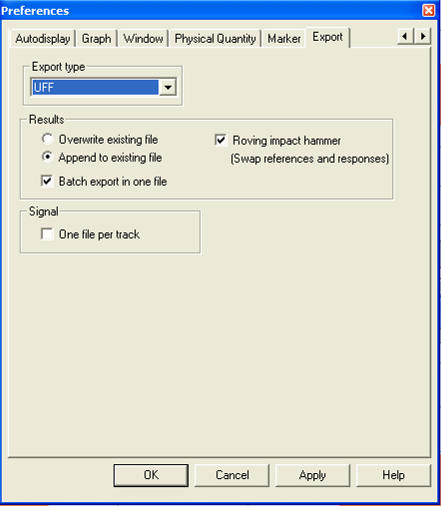
This function is used to configure the way data is converted to a specified format.
UFF
UFF58 time export is ASCII so that resulting export file size may quite large. Time to export UFF58 files may be long according to the ASCII file size being exported.
Note: UFF export format also stores the result physical quantity. Please ensure that the software you will use to load the UFF file is set to the same physical quantity as the imported file.
Results
- Roving impact hammer: This option is used only when converting cross-spectra, FRH, coherence. Depending on the habits, the response and the reference may be different. For instance, to use a UFF converted file in Smart office software, the option must be selected.
- Overwrite existing files: you can overwrite existing files by new results.
- Append to existing files: you can append new results to existing files.
- Batch export in one file: The same features are associated to batch export, allowing the export of multiple acquisitions (from on project or several ones) in one unique file.
Signal
- One file per track: When a signal file is converted to UFF, every track is saved in a separate file if this option is selected.
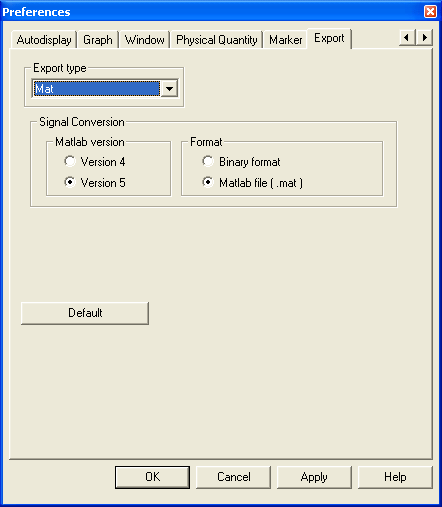
Mat
Matlab export requires that the PC virtual memory be adjusted to double the size of the native OROS time recording.
For instance for a 500Mb OROS time data record to be converted into Matlab, you may need to adjust the PC virtual memory to 1Gb.
Matlab version
Used to select the matlab version of the created file. Refer to your installed version to find out which version you should select.
Format
- Binary format: The conversion of a signal file generates a matlab file containing the description of the track and one binary file containing the data itself. A procedure for reading the data in matlab has to be written.
- Matlab file (.mat): The conversion of a signal file generates a matlab file containing the description of the track and the data itself. Very large file may be difficult to open in Matlab.
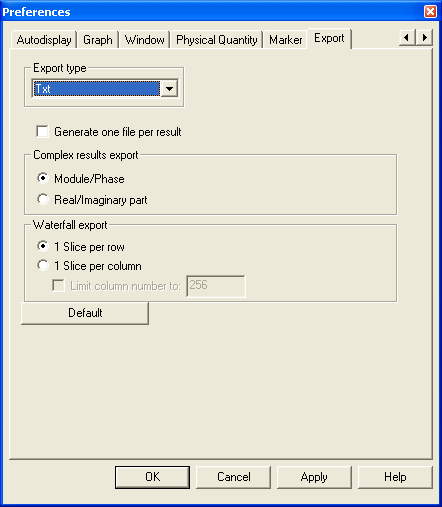
Txt
Generate one file per track
When a result file is converted to txt, every result is exported to a dedicated file.
Complex results export
- Module/Phase: Complex result are in the Module / phase format.
- Real/Imaginary part: Complex results are in Real / Imaginary part format.
Waterfall export
- 1 slice per row: The Waterfall is displayed in the exported file so that each line represents a slice of the Waterfall (a spectrum for instance). If the Waterfall contains 50 slices, and the spectra contain 401 lines, the text file will contain 50 lines and 401 columns.
- 1 slice per column: The Waterfall is displayed in the exported file so that each column represents a slice of the Waterfall (a spectrum for instance). If the Waterfall contains 50 slices, and the spectra contain 401 lines, the text file will contain 401 lines and 50 columns.
- Column limitation: When the one slice per column option is selected, it is possible to specify the maximum number of columns that should be created. If the result contains more slices than this number, it is split. This option should be selected when the file is opened with a spreadsheet editor, because the number of columns in this editor might be limited (256 for Excel).
Wav (audio)
This option only applies to the conversion of signals to audio wav files, not to standard wav files.
Exported wav file sampling frequency depends on OROS native file sampling frequency.
OROS native files containing more than 16 tracks will automatically be exported in single tack wav file (one file per track, despite export preference option being unticked).
Compatibility table (OROS to Wav):
| OROS native file sampling frequency (kS/s) | Wav audio formats (kHz) |
| 102.4 | 44.1, 48, 96 |
| 65.5536 | 44.1, 48, 96 |
| 51.2 | 44.1, 48 |
| 32.768 | 44.1, 48 |
| 25.6 | 44.1, 48 |
| 20.48 | 44.1, 48 |
| 16.384 | 44.1, 48 |
| 12.8 | 44.1, 48 |
| 10.24 | 44.1, 48 |
Frequency
Sets the frequency of the converted file. The frequency can be 44.1 kHz, 48 kHz or 96 kHz. It might not be possible to convert the OROS file to the target frequency. It depends on the recording frequency of the OROS file.
Generate one file per track
When a signal file is converted to wav, every track is saved in a separate file if this option is selected.
