Modal First steps
First steps
Modal software first description
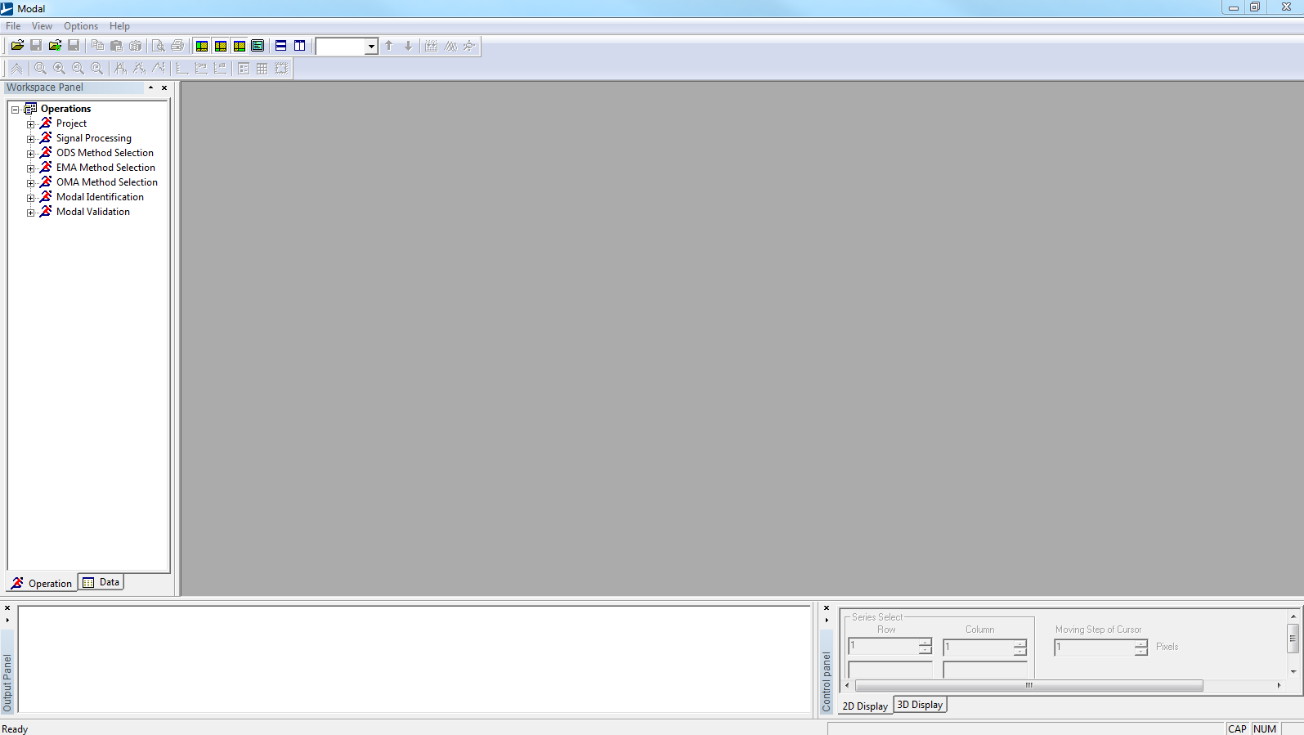
When you launch Modal, the following window appears few seconds.
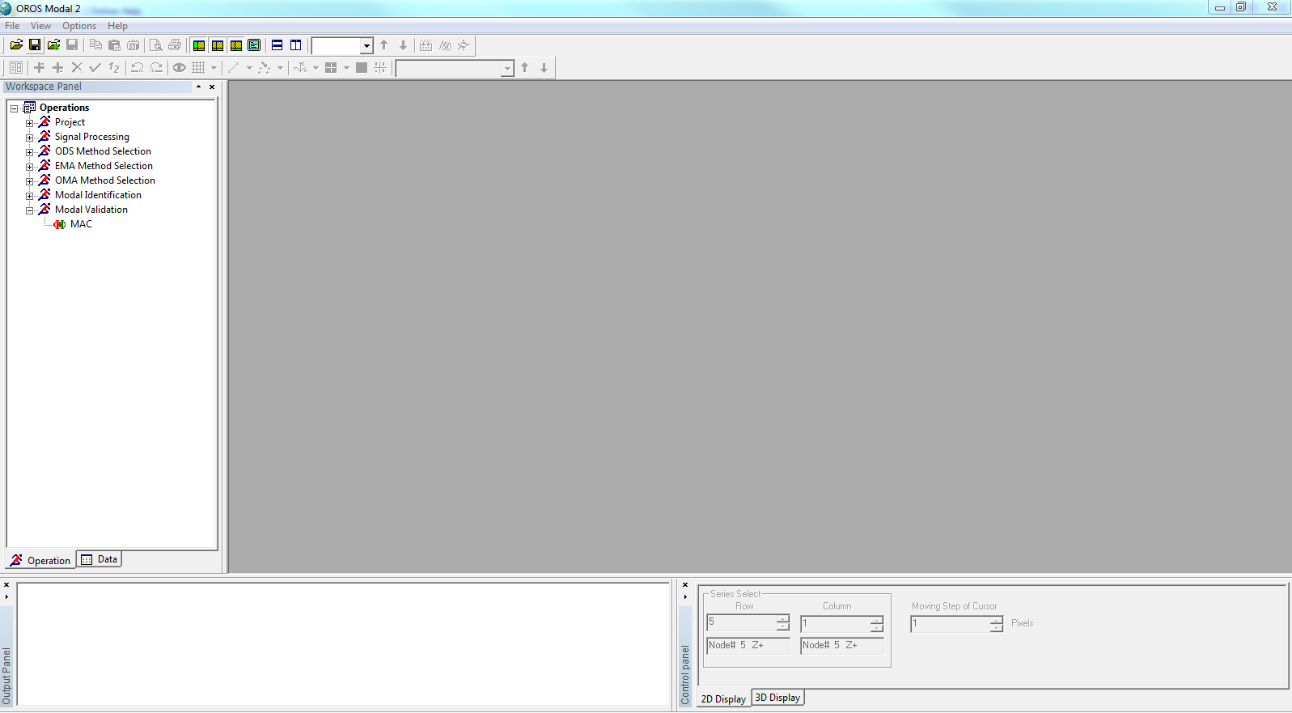
Finally the following window is displayed
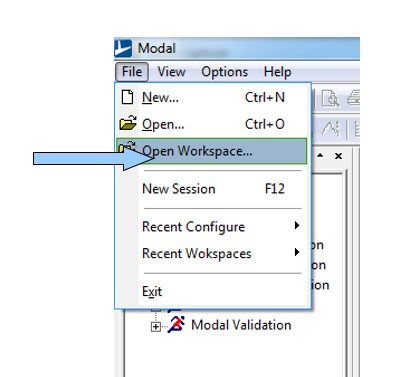
Click on ’file’ in the menu toolbar and on ’open workspace’.
For the first time you can open one of existing projects installed at the same time than the software in the directory ’examples’.
There are:
- 4 different projects for Experimental Modal Analysis
- 2 different projects for Operational Modal Analysis
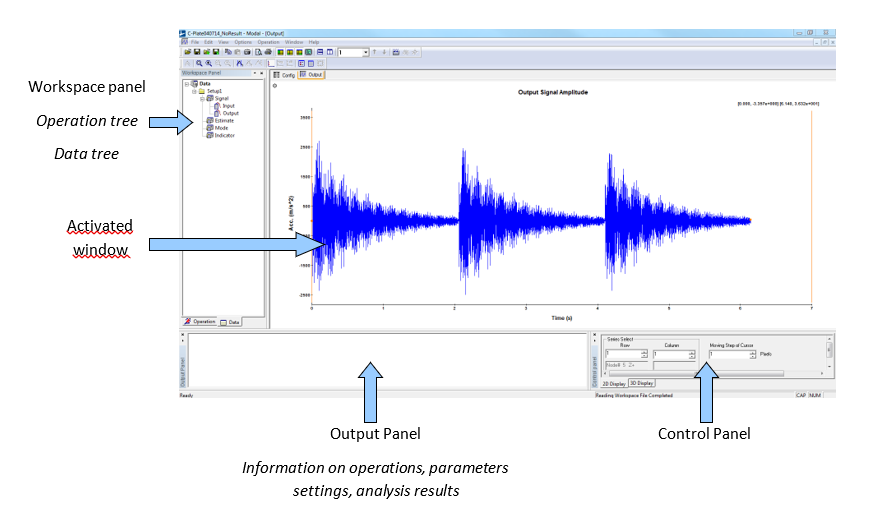
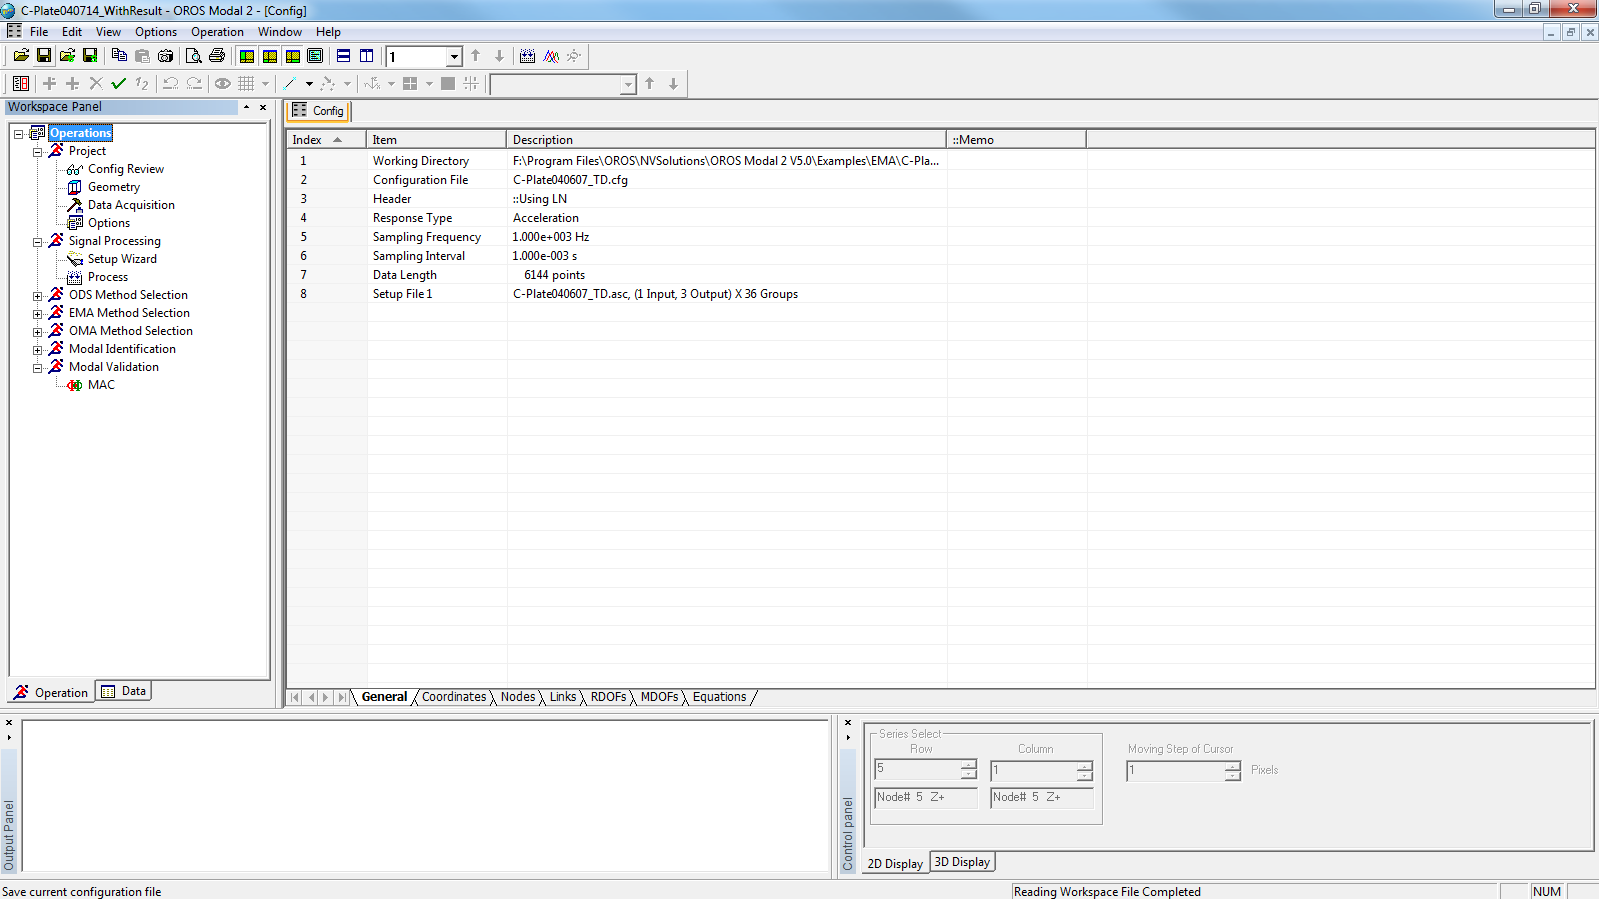
The main interface of the software is so displayed.
The window is shared in four distinct parts. Each of them has their own utilities.
Workspace panel contains:
- an operation tree organized as a wizard to follow the different steps of a modal analysis
- a data tree where you can fine all the data and results imported or calculated in the opened project.
Activated window can display:
- 2D windows: time domain data, FRFs estimation, curve-fitting…
- 3D windows: geometry, mode shapes.
Output Panel displays the last calculated results.
Control Panel contains the different commands and functions respectively useful for 2D and 3D windows.
To know more
To discover the different function of this software, please open the ’getting started’ file installed at the same time than the software. You can follow the different steps described in the document to obtain some results very quickly.
The online help embedded within the software can help you and be also consulted for all kind of questions.
Environment
General interface
When Modal is running, the following interface will be displayed.
The menus, toolbars, workspace panel, output panel and control panel are listed from top to bottom. The center empty area of the interface is reserved for the main window. The workspace panel, output panel and control panel are generally called shortcut panels. The state bar locates in the bottom of window. The menus’ tips, processing bar and its tips are all showed on the state bar.
When you create a new configuration file or open a workspace file without measurement data, the ’Config’ window will first be shown.
When users open a configuration file or workspace file with measurement data, the ’Output’ curve window will first be shown. There are two cursors on the left and right of the window respectively. The red point denotes the closest point to the cursor. The X and Y axes values of the two red points are shown dynamically on the top right corner of the window.
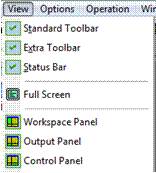
Each part of the interface can be shown or hidden through menu or toolbar operation. Users can also change the size or positions of each part by dragging the mouse.
Besides, all parts of the interface can be arranged to floating style for the purpose of getting more display space.
The software can also remember the adjusted interface style automatically in order to fit users’ habits.
