Difference between revisions of "NVGate Architecture"
m (Lmagimel moved page NVGate Architecture and ASB Overview to NVGate Architecture) |
|||
| Line 38: | Line 38: | ||
[[Image:REF-MAN_VOL1_Analyzer_Settings_Browser_wiki_partA_08.png|framed|none]] | [[Image:REF-MAN_VOL1_Analyzer_Settings_Browser_wiki_partA_08.png|framed|none]] | ||
===Using the analyzer=== | ===Using the analyzer=== | ||
Revision as of 17:38, 21 April 2020
Analyzer architecture
On-Line acquisition synopsis
The following synopsis presents the basic structure of the NVGate multi analyzer architecture for real-time acquisition and analysis. In this mode, OR3X processes parallel analysis with all plug-in analyzers running at the same time (FFT, 1/n Octave, SOA, Recorder…). The Front-end inputs may be connected to any plug-in analyzer through the channels. There are up to 32 (8 for OR34/OR35 analyzer) channels on each plug-in analyzer. Any input plug-in analyzer channel combination is allowed.
The plug-in analyzers share general resources such as Filters, Events, Time windows, and Tachometers. These resources can be associated with any channel or plug-in analyzer with a centralized set of parameters: for example, by applying filter 1 to channel 1 to 8 of each plug-in analyzer and filter 2 to channels 9 to 16 you can modify filtering characteristics directly from the resource settings.
The Filter builder provides general purpose filters for low pass, high pass, pass band, stop band and integration functions that apply to the time domain signals. For example: distributing Input I to channel 1 to 3, will provide simultaneous analysis of acceleration, velocity and displacement of an accelerometer by applying Integrator filter to channel 2 and double Integrator filter to channel 3. The Time windows resources allow the modification of force and response weighting windows. For example: associating the force window with channel 1 and the Response window to the rest of channels allows the modification of response characteristics from a single set of parameters in the resource.
The Event Definition resource is used to create an event that can start, stop and trigger plug-in analyzers acquisition. These events can be based on different criteria (DC level, RPM, time…) as well as on results computed by the Monitor (Kurtosis, RMS, DC…). For example: an event based on an input RMS level can be used to start and/or stop the FFT averaging and the Recorder simultaneously by connecting the event to the plug-in analyzer trigger sub-module.
The Waterfall module collects and synchronizes the results computed and provided by the different plug-in analyzers. These results are displayed in segments and can be sorted in relation to selectable references (Time, RPM, DC…). For example: while computing orders, it is possible to track these values by adding them and the Tachometer (the reference) to the Waterfall. You will then be able to display order profiles and switch the reference between time and RPM. It is then possible to add any new result (value or spectrum) or any reference (DC input, 2nd tach) to the Waterfall.
Using the ’Setup’ menu (see also VOL3 § "Operation with Vision") it is possible to guide you through connections of inputs, player tracks, output signals, event, filters or waterfall and display properties related.
Post Analysis synopsis
In the Post analysis mode, the Front-end and Output signals are no longer available. The only source able to provide recorded time signals is the player. Post analysis features exactly the same functions as the On-Line mode replacing the inputs by the Player tracks. The Player tracks are then connectable to the plug-in analyzer channels and can be used by the resources. Post analysis processing can be performed on the DSP (Connected mode, only for OR36/OR38) as well as on the PC CPU (Office mode).
In addition to the Post analysis, it is possible to split the recorded signal files (channels and duration) by re-recording selected channels and time segments in a new signal file.
Post analysis processing time depends directly on the computation load. It may be faster or slower than the real-time analysis. Using the Post analysis accommodates larger requests in terms of computation power that cannot be achieved in real-time analysis.
Using the analyzer
Considerations for post-processing
NVGate provides specialized modes that enable dedicated functionalities related to the application. By selecting specialized mode functionalities such as;
If the time signal is recorded on the PC or on the Mobi-Disk™, it is highly recommended to be in office mode (hardware not connected) in order to avoid low performances and malfunctions.
By selecting specialized mode functionalities such as;
- Availability of results
- Settings
- User preference,
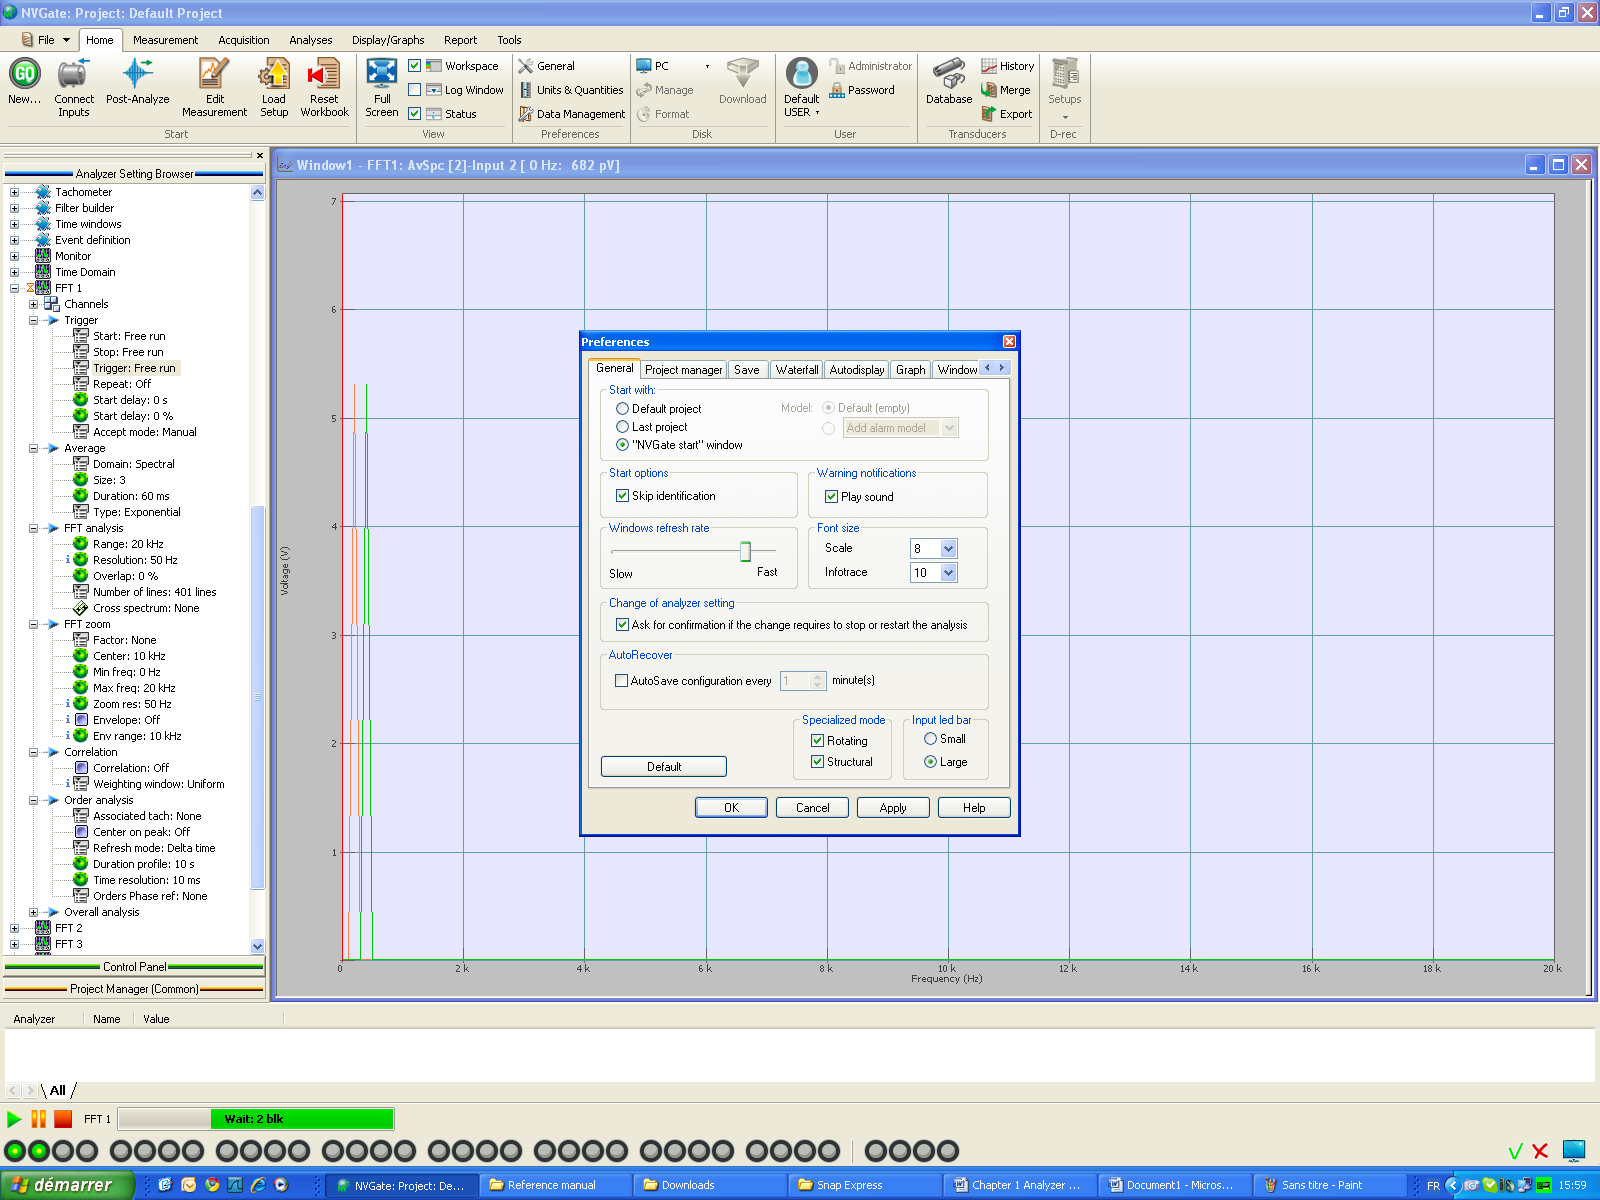
will be enabled. Unselecting specialized mode will mask these functionalities. There are 2 specialized modes:
- Structural mode: this mode is dedicated to the acquisition of modal data through hammer acquisition or signals provided by up to 6 shakers. The following topics are available when structural mode is active:
- Visibility of FRF (H1, H2) and Coherence results in FFT plug-ins.
- Visibility of time windows (force and response) in the ASB, and control panel.
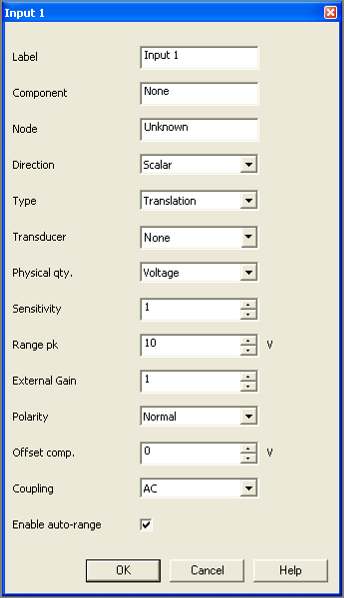
- Availability of the inputs node settings in the inputs properties (ASB, Control Panel and Ribbon)
Availability of accept/reject in the bottom right:
- Rotating mode: this mode is dedicated to rotating and reciprocating machines. The following topics are available when rotating mode is active:
- FFT order extraction, constant band tracking or synchronous order.
- Tachometer settings.
- Plug-in analysis ’Sync Order’ will be unlocked.
Note: these specialized modes can be selected (by default) in the user’s preferences.
Controls
This section explains how to access the different controls contained in the ASB (settings, custom display...) and what they mean.
Access
There are 4 way to access a setting:
From the module
The first access level is available by right clicking on a module (Front-end, Recorder, Tachometer, FFT...) and Properties where all the settings contained in this module can be adjusted.
From the collection
The second access level is available by right clicking on a collection (Inputs, Outputs, Channels, Tracks...) and Properties where all the settings contained in this collection can be adjusted.
It is also possible to copy and paste some items from a cell, a line, a column or a group of cell to another if they have compatible titles (Label, Transducer, Sensitivity…).
Copy/paste Front-end tables
Taking advantages from the Excel capabilities for tables’ creation and updating, NVGate V8.30 offers now to update the front-end/player tracks from Excel table.
This feature uses the Windows® clipboard.
Two entries are made available from the contextual menu of the front-end or player tracks properties:
Copy to Clipboard and Paste from Clipboard. These commands come in addition to the local copy & paste which allows duplicating cells locally. Note that it is also available from any NVGate table.
Using the new Copy to clipboard capability allows pasting your inputs/track configuration to Excel, modifying it and then return it back in to NVGate. This also works with any spreadsheet software accepting csv content.
Generally, it works as a WYSIWYG (What You See Is What You Get); Data are exported in the same format/unit as displayed in NVGate table. Import (Paste into NVGate) behaves like you are typing the values.
Nevertheless, some precautions apply transferring data from Excel to NVGate:
- Headers (line and column) are added when pasting in Excel. This cell should not be copied prior to paste in NVGate.
- For the purpose of correct reading, units’ columns are automatically added. These columns are ignored when pasting into NVGate. These columns may be absent from the Excel table.
- The figure (sensitivity, offset, etc...) units are read according to the current NVGate user preference one - not the units in the Excel table.
- Paste in NVGate starts from the upper-right cell of the area to update in the NVGate table. The cell should not be in editing mode.
- If pasted value is not acceptable for NVGate, the corresponding cell will:
- Adjust it to the closest upper value if it is possible (ex: max range)
- Ignore and keep the current one if not acceptable (ex: unknown coupling)
From the sub-module
The third access level is available by right clicking on a sub-module (Input x, Output x, Track x, Channel x...) and Properties, where all the settings contained in this sub-module can be adjusted.
From the setting
The fourth access level is available by right clicking on the setting itself (Label, Duration, Transducer, Coupling...) and Properties, where the new value for this setting can be entered.
Contextual menus appear when right clicking on an area or an item.
On an item
Different controls are available according to the item you right click on.
- Properties: displays the properties of the item.
- Add/Remove: Available for collections (Channels, Event...), it enables or disables some items of the collection
- Set to default: Reset a setting, a sub-module or a module to the default values. All connections are removed
- Copy (Ctrl+C): Copy a setting, a sub-module, or a module. This copy is internal and does not use the Clipboard
- Paste (Ctrl+V): Available when a copy action has been previously performed. Only the settings common to both the copy and the paste item are affected
- 'IDN 'info: Available only when the Shift key is pressed. It displays an identification number used by NVDrive
- View state: Available only on plug-ins, it hides or shows the status of this plug-in in the Status window
- Add to control panel: Enable the corresponding setting to be modified from the Control Panel.
- dB: Enable the corresponding setting to be displayed in dB. Only available for some scalar settings.
On ASB background
- Auto width: this function adjusts the width of the ASB.
Plug-in analyzer status
An icon is displayed in the ASB when a plug-in is connected. For each plug-in the icon displays the analysis status (running, stopped, recording...).
- Running
- the plug-in analyzer is processing the data acquisition.
- Paused
- the plug-in analyzer is paused. The plug-in analyzer is not processing any data. The user must click on the "continue" button to continue the analysis. For the recorder plug-in the "Continue" action starts a new record because in the paused state no data is recorded.
- Stopped
- the plug-in analyzer is stopped.
- Recording
- the plug-in recorder is processing the data acquisition.
- Block Triggering
- the plug-in analyzer is waiting for the Trigger event to occur in order to process the data.
- Waiting
- in the manual rejection mode, the plug-in analyzer is waiting for the user to accept or to reject the current analyzed signal block.
- Failure
- the plug-in analyzer has failed (the analyzer is no longer able to compute the data acquisition; a warning message will appear)
Copy/Paste setting between plug-ins
By right clicking on any settings of the ASB you can Copy values of settings, and then Paste it anywhere else. There is an automatic type matching, which allows pasting only value of the same settings (using the IDN number).
This Copy/Paste is available at each level of the ASB. This let you the opportunity of the multi-analysis in the same condition.
For example you can see the same signal in the time domain and in the spectral domain, with exactly the same settings (for instance resolution). In the following example, the FFT1 have been set in the ’Spectral domain’, with a specific range and a resolution. For the FFT2, right click on FFT2 and paste the setting from FFT1, then you have just to change the domain from spectral to time in that case. You can compare the signal in, exactly, the same conditions.


