Difference between revisions of "NVGate Operator"
| Line 7: | Line 7: | ||
[[File:operator.png|600px]] | [[File:operator.png|600px]] | ||
<br> | <br> | ||
===Arithmetic average=== | ===Arithmetic average=== | ||
| Line 22: | Line 23: | ||
To set the Q coefficient, add up all results, check the box below "Operation result", and enter the value. | To set the Q coefficient, add up all results, check the box below "Operation result", and enter the value. | ||
===Quadratic average=== | ===Quadratic average=== | ||
| Line 37: | Line 40: | ||
To set the Q coefficient, add up all your result, check the box below "Operation result", and enter the value. | To set the Q coefficient, add up all your result, check the box below "Operation result", and enter the value. | ||
| Line 49: | Line 54: | ||
The default value of Q is 1, but all of these coefficients can be modified. | The default value of Q is 1, but all of these coefficients can be modified. | ||
===dB comparison=== | ===dB comparison=== | ||
Revision as of 10:34, 19 September 2024
For time signal operator, check: virtual input plug in.
Operators
Operators are used to perform calculations using various results. All kind of operators (Arithmetic average, Quadratic average, Linear comparison or dB comparison) are available for any type of results.
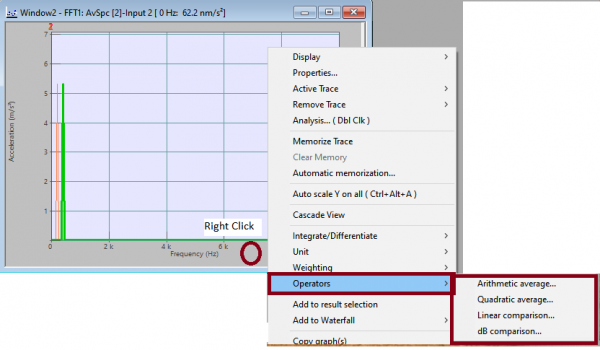
You can access operators on a graphical result using a right click:
Arithmetic average
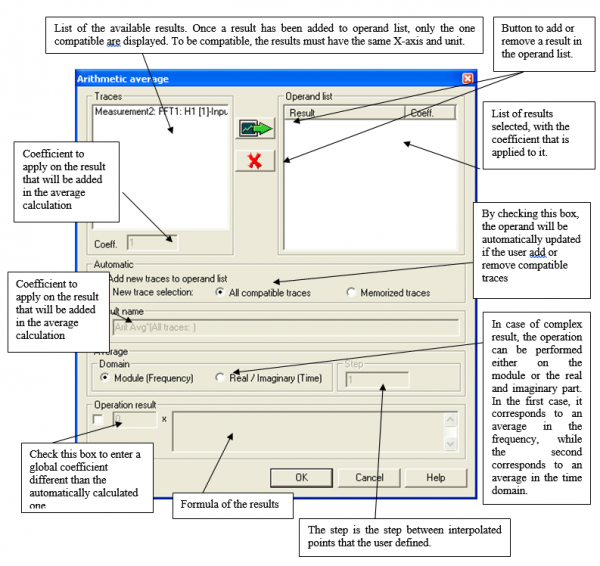
This dialog box is designed to create a new result which is the arithmetic average of several results. This average can be calculated only for results that are in the same window. They must also have the same x-Axis definition.
The formula of the calculated result is:
Average_Result = Q * (C1 Result_1 + C2 Result_2 + ... + Cn Result_n)
The default values of C1, C2...Cn are 1 and the default value of Q is (C1+C2+...+Cn)/n, but all these coefficients can be modified.
To set the C_i coefficient, fill in the "Coef" value and then add one or several results with the following button
![]()
To set the Q coefficient, add up all results, check the box below "Operation result", and enter the value.
Quadratic average
This dialog box is designed to create a new result, which is the quadratic average of several results. This average can be calculated only for results that are in the same window. They must also have the same x-Axis definition.
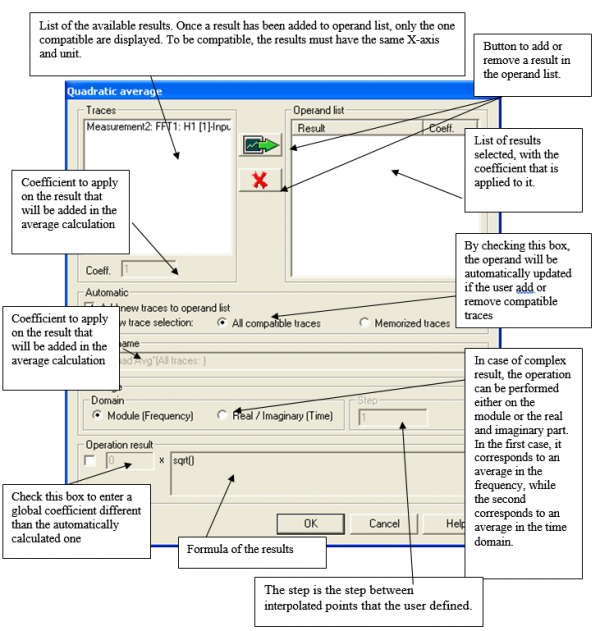
The formula of the calculated result is:
'Comp_Result = Q *[(C1 Result_1² + C2 Result_2² + ... + Cn Result_n²)]½)
The default values of C1, C2...Cn are 1 and the default value of Q is 1, but all these coefficients can be modified.
To set the C_i coefficient, fill in the "Coef" value and then add one or several results with the following button
![]()
To set the Q coefficient, add up all your result, check the box below "Operation result", and enter the value.
Linear comparison
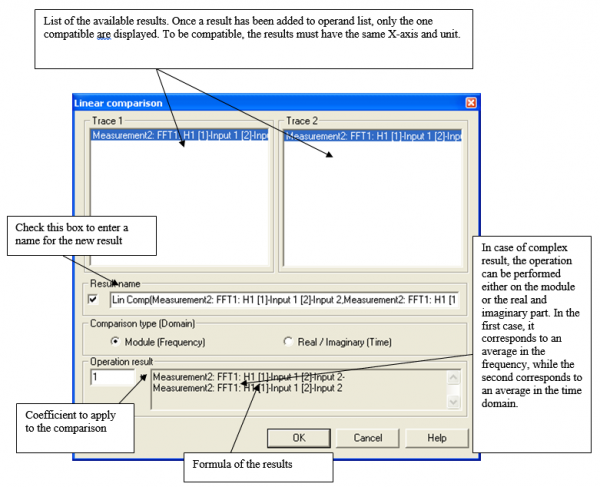
This dialog box is designed to create a new result, which is the comparison of 2 results. This operation can be calculated only for results that are in the same window. They must also have the same x-Axis definition.
The formula of the calculated result is:
Comp_Result = Q *(Result_1 - Result_2)
The default value of Q is 1, but all of these coefficients can be modified.
dB comparison
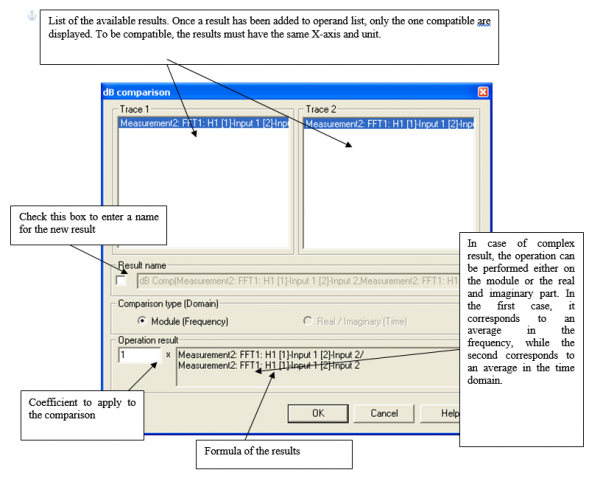
This dialog box is designed to create a new result, which is the comparison of two results. The comparison is made so that the result shows the difference between the two results in dB. It corresponds to the calculation of the ratio between the two results. This operation can be performed only on results that are in the same window. They must also have the same x-Axis definition.
The formula of the calculated result is:
Comp_Result = Q *(Result_1/Result_2)
The default value of Q is 1, but all of these coefficients can be modified.
