Difference between revisions of "NVGate 2021: Release note"
| Line 394: | Line 394: | ||
== Displaying Time in Zoomed signal== | == Displaying Time in Zoomed signal== | ||
It is now possible to diplay the time "relative to measurement" in zoom signal. | |||
[[File:zomm_relative.png|600px]] | |||
== NVdrive : SetViewmeterLevels == | == NVdrive : SetViewmeterLevels == | ||
Revision as of 14:21, 28 December 2020
OROS strives to be closer to its users, carefully listening to needs and requests. For that reason, OROS regularly releases new versions. Customers under contract automatically benefit from each release.

The NVGate® 2021 major version became available in January 2021. This release of the OROS 3-Series analyzer’s software platform brings additional functionalities and significant performance improvements. Below is a summary of the main enhancements of your NVGate experience:
This release note describes the content of version, with operating details.
Compatibility:
NVGate 2021 is compatible with all OROS instruments that have not been discontinued. Depending on the hardware options and version, some instrument features may or may not be available.
Here is OROS Wiki on the line, how can I help you?
All the documentation and help have been completely renewed. We have put an online wiki-based documentation with videos, manual, application notes, download.
This page is in free access and can be consulted here: https://wiki.oros.com/wiki/index.php/Home
Online Help: wiki
We advise being connected to internet to enjoy the new documentation page.
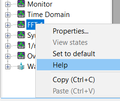
If you are connected to Internet, the following buttons will bring you to the NVGate wiki page.
https://wiki.oros.com/wiki/index.php/NVGate
Be aware than this wiki page have a powerful research button if you need to search any setting.

If you are using NVGate in a different language than english, the wikipage will be opened with /XX at the end (XX correspond to the unicode language.
For example if you are using NVGate in Japanese, help will bring you to the page: https://wiki.oros.com/wiki/index.php/NVGate/ja (==> ja is the international Japanese code)
Off line Help: PDF manual
If you are not connected to internet which may often happen in the field, the NVGate.pdf manual will be opened. This file is located in the "Manuals" folder in the installation directory of NVGate.
Tutorials Videos
The OROS Youtube channel is available here featuring a full panel of videos on how to use OROS products :
We have included tutorial videos in this wiki to help you to use the OROS software.
Tracking bearing frequencies on RPMs variations
Kinematik markers follow FFT tachometer
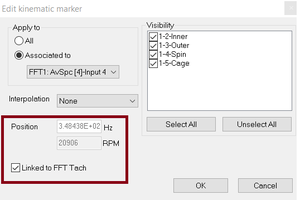
The Kinematik marker can now be associated to the speed of the tachometer. So during a Run up the kinematik marker will automatically move inside FFT spectrum with the speed.
How to use it : Select a Tachometer on the FFT tab from GoToResult page.
Then display a FFT spectrum. Select a kinematik marker and put it on the window.
Now this marker will be linked to the FFT speed.
Then on properties, you can link (or not) this marker to the speed.
Automatic installation of the database
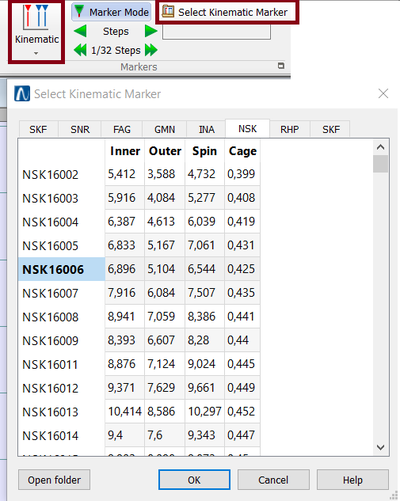
Now the excel kinematic database including bearings from NSK, SKF, FAG, SNRn, GMN, INA, RHP is installed automatically.
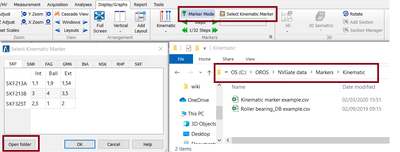
You can find it in the installation folder: "NVGate Data\Markers\Kinematic\"
Direct access to database
When clicking on the "open folder" button, you will directly access the folder where the Excel kinematic database is stored so you can edit the database easily if you need to add the kinematic configuration of a rotating machine.
Relax the limits of filtering!
All details on the filters can be read here
Relaxed constraints on the cut-off frequency
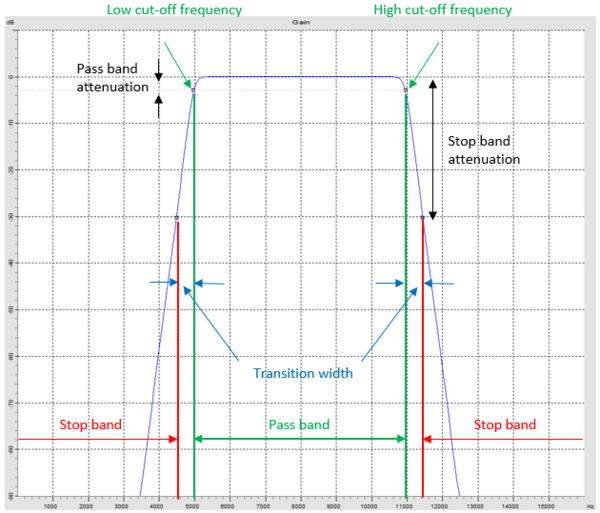
To guarantee the stability of the filter, there are certain constraints on the value of the cut-off frequency. Compared with previous version of NVGate, such constraints are relaxed significantly now.
For the high pass and low pass filters, the maximum value of the cut-off frequency is the input frequency range FR. The minimum value is FR / 50000 in the Office mode, and FR / 40000 in the Connected mode. In the previous NVGate version, the minimum value was FR / 40 for the low pass filter, and FR / 400 for the high pass filter.
For the band pass and band stop filters, the low cut-off frequency flow and the high cut-off frequency fhigh need to meet the following conditions in the Office mode:
- flow ≥ 0.0001 * FR
- fhigh ≤ FR
- 0.0004 * FR ≤ fhigh - flow ≤ 0.9998 * FR
And in the Connected mode, the conditions are as below:
- flow ≥ 0.0005 * FR
- fhigh ≤ FR
- 0.000675 * FR ≤ fhigh - flow ≤ 0.99 * FR
In the previous NVGate version, the conditions on the cut-off frequencies were:
- flow ≥ 0.055 * FR
- fhigh ≤ FR
- 0.0075 * FR ≤ fhigh - flow ≤ 0.99 * FR
Improved precision
Now, the filters are calculated in 64-bit floating point format in the Office mode, and in 40-bit floating point format in the Connected mode. In the previous NVGate version, the 32-bit floating point format was used in both modes.
New prototype filters
In addition to the Butterworth filter, now you can build the IIR filters with the Chebyshev type I (band-pass ripple) filter or Chebyshev type II (stop-band ripple) filter.
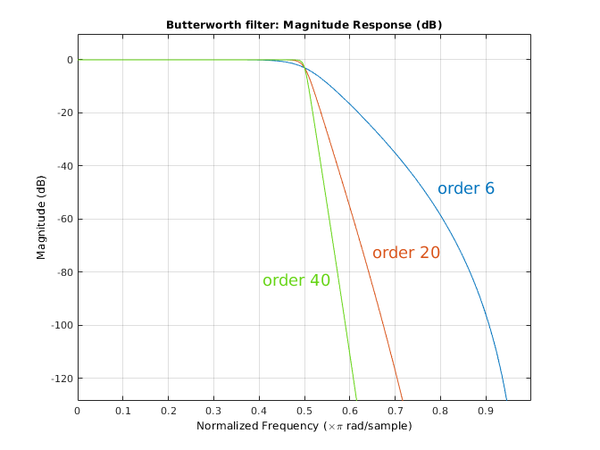
The Butterworth filter has flat response in both the pass band and stop band, but its transition band is wide.
The Chebyshev type I (band-pass ripple filter) has the steepest roll-off among the three filters, and its response in the stop band is flat. However, it has ripples in the pass band.
The Chebyshev type II (stop-band ripple) filter has flat response in the pass band, but it has ripples in the stop band. Its transition band is narrower than the Butterworth filter, but wider than the Chebyshev type I.
Below is an example showing these three filters with the same filter order.
Thanks to its maximal flat frequency response in the pass band, the Butterworth filter is commonly used in applications where signal distortion should be minimized, such as audio noise reduction. It is also widely used for anti-aliasing. The Chebyshev filters are optimized to provide steep roll-off, and they are usually used in applications where the maximum rejection of the nearby frequencies is required.
Increased filter order
The order of the filter affects the steepness of its roll-off. The higher the order is, the sharper the transition between the pass band and the stop band is. An example demonstrating the impact of the filter order is shown below.
For the high pass and low pass filters, the filter order can be selected from 1 to 40 in the Office mode, and from 1 to 10 in the Connected mode now. In the previous NVGate version, the maximum filter order was 6.
For the band pass and band stop filters, the filter order is 2*N, and N can be selected from 1 to 30 in the Office mode, and between 1 to 10 in the Connected mode now. In the previous NVGate version, the maximum value of N was 5.
Octave overall no limitation
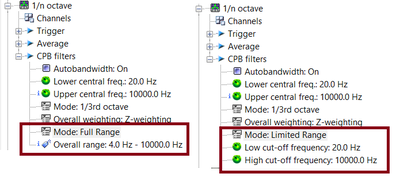
1/n Octave Overall levels frequency range plug-ins are now editable. You can define the min and max. This overall is computed in the time domain (weighting filter and detector). Processing weighting in the time domain provides accurate measurement for non-stationary signals (impulsive).
Full range mode computes the overall on the whole frequency range excluding the DC component. (The minimum range is defined by "CPB filters Lower central frequency"/5).
Limited range lets the user define the range by changing the low cut off frequency and high cut off frequency.
Enrich your measurements in real time: from GPS to environmental metadata
The DC simulated inputs allow you to inject up to 32 external DC channels in NVGate from external source (exemple : GPS, weather station, external can bus...). The frequency sampling is up to 15 samples / second. Thanks to the python developer toolkit, a developer can easily develop an interface to inject the values into NVGate. The GPS and weather station below have been developed using the DC simulated.
This option is included with the reference ORNV-VI-DC (which also includes the Virtual input).
How to use it:
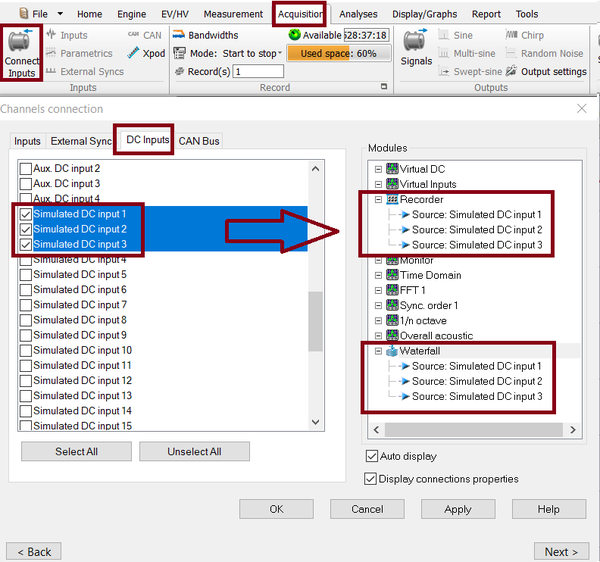
on the Acquisition Tab, select connect input, select the DC inputs and select the DC simulated channels.
These channels can be activated and connected to the recorder and/or waterfall like any other DC channels.
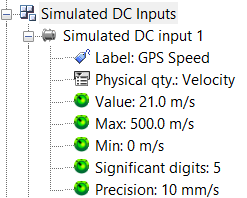
The settings Value (which can be controlled by an external software) will change the value of the inputs.
The other DC simulated settings details are explained on the front end settings page.
GPS
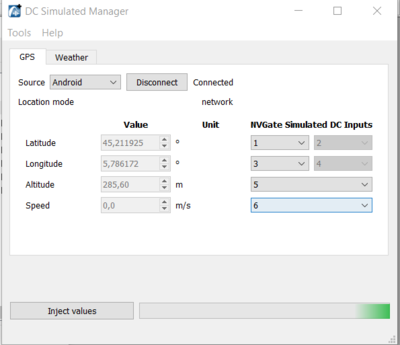
Thanks to the "DC simulated channels" we have created an Add-on to record GPS data.
The GPS have the following features
- Record the X-Y GPS coordinates.
- Record and display the speed profile.
- Use the speed profile as a waterfall reference.
- Creat a .gpx and display it on an internet website if you have an Internet connection).
You can visit the dedicated page to download it and advanced configuration. : https://wiki.oros.com/wiki/index.php/NVGate_DC_Simulated_Manager
We have 2 ways to acquire the GPS position, android phone or GPS Compliant with NMEA 0183 standard.
Serial GPGGA GPS
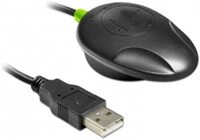
We are compatible with GPS USB Serial Interface Compliant with NMEA 0183 standard GPGGA
We can recommend the GPS USB Navilock NL-602U but other GPS units will work as well.
Android GPS
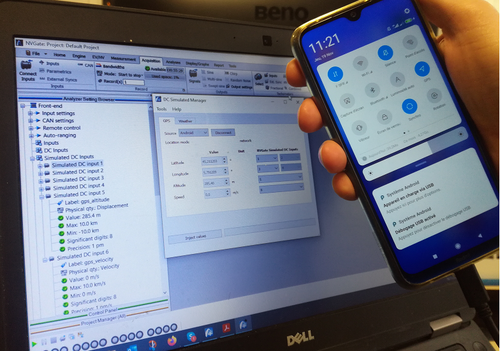
GPS data can also be retrieved using Android ADB (Android Debug Bridge). If you plug your android phone, we can inject the GPS position into NVGate.
How to use it
Once the gps is plugged and configured, click on inject data, this will put the value on the DC simulated inputs.
Then you can use these channels on NVGate.
If you need to record the data, click on connect input, go on DC input tab, then drag and drop the DC simulated channels on recorder.
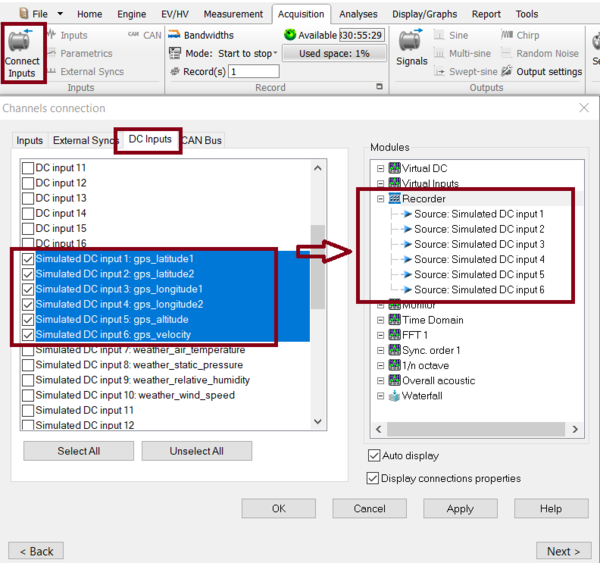
If you have recorded the data you will be able to create a .gpx file
Creating and visualize .gpx file
We can create a .gpx from an .oxf (OROS) signal file. a .gpx is gps file to follow the geographic information of the signal on a map.
You need to click on "Convert signal to gpx".

This will open the windows below.
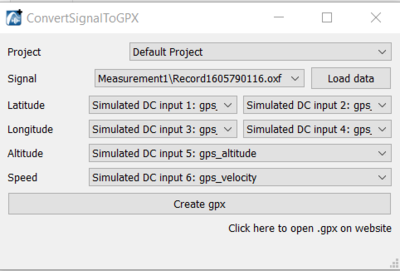
Select the signal file that you need to convert and click on load data. You can modify the channels if needed. Click on create .gpx. The .gpx will be put in the "attachement" folder of the NVGate project.
If you want to visualize the .gpx we advise using the website : https://www.gpsvisualizer.com/ Clicking on "Click here to visualize the .gpx on a website" opens a website allowing you to plot the gpx on a map.
Weather station
Precipitation, wind speed/direction, pressure, temperature, and pressure can prejudice sound pressure levels or need to be recorded when you are doing sound measurement.
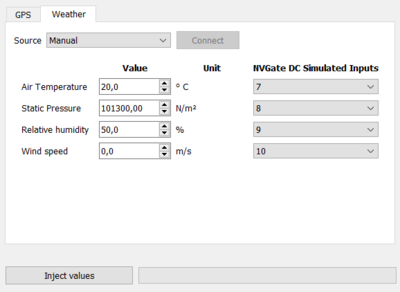
Thanks to the DC simulated channels, we can now enter manually the value or we can connect a weather station to NVGate.
Manual
The user can enter manually the weather value.
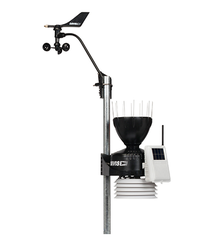
Davis instruments weather station
3 elements are required to make it work
- 6322OV Wireless Vantage Pro2 Integrated Sensor Suite
- 6510USB WeatherLink Data Logger.
This weather station provides accurate, reliable weather monitoring with real-time data updates every 2.5 seconds. Sensor suite includes outside temperature and humidity sensors in a passive radiation shield, wind speed and direction, and rainfall.
Note : The weather Station needs to pass by OROS SA for configuration.
Other weather stations
Please contact OROS to check the possibility to import the data (paid service).
DC Dynamical sensor y = ax+b calibration
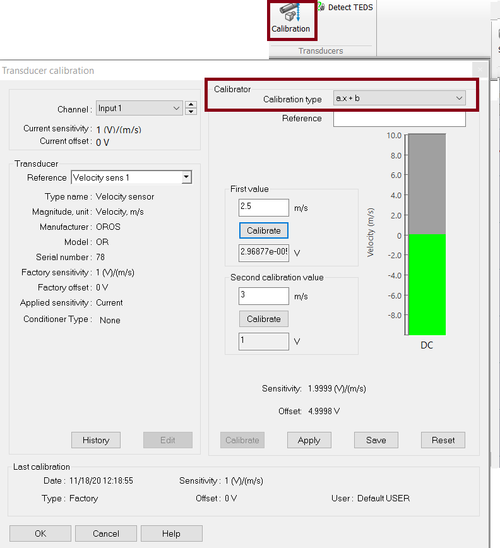
It is now possible to calibrate a dynamical sensor in "DC" or "DC floating" coupling using 2 values, then the software will automatically compute sensitivity and offset to obtain the "y = ax + b" formula.
This function is practical for 4-20 mA sensors or “quasi-static” sensors acquired on dynamic channels. Wire sensor displacement sensor calibrated with a rule, pressure sensor with a calibrated compressor, proximity probe calibrated with a micrometer.
For using it, first create a DC sensor on the sensor database. Then apply this sensor to a channel.
Now on the calibration part, you can calibrate it using 2 values. Then the software will automatically apply the sensitivity and offset.
Remove a sensor from history
If you have made a mistake during a sensor calibration, you can now delete a value from calibration sensor history.
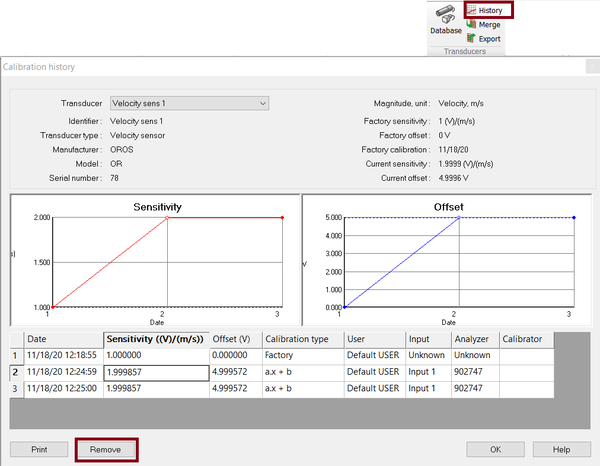
You need to go on history, select the sensor, select the value that you need to delete, then click on remove.
How much does this body shake?
The OROS Body Vibration tool allows you to evaluate the effect of vibration on the human body according to standards ISO 2651 and ISO 5349. These standards define measurement practice and vibration signal analysis to evaluate the effect on health and comfort of environmental and equipment vibrations on the Human body.
The ISO 2651 describes the effect on health and comfort of vibration on the whole-body in transportation system, and the ISO 5349 the effect on health of vibration on hands and arms when manipulating machine-tools or vibrating objects.
This is a post analysis toolkit, operating after the recording of the signal. It will calculate time-weighted signal of acceleration and specific indicators both defined in the standards.
Standards compatible: international standards about whole/body vibration including: ISO 5349, ISO 8041, ISO 2631-1 and ISO 2631-5.
Whole/body Vibration Indicators include : VDV, MSDV, MTVV, Weighted raw, al(ISO 2631-5), D(ISO 2631-5) are available. RMS, Peak, Crest, peak-Peak, are also available in NVGate plug in.
| Failed to parse (MathML with SVG or PNG fallback (recommended for modern browsers and accessibility tools): Invalid response ("Math extension cannot connect to Restbase.") from server "https://wikimedia.org/api/rest_v1/":): {\displaystyle MTVV} | Maximum Transient Vibration Value, represent the maximal RMS value of the signal |
| Failed to parse (MathML with SVG or PNG fallback (recommended for modern browsers and accessibility tools): Invalid response ("Math extension cannot connect to Restbase.") from server "https://wikimedia.org/api/rest_v1/":): {\displaystyle VDV} | Vibration Dose Value, taking into account the temporal shocks in the signal |
| Failed to parse (MathML with SVG or PNG fallback (recommended for modern browsers and accessibility tools): Invalid response ("Math extension cannot connect to Restbase.") from server "https://wikimedia.org/api/rest_v1/":): {\displaystyle MSDV} | Motion Sickness Dose Value, representing the comfort in transportation measurement |
| Failed to parse (MathML with SVG or PNG fallback (recommended for modern browsers and accessibility tools): Invalid response ("Math extension cannot connect to Restbase.") from server "https://wikimedia.org/api/rest_v1/":): {\displaystyle D_k} | The Acceleration Dose, representing the effect of the vibration on the spine |
| Daily maximal exposure value (Calculated from Post processing in NVGate) | |
| Failed to parse (MathML with SVG or PNG fallback (recommended for modern browsers and accessibility tools): Invalid response ("Math extension cannot connect to Restbase.") from server "https://wikimedia.org/api/rest_v1/":): {\displaystyle Peak} | Amplitude Peak of the vibration; maximal amplitude of the signal from the 0 (Calculated from Post processing in NVGate) |
| Failed to parse (MathML with SVG or PNG fallback (recommended for modern browsers and accessibility tools): Invalid response ("Math extension cannot connect to Restbase.") from server "https://wikimedia.org/api/rest_v1/":): {\displaystyle Crest factor} | Ratio between the Peak level and the RMS of the weighted signal(Calculated from Post processing in NVGate) |
Signal fitering including:
| Failed to parse (MathML with SVG or PNG fallback (recommended for modern browsers and accessibility tools): Invalid response ("Math extension cannot connect to Restbase.") from server "https://wikimedia.org/api/rest_v1/":): {\displaystyle W_k} | Time weighting for the Z axis for whole-body measurement (ISO 2651-1) |
| Failed to parse (MathML with SVG or PNG fallback (recommended for modern browsers and accessibility tools): Invalid response ("Math extension cannot connect to Restbase.") from server "https://wikimedia.org/api/rest_v1/":): {\displaystyle W_d} | Time weighting for the X and Y axis for whole-body measurement (ISO 2651-1) |
| Failed to parse (MathML with SVG or PNG fallback (recommended for modern browsers and accessibility tools): Invalid response ("Math extension cannot connect to Restbase.") from server "https://wikimedia.org/api/rest_v1/":): {\displaystyle W_h} | Time weighting for the hand-arms measurement in any direction (ISO 5349-1) |
| Failed to parse (MathML with SVG or PNG fallback (recommended for modern browsers and accessibility tools): Invalid response ("Math extension cannot connect to Restbase.") from server "https://wikimedia.org/api/rest_v1/":): {\displaystyle W_f} | Time weighting for motion sickness measurement in the vertical direction (ISO 2651-1) |
| Failed to parse (MathML with SVG or PNG fallback (recommended for modern browsers and accessibility tools): Invalid response ("Math extension cannot connect to Restbase.") from server "https://wikimedia.org/api/rest_v1/":): {\displaystyle W_c} | Time weighting for the X axis for whole-body measurement (ISO 2651-1) |
| Failed to parse (MathML with SVG or PNG fallback (recommended for modern browsers and accessibility tools): Invalid response ("Math extension cannot connect to Restbase.") from server "https://wikimedia.org/api/rest_v1/":): {\displaystyle W_e} | Time weighting for all rotational directions for whole-body measurement (ISO 2651-1) |
| Failed to parse (MathML with SVG or PNG fallback (recommended for modern browsers and accessibility tools): Invalid response ("Math extension cannot connect to Restbase.") from server "https://wikimedia.org/api/rest_v1/":): {\displaystyle W_j} | Time weighting for the Z axis for head comfort measurement (ISO 2651-1) |
How to use it: https://wiki.oros.com/wiki/index.php/Human_Vibration
This Add-on is free of charge for NVGate 2021 users and TDA (?)
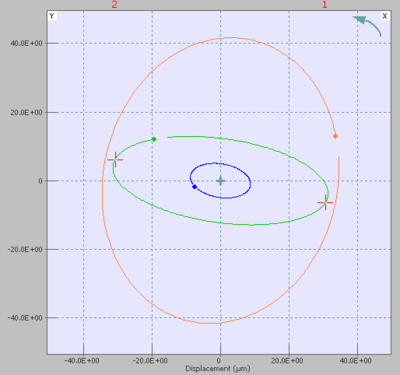
Orbit display included in FFT diag or ORD diag
For customer with option FFT-Diag or ORD-Diag, they will now have the Orbit display available in NVGate.
The orbit is available using the add/remove windows.
For more details, please check the orbit dipslay page.
Miscellaneous
Displaying Time in Zoomed signal
It is now possible to diplay the time "relative to measurement" in zoom signal.

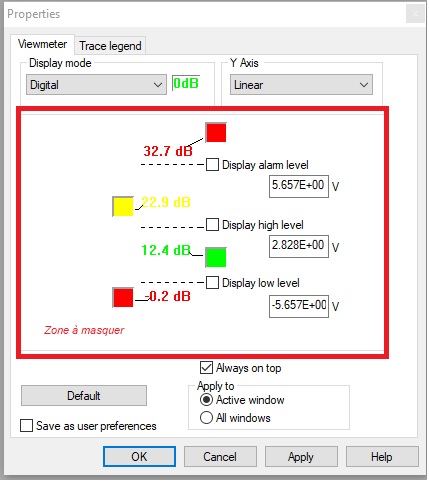
NVdrive : SetViewmeterLevels
Using NVdrive, you can now control and set the alarm level, high level and low level.
Check the NVDrive toolkit for more info.
Bug fixing
- 13728: [Fractional Tachometer] Using a fractional tachometer lead to DSP error -
- 13729: [Drec] : Impossible to record more than 38 ch in Drec
- 13672: Delta RPM with source DC tach (from monitor) - do not trig the waterfall
- 10572: Low pass response for ICP and AC coupling poorly specified
- 13811: NVDrive GetResultEx error while running without displaying result
- 13774: Orbit display improvement
- 13790: Change the number of displayed orbits
- 13794: A problem of DRPM stop at 5000 RPM instead of 6000.
- 13953: [General] A-weighting can be applied several times (report 13912)
- 13938: Input type: Xpod bridge, one channel 5 doesn't work if 1 activated
- 13767: Create a new unit : do not go on a "empty" windows, keep the previous configuration.


