Difference between revisions of "Advanced Swept Sine (A2S)"
| Line 23: | Line 23: | ||
So using pure sine excitation, large frequency spans are possible with linear or logarithmic progression. Advanced Swept Sine automatically takes care of settings as FFT frequency range, number of FFT lines, average size... | So using pure sine excitation, large frequency spans are possible with linear or logarithmic progression. Advanced Swept Sine automatically takes care of settings as FFT frequency range, number of FFT lines, average size... | ||
==Download== | |||
Download last version: V2.3.12 V056989 from march 2020 below | |||
https://orossas.sharepoint.com/:u:/g/support/EST9J3XgXWNDsd5yMPLJNawB6OHR00h-H_AwiCSi85N6eQ?e=OUMqHO | |||
Extract the file and launch the setup.exe. | |||
==Advanced Swept Sine Basics== | ==Advanced Swept Sine Basics== | ||
Revision as of 09:18, 26 June 2020
Advanced Swept Sine User's manual
Introduction
Traditionally transfer function of a system is measured using FFT based measurement with broadband excitation (as random noise or multi-sine). With only one average all frequency points of transfer function can be measured. Some limitations appear as:
- Transfer function frequency resolution is limited to FFT resolution,
- Excitation power is broadband and at each frequency line signal noise ratio can be poor with low coherence,
- No control of saturation and level on response,
- Ratio between lower and upper frequency is limited by number of FFT lines.
Swept sine technique (also called Servo Analysis, Network Analysis, or Swept Sine) automatically sweeps a sine wave over the frequency range of interest and measures the response frequency point by frequency point. Using a pure sine excitation optimizes measurement at each frequency step:
- Preventing overload,
- Measurement at any frequency
- High frequency ratio, combined with high frequency resolution,
- Fine control of level,
- Measurement time optimized with frequency,
- Excitation level depending of frequency,
- No error between frequency lines due to non-linearity.
So using pure sine excitation, large frequency spans are possible with linear or logarithmic progression. Advanced Swept Sine automatically takes care of settings as FFT frequency range, number of FFT lines, average size...
Download
Download last version: V2.3.12 V056989 from march 2020 below https://orossas.sharepoint.com/:u:/g/support/EST9J3XgXWNDsd5yMPLJNawB6OHR00h-H_AwiCSi85N6eQ?e=OUMqHO
Extract the file and launch the setup.exe.
Advanced Swept Sine Basics
General processing Description
In Advanced Swept Sine, for each frequency point of transfer function:
- First, sine generator sweeps smoothly to target frequency.
- Then Advanced Swept Sine waits for a user-defined fixed or frequency dependant delay in order to guarantee stabilization of system under measurement.
- And finally using selected lines from an averaged cross-FFT measurement; transfer function for this frequency point is computed and saved. FFT average time can be either fixed or frequency dependant.
Optionally Advanced Swept Sine can adjust and limit generator output level in order to get either predefined or limited level at input and output of system under measurement. Level can be frequency dependent, for example to adjust displacement on a shaker at each frequency.
Spliting measurement into spans
A complete measurement frequency range can be broken into up to 8 separate frequency spans; this multi-span capability is useful, for example, to define different frequency step sizes on the whole frequency range or to adjust excitation level on different frequency ranges.
A measurement can be processed with frequency increase or decrease and possibility to skip any span.
Measurement technique and accuracy
Swept sine technique has been introduced in 80's based on time domain for processing and time domain integration of signals, but this technique is sensitive to harmonics. Some other systems are based on a tracking filter, but with a lack of bandwidth control on large frequency spans.
OROS Advanced Swept Sine is based on FFT processing with careful designed algorithms. This FFT processing provides no sensitivity to harmonics and provides adaptive bandwidth measurement with frequency.
FFT frequency range is automatically adjusted during the measurement in order to get optimum resolution and averaging time. Averaging time can be set as a number of periods of excitation signal, so more time can be spent at low frequencies and less time at high frequencies.
In the worst case, maximum error on transfer function, due to OROS measurement technique, is lower than 0.012 dB on magnitude response and 0.02° on phase response at any measurement frequency. This is a repeatability error to add to OROS 3-Series analyzer precision (typical 0.05 dB and 0.05° see product specification).
Measurement frequency can be set between 0.01 Hz and 40 kHz. Absolute frequency resolution of generator is better than 0.00002 Hz.
Boosted measurement mode
BOOSTED mode lowers measurement time while preserving resolution. In many cases it is desirable to sweep over a large frequency range while detecting narrow features in the transfer function, with the consequence of a large number of frequency points and then a long measurement time.
The optional BOOSTED mode provides faster overall measurement by skipping measurement of successive frequency points with no significant frequency response changes. This boosted swept sine mode includes simultaneous monitoring of both amplitude and phase variations in order to be efficient with complex transfer function including many resonances and anti-resonances.
General smoothness
Advanced Swept Sine uses as generator the "Advanced sine output signal" available in NVGATE. This guarantees smooth transitions during frequency and amplitude changes.
During sweep to next frequency point, the instantaneous frequency changes at a user defined rate with no brutal phase, frequency variations. This method gives a better output signal smoothness than, for example, frequency change at signal zero crossing.
Amplitude variation is also controlled in the same way with user-defined duration for amplitude change.
Relative precision of generator frequency is better than 10-5 that means very closed frequency points can be processed with accuracy by Advanced Swept Sine.
General level control
For each frequency measurement the user defines a target level that can be frequency fixed or dependent. This target level can be used in 3 ways:
- As a generator output level,
- As a target level at system input under measurement (useful with actuator),
- Or as a target level at system output.
In the last two ways, for each frequency point Advanced Swept Sine automatically adjusts generator output in order to get target value with a user-defined tolerance. It stops adjustment after the user-defined maximum number of tries.
The Advanced Swept Sine also includes user defined signal level limitations at system input or output. If measured value is greater than defined limit Advanced Swept Sine automatically lowers target level value and retries frequency point measurement.
Level adjustment function associated with signal limiting function can help measurement, reducing input level at a resonance (or pole) to avoid non-linearity, or increasing level where there is anti-resonance (or zero) to get better measurement.
Multi excitations
For measurement on complex mechanical systems that need multi excitation with different amplitude or phase, the multi generator outputs of OROS 3-Series can be used.
Advanced Swept Sine implementation
The Advanced Swept Sine analyzer is a separate application controlling OROS 3-Series NVGATE software through standard NVDRIVE, the programming interface to NVGate.
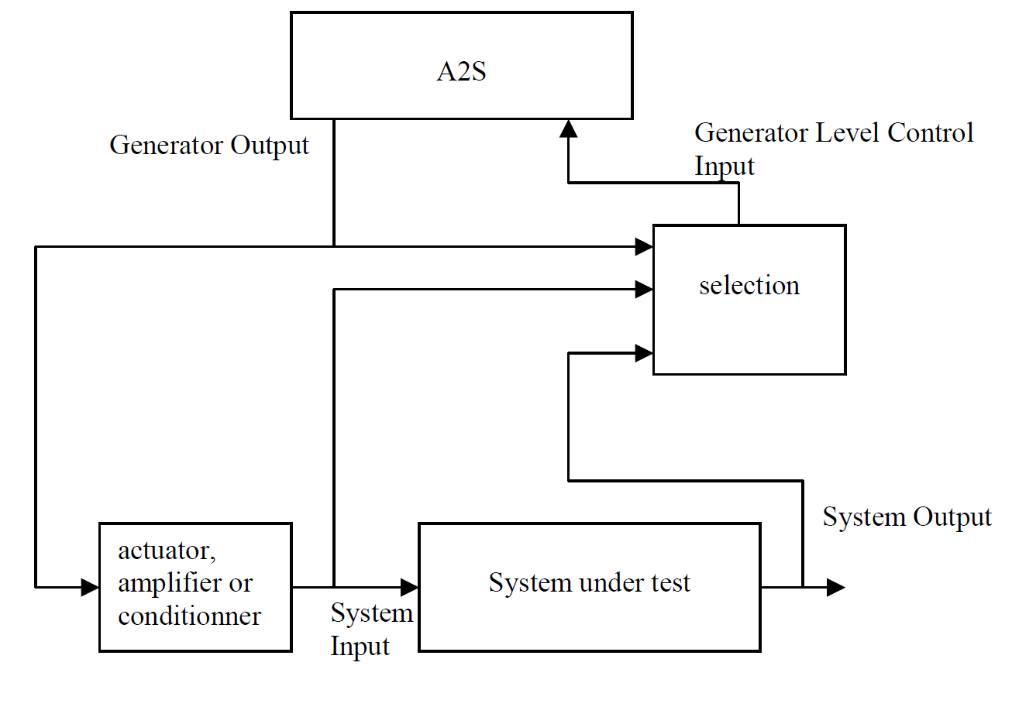
Measurement block diagram
On OROS 3-Series, output channel 1 is used for excitation, input channel 1 for input of system under measurement and is called excitation measurement and the user-selected input channel for corresponding output called response measurement. A selection of the number of response inputs is also available (see below).
OROS 3-Series advanced pure sine generator delivers excitation signal with smoothed amplitude and frequency variations. On excitation and response channels level measurement is obtained from FFT spectrum. These levels are used by amplitude control loop, which takes into account target level and user defined limitations.
Transfer function measurement at each frequency point is obtained from corresponding lines of FFT spectrum and cross spectrum measured by OROS 3-Series, average time being adjusted for each frequency point. When necessary the swept sine controller switches FFT frequency ranges in order to get optimum time measurement and bandwidth measurement.
Final transfer function is computed step by step by swept sine control and displayed, saved or exported thought NVGATE. During processing all relevant information including rejected measurements (for example during target level adjustment) are stored in a text log file for optional processing and full trace analysis.
An example could be done with multi-span
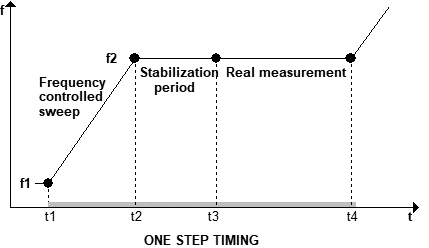
Basic measurement timing
For each basic measurement step we have the following timing:
- The generator frequency (and/or the amplitude) sweeps to the new value
- The analyzer waits for the system under measurement to stabilize. This delay is specified as a minimum time and/or a minimum number of sine periods. This delay can also be set down to zero.
- The analyzer does real measurement using averaging. The average time is specified as a minimum time (greater than 30 ms) and/or a minimum number of sine periods (greater than 10).
Starting Advanced Swept Sine
Warning: before starting Advanced Swept Sine, NVGate must be running.
Run: button for starting a measurement.
Pause/continue: button for manual pause measurement.
Stop: button for manual stop measurement.
Span: progress bar which indicates on which span is the current measurement.
Try: this shows the current try number for frequency point.
Progress: this bar is the evolution of the current measurement for the entire range frequency.
Menus options
Open
Open an Advanced Swept Sine project previously saved (.sws), this will load the settings of this project.
New
Open a new project with a default configuration.
Save/Save As
Using this menu to save settings of your current Advanced Swept Sine measurement and your project.
Note that to save results you may use the NVGate 'save results'.
Note: When the settings are saved in a file "file_name.sws", if the current project in NVGate is the default project the project would be automatically renamed as "SWS_file_name".
Exit
Close the Advanced Swept Sine solutions
Note: in all kind of graphs displayed, if one span is in mode 'log' then X-axis is displayed in log.
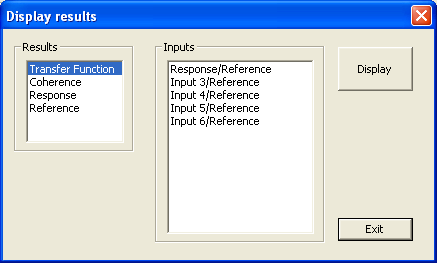
Select the results you want to display in the following window:
Results from the same group will be displayed in the same window.
Following graphs are just examples of the different graphs the user can display.
Transfer function
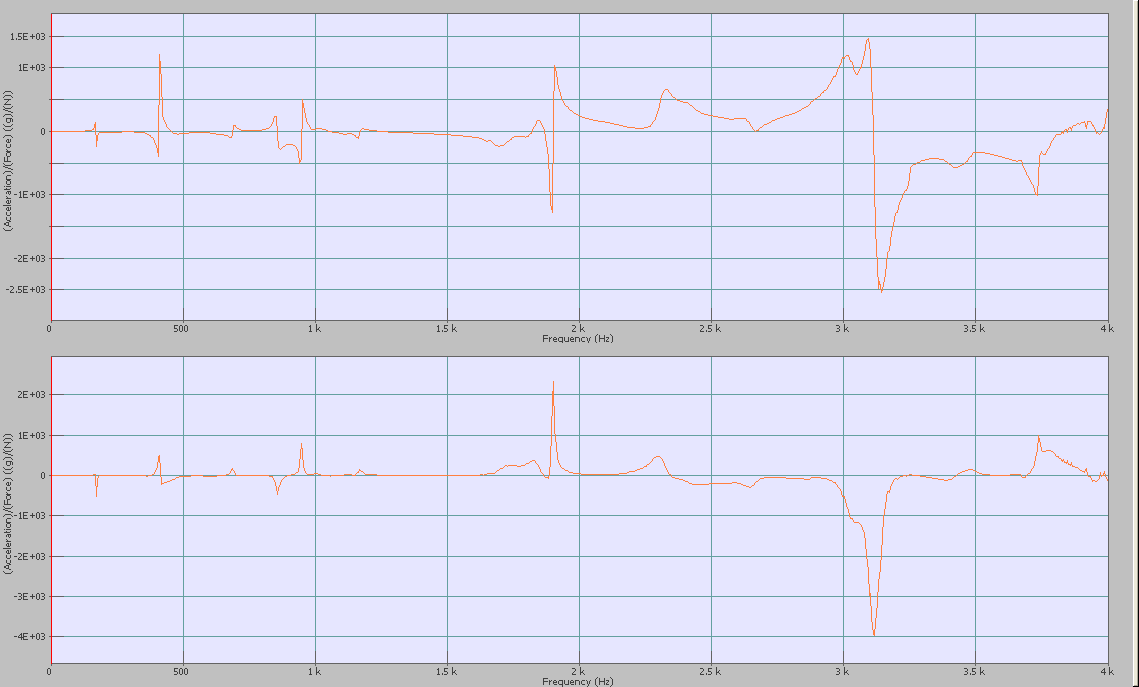
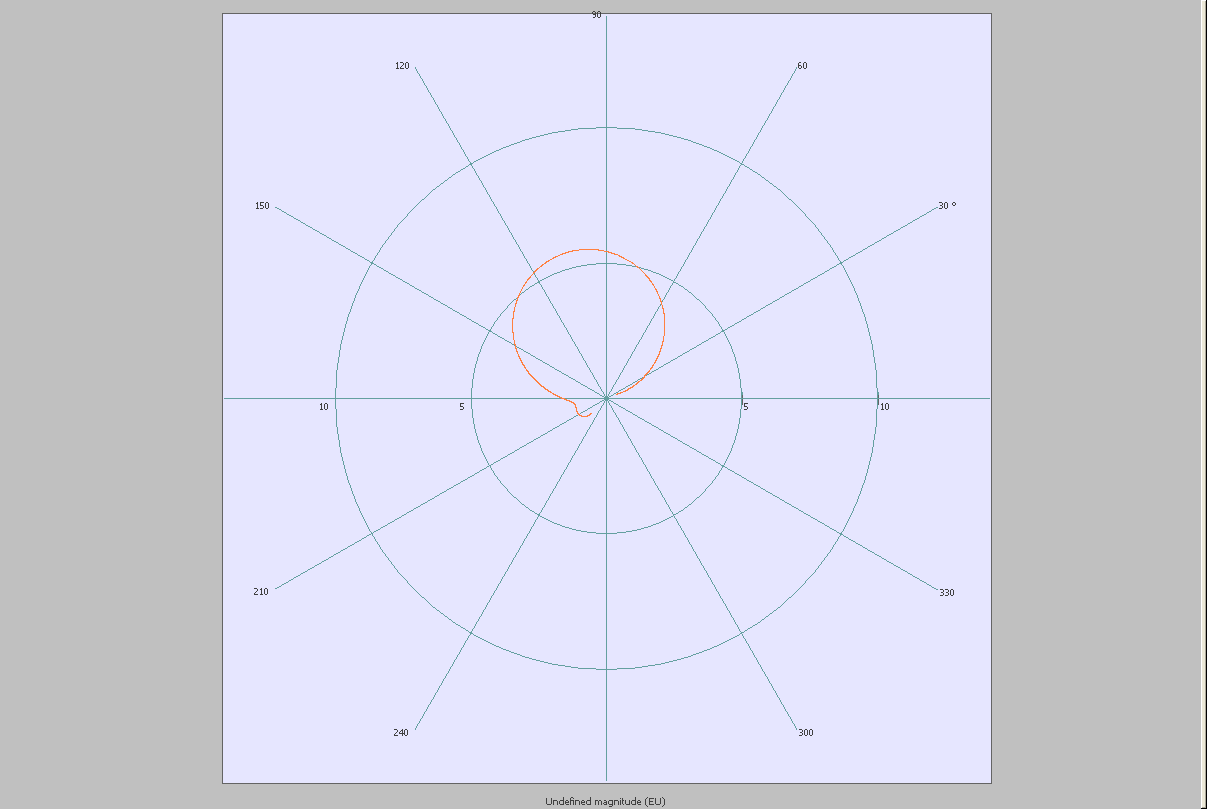
The transfer function could be displayed as following:
- Magnitude/Phase
- Real/Imaginary
- Polar
- Phase/Magnitude
- Merged Module/Phase
Coherence
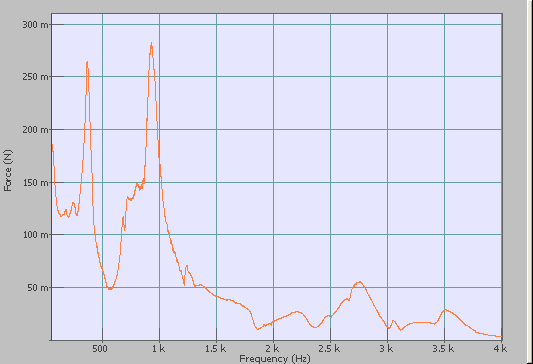
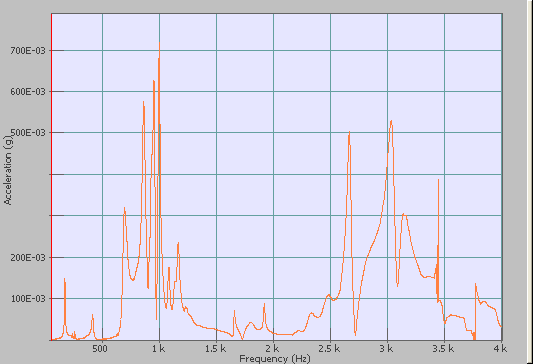
Measurement reference level
Measurement response level
Note: for all these type of graphs, all settings for the graph available in NVGate are also available with Advanced Swept Sine by right clicking on the graph or graph window.
Edit Settings
This menu is to edit settings of the Advanced Swept Sine measurement (see below for more information about each setting). Settings are not available for modification during a measurement.
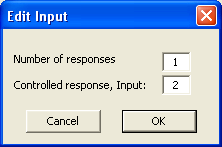
Edit Input
This displays the following window:
It is possible to select the number of response (depending of the hardware connected, that means this number of responses could be between 1 and 31).
The next setting is the number of the input the user wants to control. Note that the input 1 is not available because it is automatically the reference input.
By clicking on 'OK', the inputs properties will be displayed.
Editing and saving settings
Editing settings is available through menu "Edit" >> "Edit Settings"
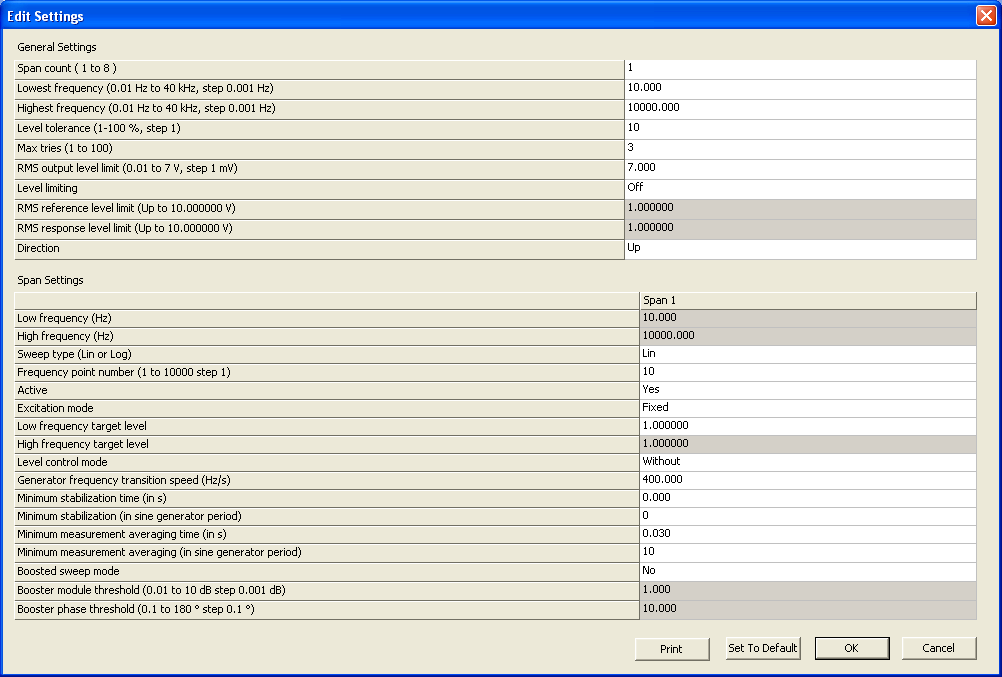
This command opens a new window displaying General Settings, applicable for all spans, in the upper part and Span Settings, specific for each span, in the lower part. :
General settings
The General Settings apply for all spans.
Span Count (from 1 to 8):
A complete measurement can be split into 1 to 8 separate frequency spans; this multi-span capability is useful, for example, to define different frequency step sizes on the whole frequency range or to adjust excitation level for different frequency ranges. The high frequency of a span always corresponds to the low frequency of the next span.
Lowest and Highest Frequency (from 10 mHz to 40 kHz, resolution 1 mHz):
These settings define the whole frequency range of the measurement. Frequency range can start as low as 0.01 Hz and go up to 40 kHz. Frequency input resolution is 0.001Hz.
Level tolerance (1 to 100%, resolution 1%):
This setting defines the allowed tolerance between the target level and the measured level, which validates one frequency measurement point.
Note: the level limiting function (if enabled) has always priority on level tolerance.
Max tries (from 1 to 100):
This setting defines for a frequency measurement point the maximum number of tries in order to reach target level or to be conformant with level limits.
Tips: We recommend to set this value at least at 3 in order to process measurements with either reference or response level control or active level limiting.
RMS output level limit (from 0.01 to 7 V, resolution 1 mV):
This setting fixes the absolute limit for the output level during the measurement. The maximum value of this setting is 7.07 V RMS corresponding to ± 10V peak on generator output (this value is also the default value).
Note: this limitation is active in any case and has the higher priority on other level control functionalities. In any case generator output level will never exceed this value.
Level limiting:
Level limiting function can also optionally be activated (ON) in order to guarantee that predefined levels are not exceeded at reference and/or response channel. If any measured level at reference or response channel is higher than its corresponding limit, the generator amplitude is decreased accordingly and a new measurement is processed.
Note: this function cannot guarantee that a level greater than user-defined limit will never appear. It guarantees that a transfer function point measurement is validated only if the measured level is below this limit.
Tips: this function is very useful when user wants to avoid a too large response level (with perhaps non linearity) due to a resonance when using constant excitation (and/or reference) level.
RMS reference level limit:
This setting defines maximum limit for reference level in order to validate a frequency point measurement. Active only if <Level limiting> is ON.
RMS response level limit:
This setting defines maximum limit for response level in order to validate a frequency point measurement. Active only if <Level limiting> is ON.
Note: In case the user want to use the level limiting only on reference (or on response), the level limit of the response (or of the reference) must be set to the maximum value.
Direction:
This setting defines if measurements are at measurement time processed from lowest to highest frequency (UP) or from the highest to lowest frequency (DOWN) In that last case, the measurement are processed in descending order of spans (from higher number to lower one).
Span settings
For each measurement span the following settings are defined:
Low and High frequency:
The ratio between high and low frequencies in a span must be greater than 1.0 and up to 10000. Frequency values can be lower than 0.01 Hz and up to 40 kHz with a resolution as low as 0.001 Hz.
Note: Only <High frequency> of each span (except the highest one) can be adjusted; modifying this frequency automatically adjusts <Low frequency> of next span to the same value. Low frequency of first span and high frequency of last span are set by general settings <Lowest and Highest Frequency>
Sweep type:
This setting specifies if the frequency steps for the span will increase in a logarithmic (ratio between 2 consecutive frequencies is constant as in a geometric progression) or linear fashion (difference between 2 consecutive frequencies is constant as in an arithmetic progression).
This setting defines the step between to measurement. The Log sweep gives more points in low frequency, and less point in high frequency, compared to Lin sweep. It is useful for giving a plot in which attenuation or gain of n dB/octave appears as a line.
Frequency point number (from 1 to 10 000):
This setting specifies the number in the span of measurement frequency points for transfer function. The real number of measurements can be higher as we can have adjustments for excitation level control and/or lower if BOOSTED mode is used.
Note: Large values produce higher frequency resolution at the cost of longer acquisition time. Boosted mode can be used to reduce measurement time.
Tips: Number of frequency point includes low and high frequency points. So, for example, to get frequency points from 200 Hz up to 800 Hz with 100 Hz linear spacing <Frequency point number> must be set to 7.
Active:
This setting let you the opportunity to skip the span during measurement. If set to NO the Advanced Swept Sine smoothly stops the generator at processing end of previous span and goes to process next active span starting smoothly the generator.
Tips: this capability can be used, for example, to redo transfer function measurements on a specific frequency range of interest.
Excitation mode:
For a measurement span the target excitation level can be set to a:
- Fixed level for whole span
- Variable with frequency during the span.
In this last mode, variation law with frequency between these 2 values is the same as defined in <Sweep Type>:
- Logarithmic, the target level versus frequency curve appears a straight line on a log/log display.
- Linear, the target level versus frequency curve appears a straight line on a lin/lin display.
Target levels are set by user in physical units (also called Engineering Units, EU). Physical unit depends of the selected control mode (see below).
Low frequency target level:
This setting defines the target level value in <Fixed> excitation mode and level for low frequency in <Variable> excitation mode
High frequency target level:
This setting defines the target level value in <Variable> excitation mode for high frequency.
Level control mode:
The excitation level can be controlled in 3 different modes:
- Without: amplitude of generator is set with no additional control to target level value at each frequency step (target level is in Volt, V).
- On reference: amplitude of generator is adjusted in order to get target value at the reference input (Physical unit of reference input is used for excitation level settings).
- On response: amplitude of generator is adjusted in order to get target value at the measurement input (Physical unit of measurement input is used for excitation level settings).
Note: Adjustment is applied if measured value at selected input is out of the bounds defined by the "Amplitude tolerance" global setting. In that case output generator amplitude is modified and a new step measurement is triggered at the same frequency. This adjustment is repeated if necessary; <Max tries> general setting limits repetition.
Note: Adjustment takes also into account <level limiting> if active.
Note: On 'reference' or on 'response' mode, for the first measurement generator Advanced swept sine has no information on actuator and/or system response to compute needed generator output level from user defined target level. So a first measurement is done with generator output level set to 1/100th of RMS output level limit and using measured levels, a new generator level is computed for next try in order to reach target level.
Generator frequency transition speed:
When a measurement point is available and stored, the generator smoothly sweeps to next frequency point measurement with a transition speed defined by this setting.
Minimum stabilization time (in s) and (in sine generator period):
When generator has reached frequency and amplitude level targets, the swept sine analyzer waits a user-defined time in order to guarantee stabilization of system under measurement. This time is defined as a minimum fixed time and as minimum periods of sine generator.
Tips: Stabilization time defined in sine generator periods is efficient for spans with large variation of frequency as the whole time measurement is lower than using constant stabilization time based on lower frequency.
Minimum measurement averaging time (in s) and (in sine generator period):
These settings define the minimum averaging time for transfer function measurement after stabilization delay. A higher time gives better precision in case of noisy signals giving a low coherence.
The minimum measurement averaging time is 30 ms or 10 periods of generator, which is greater.
Boosted swept mode:
In order to speed up measurement with large number of points, Boosted mode skips over frequency measurement steps with small variations in the transfer function.
Boosted mode examines differences in amplitude and phase between the current measurement point and the previous one. If these differences are within the user-defined thresholds, the sweep will continue taking larger steps and so skipping measurement points.
If differences in amplitude and phase are greater than user defined thresholds, the number of skipped points is halved and the current frequency point is moved back and a new measurement is processed.
The transfer function of skipped frequency points is computed using interpolation between two real measurements whose differences are within defined threshold.
With this adjustable algorithm, the number of skipped points can vary between 2 and 16 giving large decreases in whole measurement time (dependent of transfer function).
Booster module and phase thresholds (from 0.01 to 10 dB with resolution of 0.001 dB for the module, and 0.1 to 180° with resolution of 0.1° for the phase):
These 2 settings are used in BOOSTED mode to define limits on amplitude and phase variations, which enable skipping points.
This Boosted mode with both module and phase threshold is a guarantee that no points would be lost and all resonance and phase change would detected.
Example on how works the boosted mode:
- The measurement start at point 1. Then point 2 is measured.
- If the difference (in term of amplitude and phase) between values of point 1 and 2 is under the user-defined threshold, the next measurement point would be point 4. In other case it will be point 3.
- Point 4 is measured, if the difference between values of point 2 and 4 is under the user-defined threshold, the next measurement point would be point 8 and point 3 is interpolated. In other case the measurement go back and point 3 is measured.
- Point 8 is measured, if the difference between values of point 4 and 8 is under the user-defined threshold, the next measurement point would be point 16 and points 5, 6 and 7 are interpolated. In other case the measurement go back and point 6 is measured and if the difference between point 4 and point 6 is under the user-defined threshold, next measurement point would be 8 (the previous step is still available), if not point 5 is calculated then measurement go to point 7.
- Point 16 is measured, the same comparison is made to know if next point is 32 or if some points between 8 and 16 need to be calculated.
- …
Note: in any case no point would be measured twice, that means that it is really an optimization in term of time measurement without any risks of loosing points.
Details on measured or interpolated points are available in the log file. Note that the interpolated points have no FFT settings associated (the corresponding settings are set to"0" in the log file).
NVGate settings
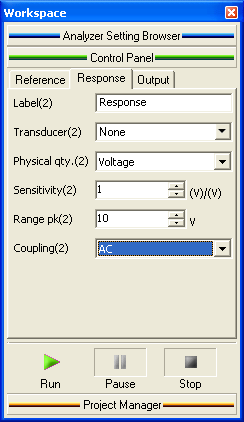
Some settings on inputs can be modified using NVGATE. Advanced swept sine configures automatically NVGATE control panel with 3 tabs, the first for the reference input, the second one for the response input and the last one for general settings.
The following settings are the default setting automatically displayed in NVGate when starting Advanced Swept Sine.
- Inputs 1 and 2 are connected on Channels 1 and 2 of the FFT plug-in.
- Cross-Spectre channel 2/channel 1 authorized.
- Weighting windows: Hanning
- Advanced sine 1 on output 1 is enabled:
- Mode = Pure Tone
- Synchro = Free run
- Peak Level = 0 V
- Freq = 0 Hz
- Mute = On
- Stabilization time = 0 (time delays are managed in the FFT plug-in)
- Amplitude variation = 1s
- Phase speed = 30 ms Rad/s
- Gain = 0
- Phase offset = 0
- Output 1 transition time =10 ms
These settings ensure that there is no output signal from NVGate, in order to protect any output connected through NVGate (for example a shaker).
- Saving option: set to 'Do not save', in order not to save each point of the Advanced Swept sine measurement.
- In the FFT plug-in:
- Average type: Linear
- Trigger: Pure Tone stabilized
- Overlap = 75%
- Number of lines: 401 lines
- Zoom factor: none (i.e. zoom set on off)
In the control Panel 3 tabs have been added with several settings of NVGate.
- Reference and Response: Input 1 is called 'Reference' and Input N (N is the number of the input selected by the user) 'Response' and this two tabs displayed settings of these inputs. Between brackets is displayed the number of the input corresponding.
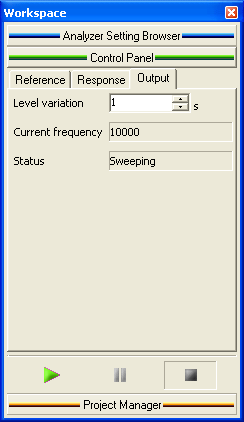
- General settings:
- Level variation: this setting in second represents the transition time from a level to another level.
- Current frequency: this status is the current frequency of the generator output.
- Status: this indicates if the generator is 'running up' (i.e. the generator is waiting to reach the level) or 'sweeping' (i.e. the generator is in service).
Saving settings
Settings of Advanced Swept sine measurement are save through Advanced Swept sine, using Save or Save as from the File menu.
Settings are saved with the extension .sws.
Note: When the settings are saved in a file "file_name.sws", if the current project in NVGate is the default project the project would be automatically renamed as "SWS_file_name".
Measurement storage
Saving results in NVGate
As for any NVGate project you can save the results using the 'save result' menu.
Log file description
A new log file is written automatically at each new measurement, this log file has the same name than the settings file (.sws) used or 'default'. The previous log file will be renamed with the same name with the extension "_old" in order to compare two successive measurements (not more, to compare more measurements the user must rename .los files). This file includes all information on each step measurement in text format (can be imported into EXCEL). This file is located in corresponding 'OROS Advanced Swept Sine' directory, that is to say in the "LOG" file of installation, and the extension is .los.
Tip: there is a shortcut in menu 'Start' then 'All programs' called 'OROS Advanced Swept Sine' then 'Advanced Swept Sine Log Files'.
Measurement examples
Modal measurement
This example is based on a shaker measurement. The aim of this measurement is to define a specific mode of vibration of the structure (resonant frequencies, deflection shape…)
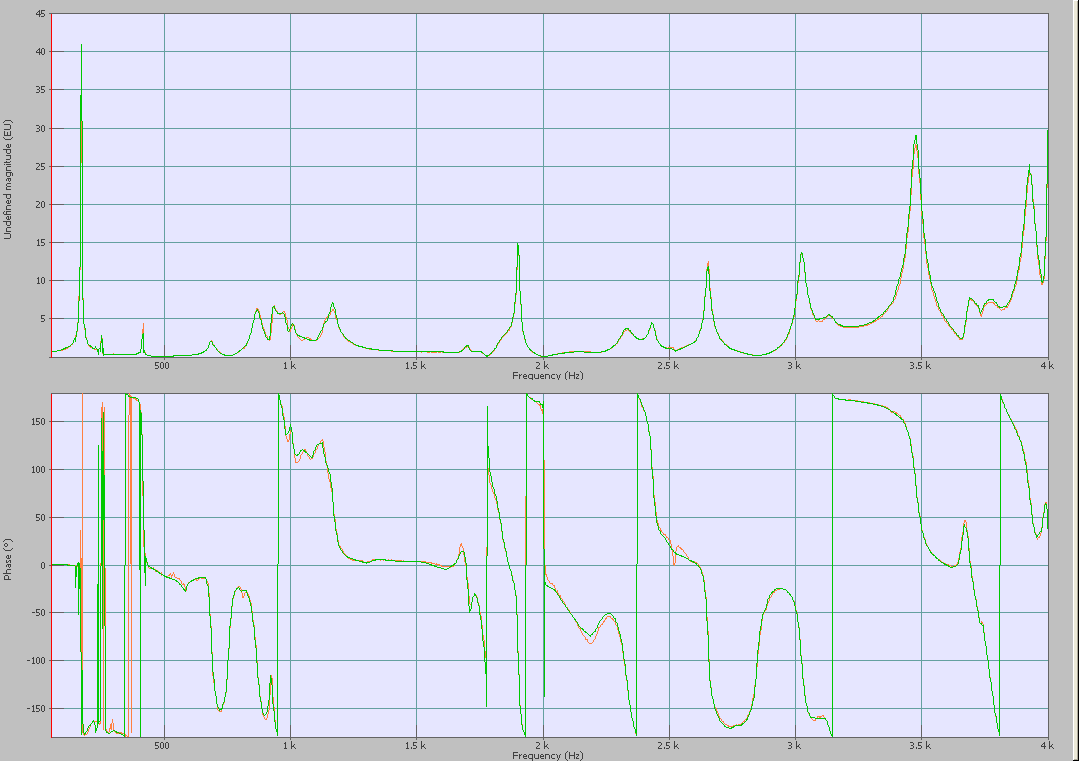
Input 1 is the reference (force sensor) and Input 2 is the response (accelerometer). The shaker is on an output. The Advanced Swept Sine displays Function transfer (magnitude and phase) in order to determine resonance and phase change.
A first measurement has been made without boosted mode (orange trace)
Time of measurement (extract from the log file):
| 1600 measured points - 0 interpolated points | ||
| End Time:06/23/05 16:45:10 | ||
| Duration: 00:24:19 | ||
| Termination: Normal | ||
Next measurement has been done with the boosted mode active (to optimize time measurement) in exactly the same situation (green trace)
Boosted module threshold of 5 dB and boosted phase threshold of 10°.
Time measurement (extract from the log file):
| 532 measured points - 1068 interpolated points | |||
| End Time:06/23/05 16:03:49 | |||
| Duration: 00:07:53 | |||
| Termination: Normal | |||
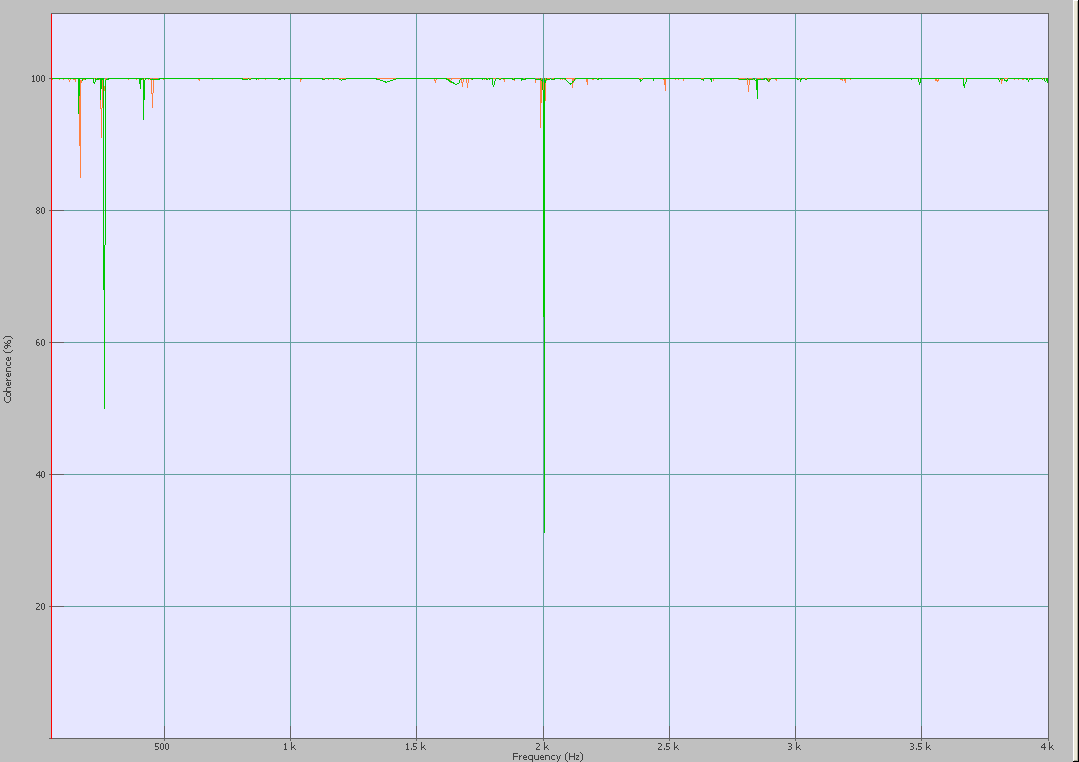
No visible difference in the coherence function
The transfer function is displayed on the same graph for both measurements in order to compare the accuracy.
The displayed result shows that the accuracy of the measurement is as good as without the boosted mode. The phase and module graphs are similar than for the previous measurement. No points are missing and the interpolation of some points is really closed to the measurement itself.
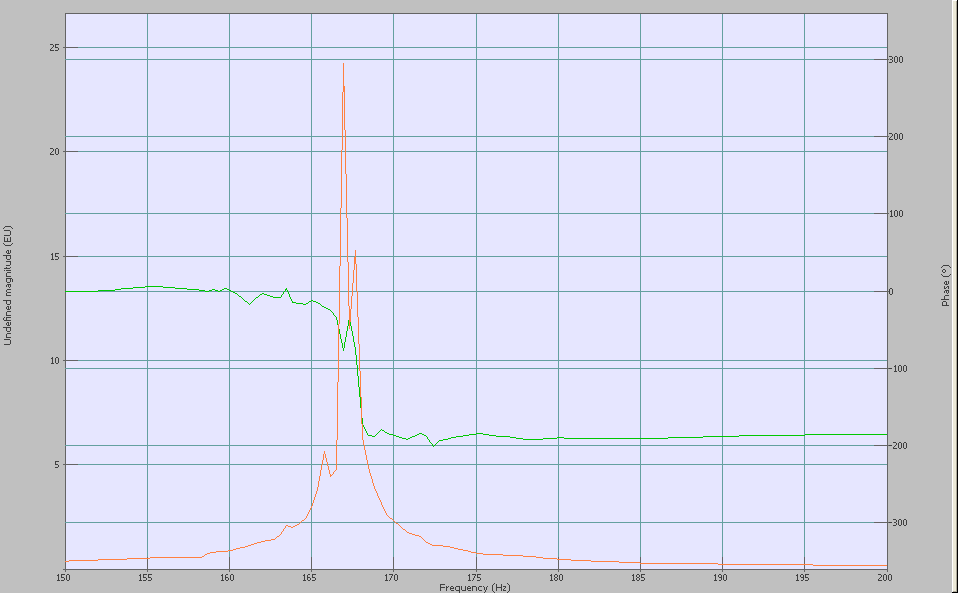
After it is possible to focus on a specific frequency bandwidth to determine a resonant frequency:
Acoustic measurement
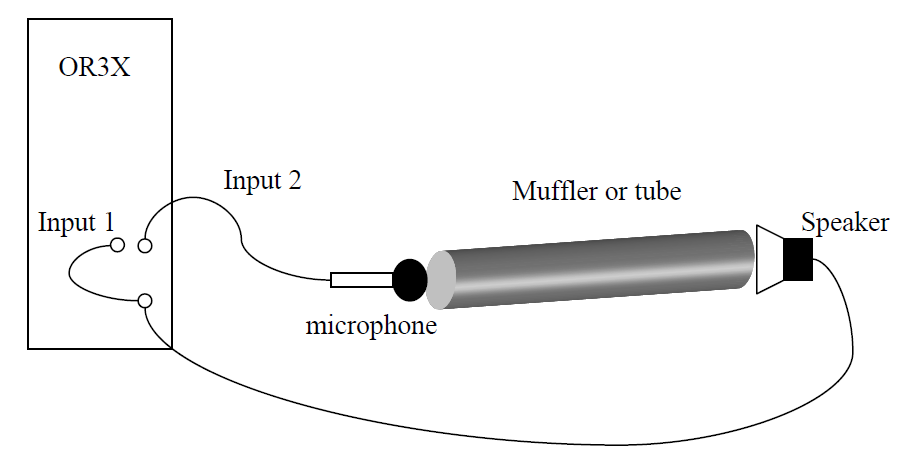
This example is based on a muffler; the aim of this measurement is to define resonance and anti-resonance in order to determine resonance and frequencies absorbed by the muffler.
| Out |
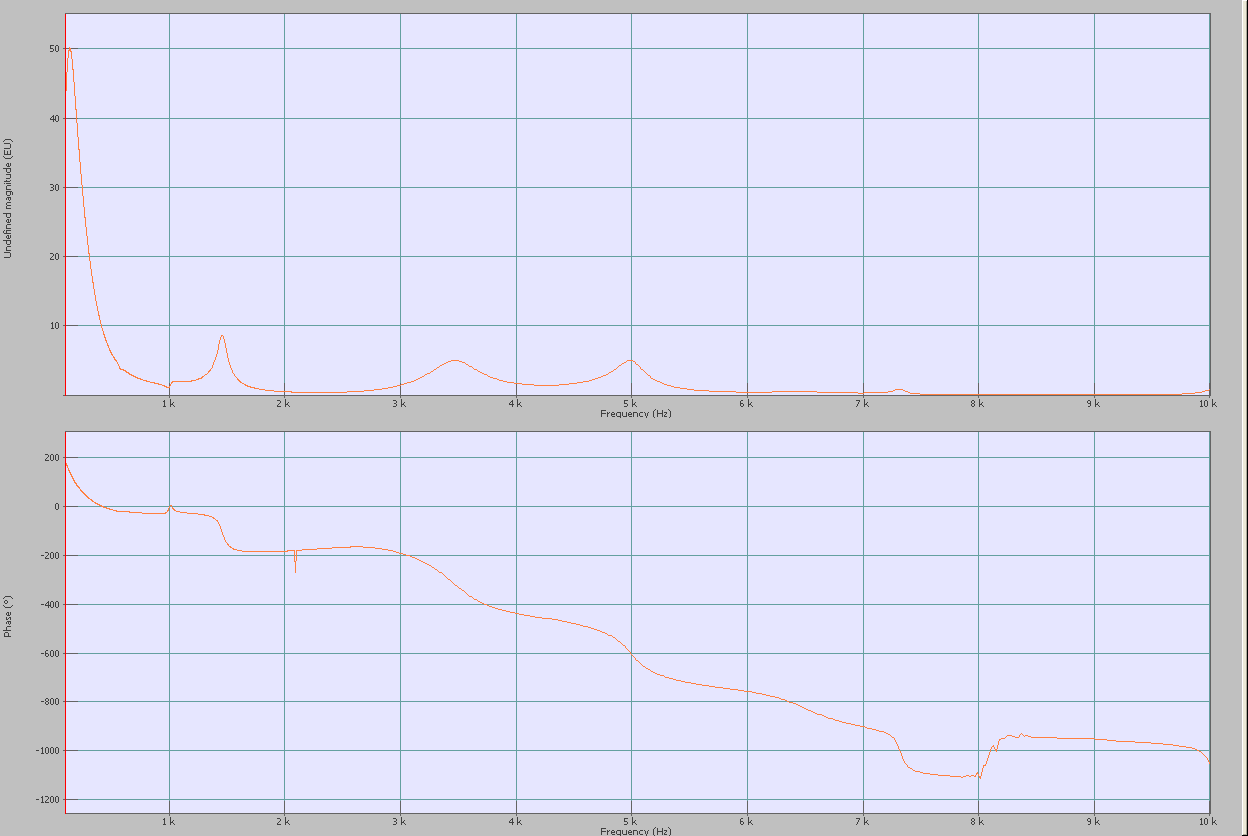
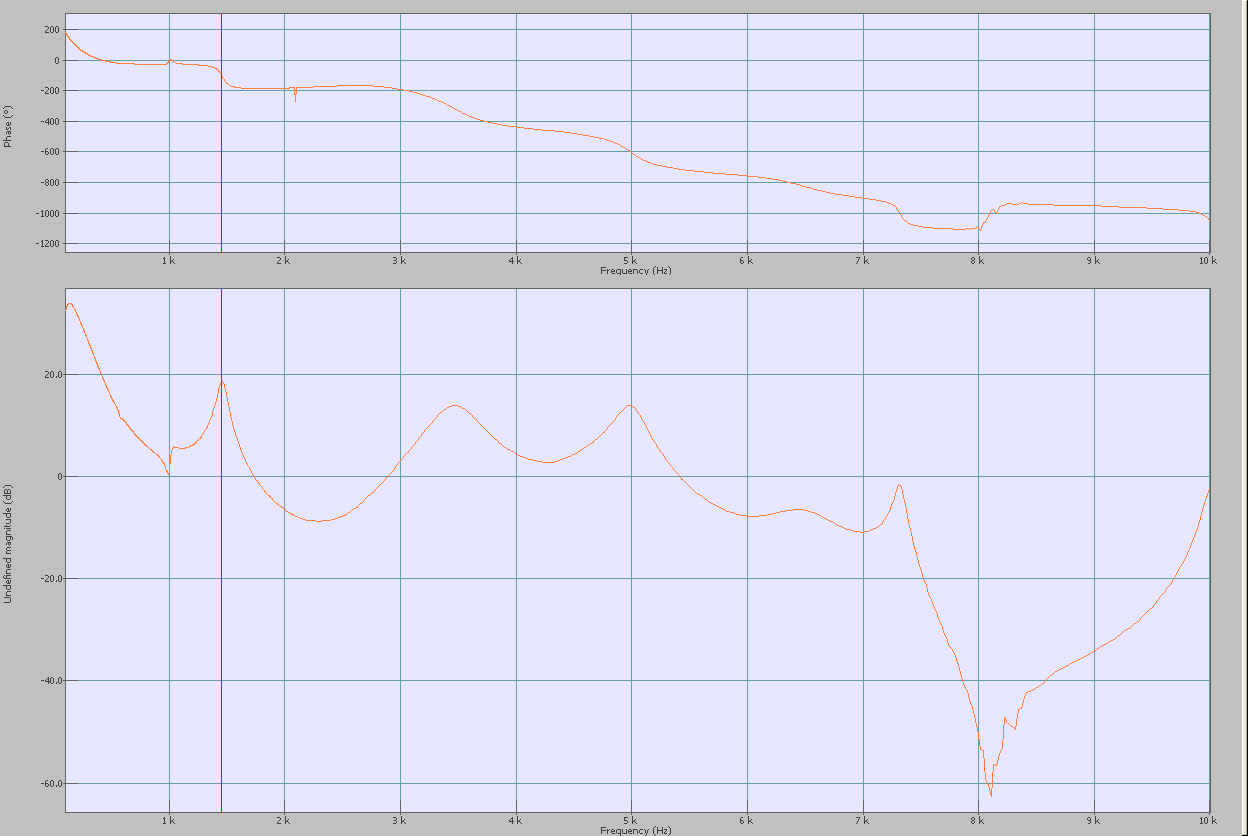
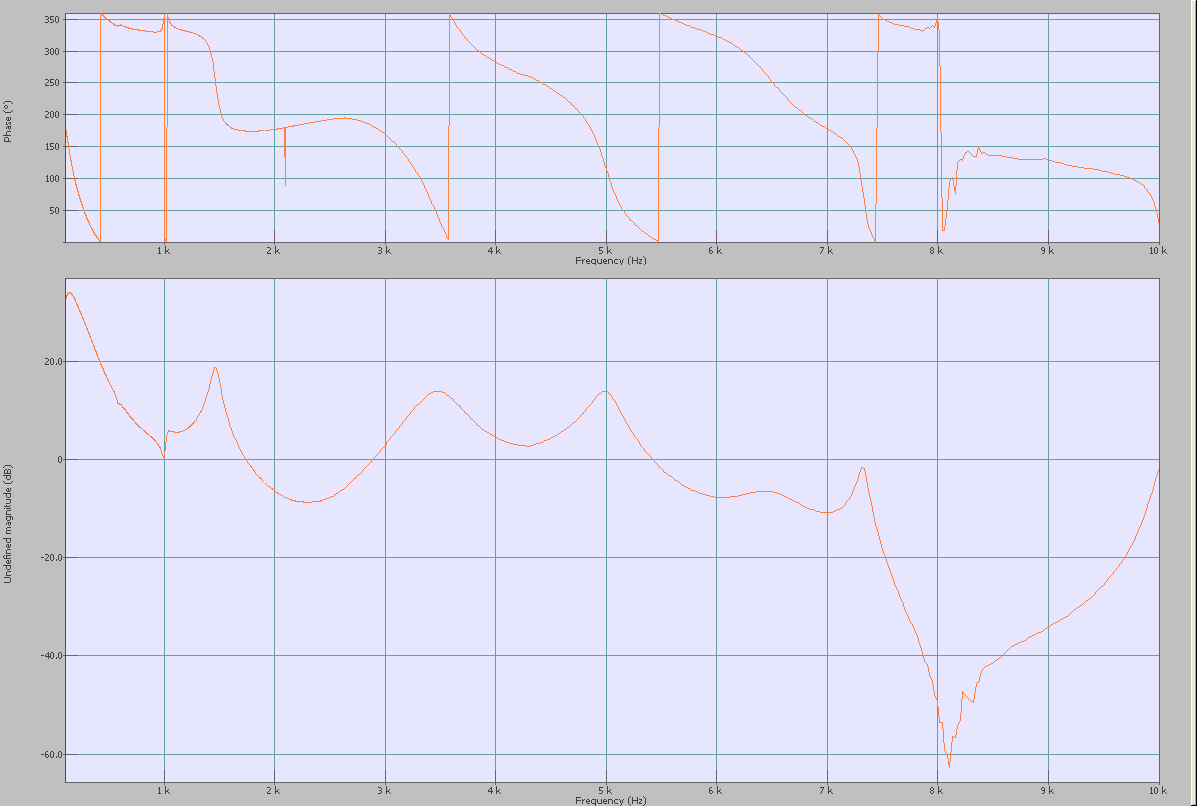
First measurement is an overview on the bandwidth 100 Hz to 10 kHz in order to determine resonances and anti-resonances.
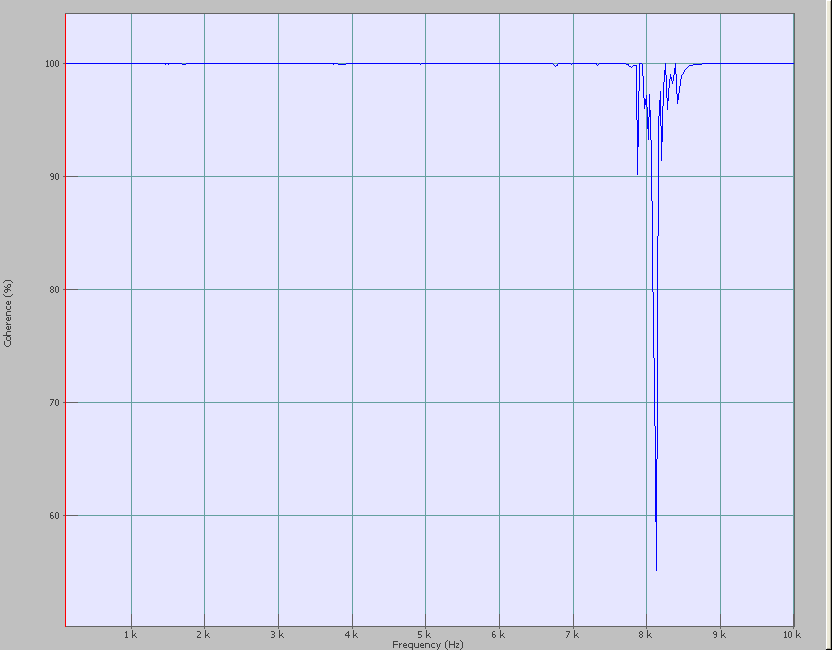
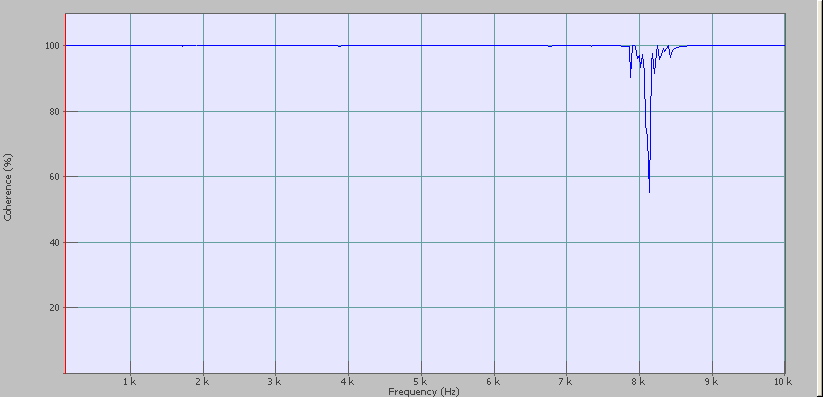
The coherence and the transfer function have been displayed
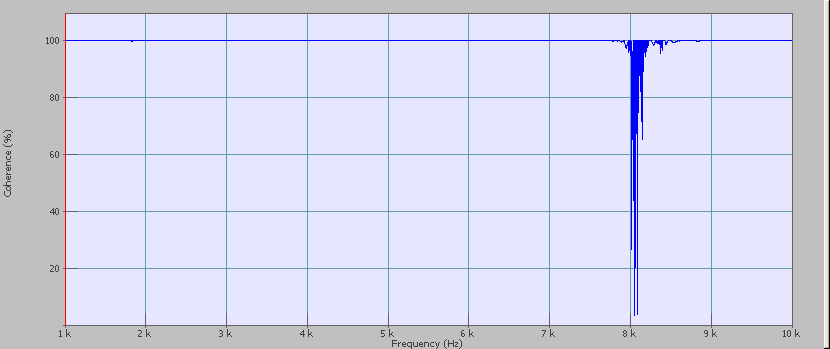
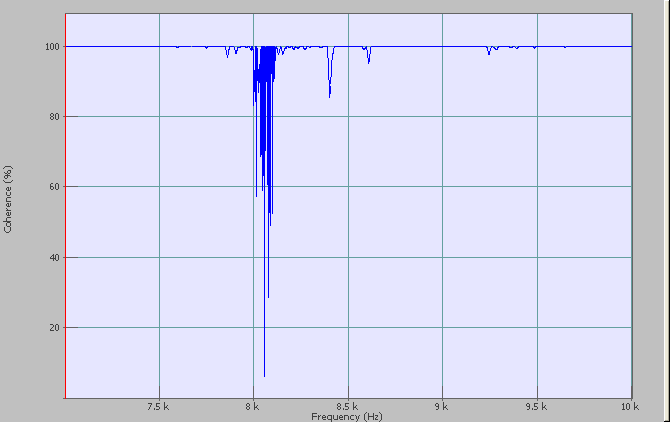
The coherence drop defines an anti-resonance around 8 kHz.
We can notice a resonance around 1.5 kHz.
In order to visualize properly these two phenomena, we use a multi-spans measurement with more points around interesting frequencies.
The measurement is split in 4 spans:
- 100 Hz to 1 kHz (non active)
- 1 kHz to 2 kHz (active)
- 2 kHz to 7 kHz (non active)
- 7 kHz to 10 kHz (active)
Spans where nothing interesting occurs are not activated in order to decrease time measurement.
Following results correspond to these settings.
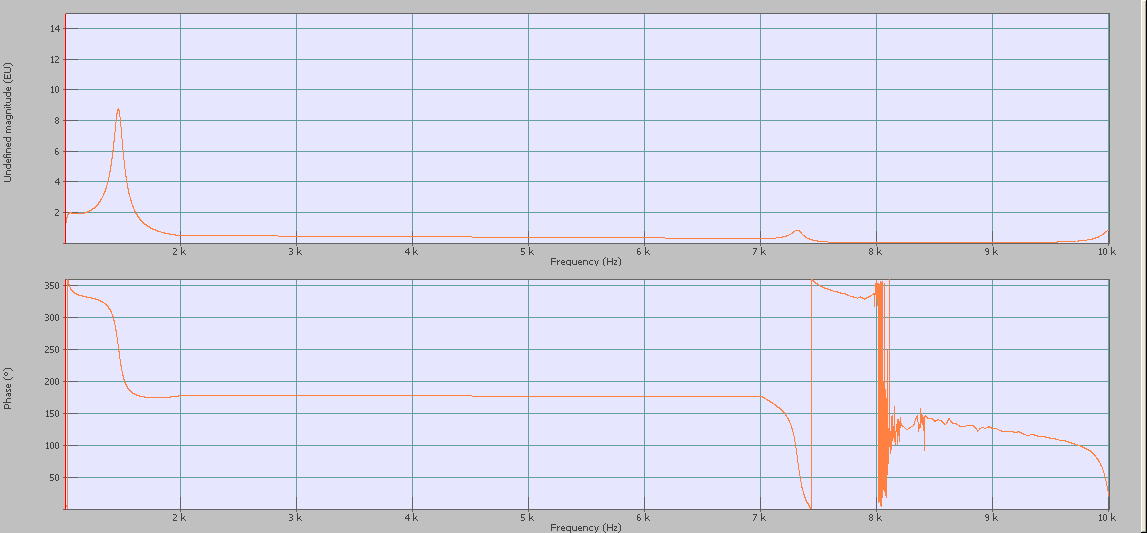
The transfer function is displayed in Magnitude/Phase:
The change of phase is significant around the resonance (i.e. around 1.5 kHz) and at this frequency we can notice the magnitude of the transfer function.
For the anti-resonance it must be around 8 kHz, and this is confirmed on the coherence graph below with a significant coherence drop.
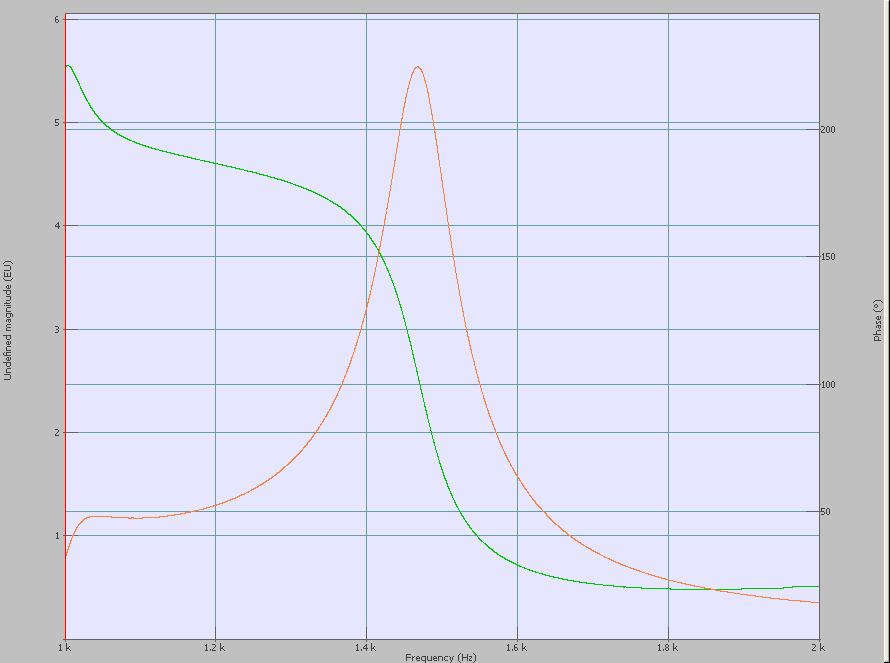
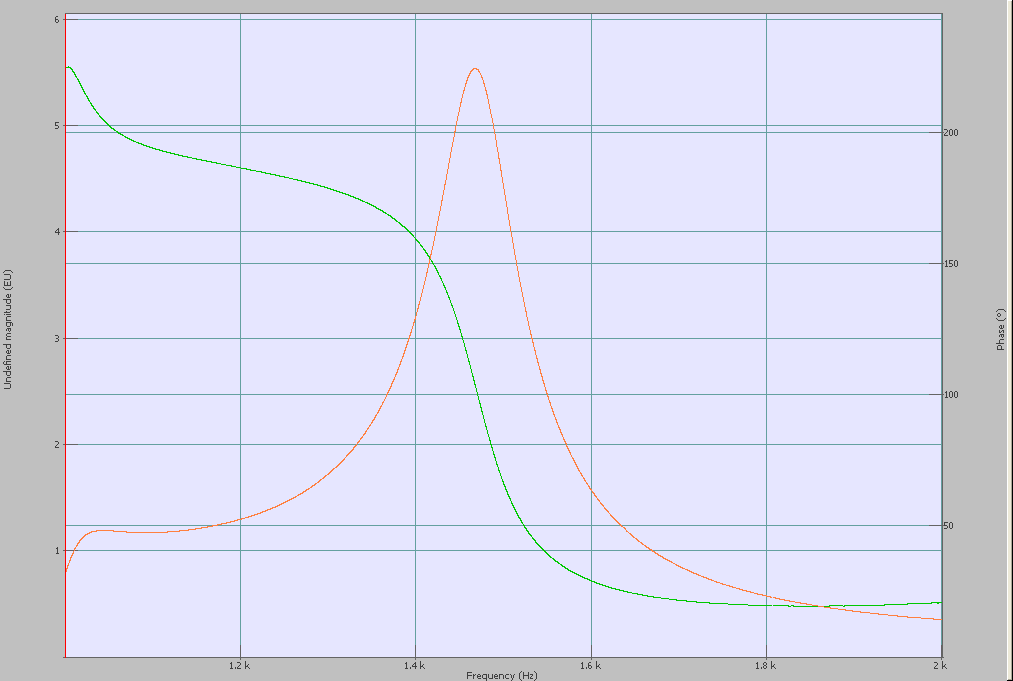
Then to see specific results on each phenomenon, two measurements have been done: one on the resonance (between 1 kHz and 2 kHz with 6 000 points) and another one on the anti-resonance (between 7 kHz and 10 kHz with 4 000 points). This could be done during the same measurement using the multi-span defined on each interesting zone. With a zoom through NVGate the following graphs could be displayed:
- Resonance (between 1 kHz and 2 kHz):
We can clearly see the resonance with the change of phase on a 'Merged Magnitude/Phase' graph.
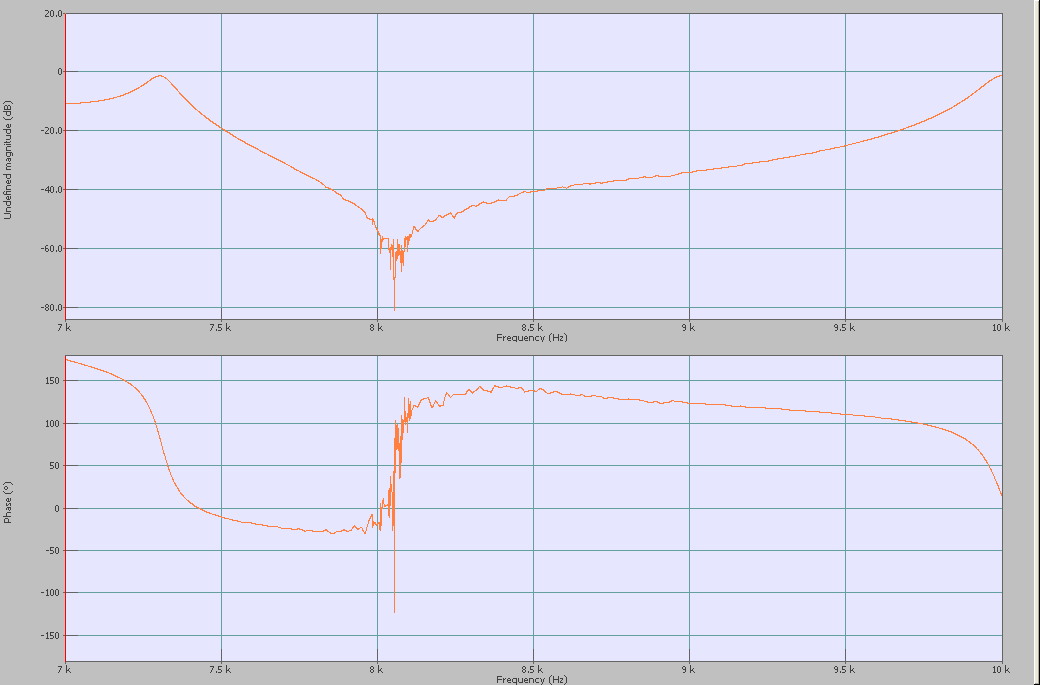
- Anti-resonance (span between 7 kHz and 10 kHz):
On this part we can see the anti-resonance on both graphs in order to determine the frequency absorbed by the muffler.
Note: these two examples are quite basic, but it is also possible to control the level on the response and/or on the reference with the level limiting of the Advanced Swept Sine solution.
Specifications
| Frequency range | 0.01 Hz to 40kHz |
| Frequency resolution | 0.00002Hz |
| Max number of points | 80 000 points |
| RMS level output | 10mV to 7V |
| Output level control | fixed, on response or on response |
| Sweeping type | lin or log |
| Sweeping mode | up, down |
| Sweeping speed controls | stabilization time, transition speed, averaging per point |
| Sweeping optimization | boosted mode |
| Results | spectra, FRF (magnitude & phase; real & imaginary), coherence, polar |
| Amplitude accuracy | 0.017 dB |
| Phase accuracy | 0.07° |
