Difference between revisions of "ORBIGate Phase Measurement"
(Created page with " <font size = "4">'''PHASE MEASUREMENT'''</font> <font size = "4">'''and'''</font> <font size = "4">'''POLAR DIAGRAMS in ORBIGATE'''</font> '''Contents:''' ==Introduction=...") |
|||
| Line 1: | Line 1: | ||
<font size = "4">'''PHASE MEASUREMENT'''</font> | <font size = "4">'''PHASE MEASUREMENT and POLAR DIAGRAMS in ORBIGATE '''</font> | ||
The phase measurement is used most commonly to position the unbalance. A corrected result, based on the phase measurement should be given so to be able to locate the unbalance rapidly. This can be done using the slot in the shaft as a reference. | The phase measurement is used most commonly to position the unbalance. A corrected result, based on the phase measurement should be given so to be able to locate the unbalance rapidly. This can be done using the slot in the shaft as a reference. | ||
Revision as of 08:55, 22 June 2020
PHASE MEASUREMENT and POLAR DIAGRAMS in ORBIGATE
The phase measurement is used most commonly to position the unbalance. A corrected result, based on the phase measurement should be given so to be able to locate the unbalance rapidly. This can be done using the slot in the shaft as a reference.
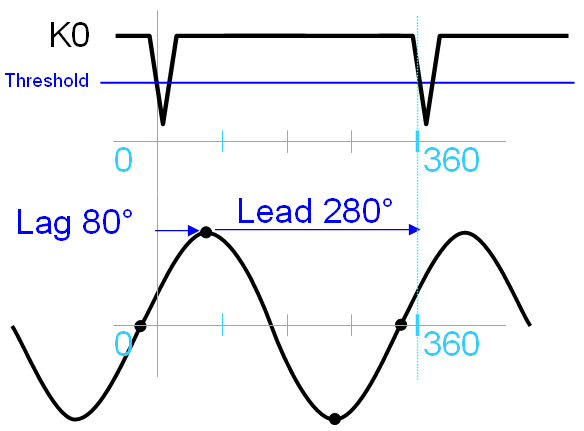
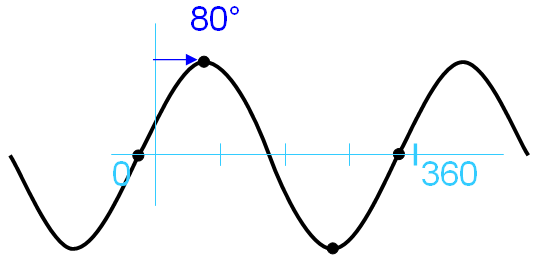
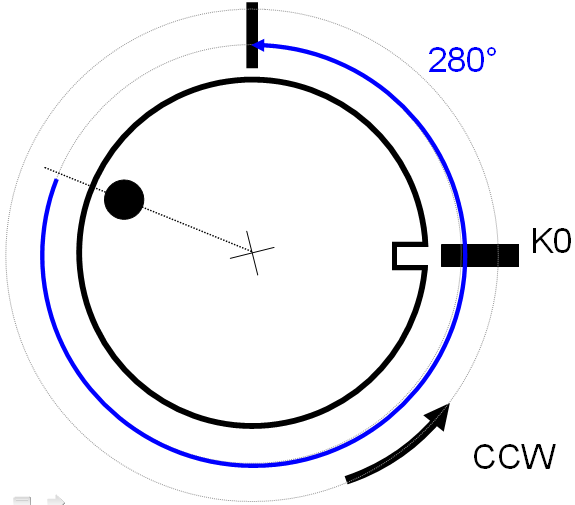
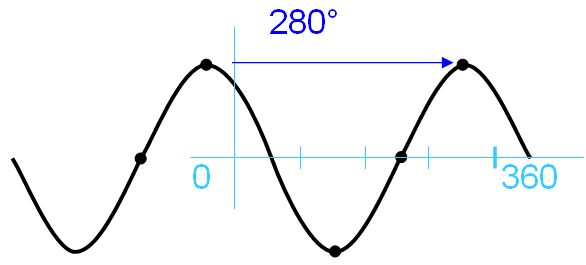
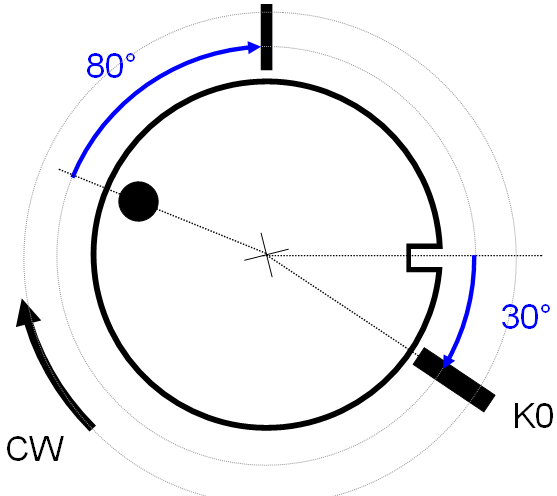
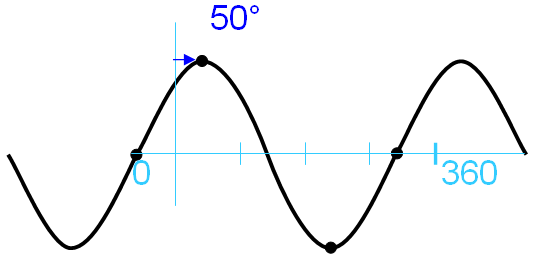
First, we'll go through the parameters influencing a phase measurement. A phase result is obtained as displayed in figure 1: It represents how late the signal (for a particular frequency) is seen by the sensor (for example a proximity probe) after the slot has passed by the keyphazor probe. The frequency considered here is the rotating speed (1X).
Figure 1. 1X phase measurement
Phase Measurement
Lag / Lead convention
Phase is used to compare the timing of two events in different signals. If an event occurs later in time than a reference event, then it lags the reference event. Similarly, if an event occurs before the reference event, then it leads the reference event.
- The convention used in most vibration measurement is to measure phase LAG with a positive number, sometimes called positive phase lag. On the opposite a usual mathematical definition would give a negative sign to a LAG and a positive sign to a LEAD. We'll stay focus on the usual mechanical convention showing a LAG with a positive number. ORBIGATE uses the phase lag convention and gives a positive value for the phase lag.
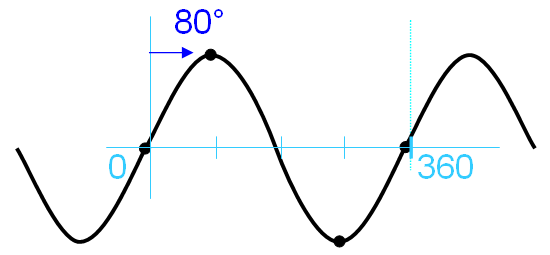
For example, let's take the vibration signal shown in the figure below. The spike in the Keyphasor provides the timing reference. The event of interest is the first positive peak of the vibration signal that occurs after (to the right of) the Keyphasor event. Because the first positive peak occurs after the Keyphasor event, the time delay between the two events is referred to as the phase LAG.
Figure 2. Lag / Lead convention
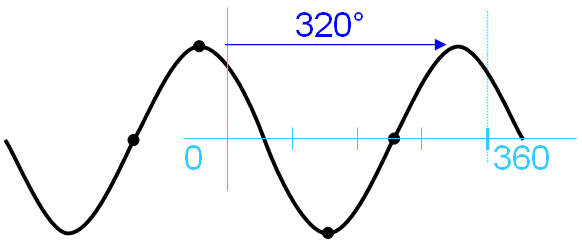
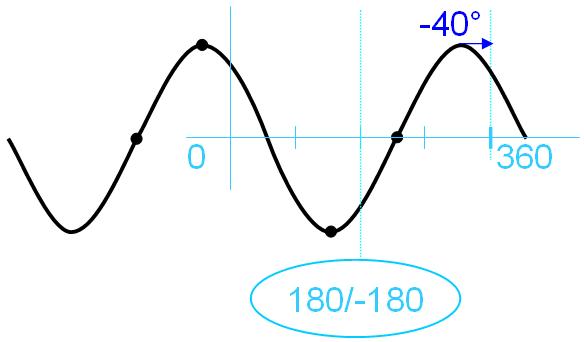
A phase LAG between 180° and 360° is SOMETIMES CALLED a phase LEAD, and could be expressed as a negative number between -180° and 0°. We will look at this convention in the following chapter ("2.2 0/360 or -180/180").
0°/360° or -180°/180° convention
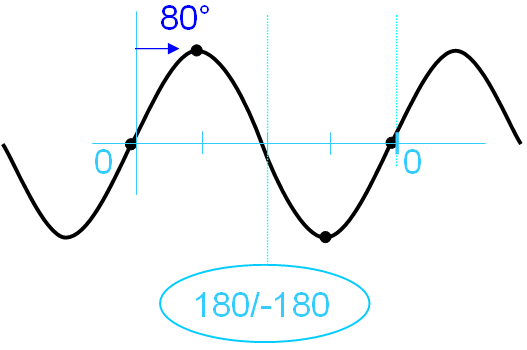
The convention -180°/180° shows the phase with a negative sign when the lag is larger than 180° as displayed in the figure below:
| Small Phase LAG (<180°) | Large Phase LAG (>180°) | |
| 0°/360° |
| |
| -180°/180° |
|
Figure 3. 0°/360° or -180°/180° convention
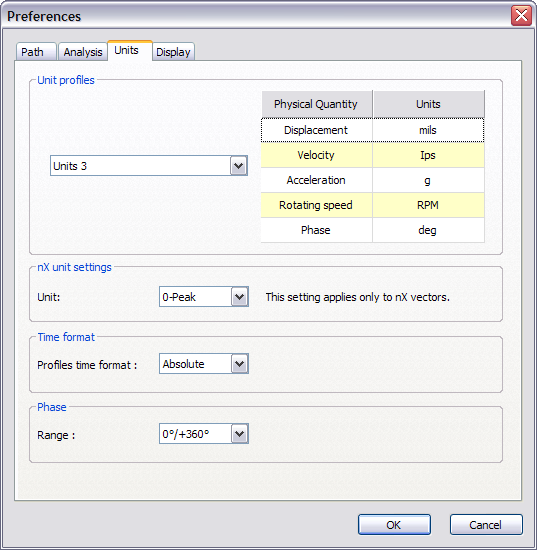
By default, the 0/360° convention is used.
Figure 4. 0°/360° or -180°/180° convention
Rotation Direction (CW /CCW) influence
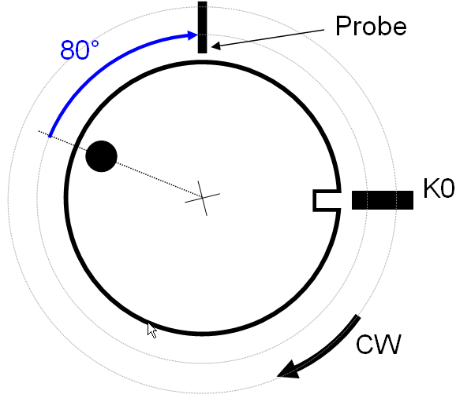
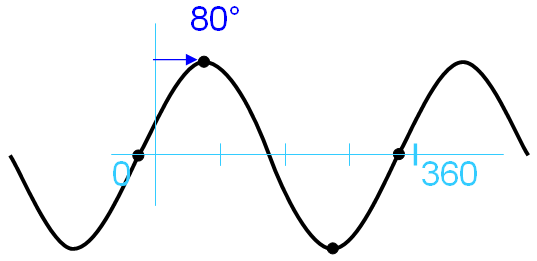
Changing physically the rotation direction of the machine changes the phase measurement.
| Physical Phenomena | Measured signal | |
| CW | ||
| CCW |
Figure 5. Machine rotating CW or CCW give different results
Keyphasor position influence
The phase result depends on the Keyphasor position (more exactly on the angle between the Sensor and the Keyphasor). It can be clearly seen from the figures below.
| Physical Phenomena | Measured signal | |
| Position 1 |
|
|
| Position 2 |
|
Figure 6. Different Keyphasor positions give different phase results
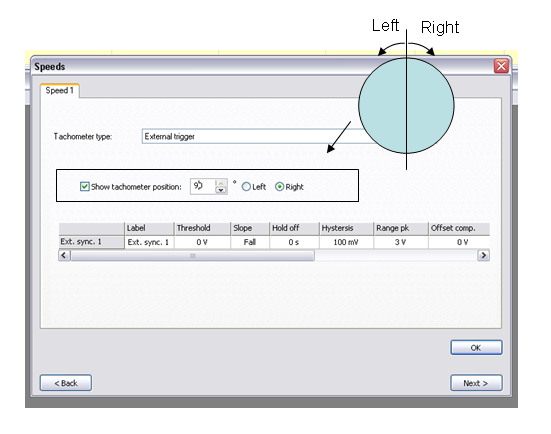
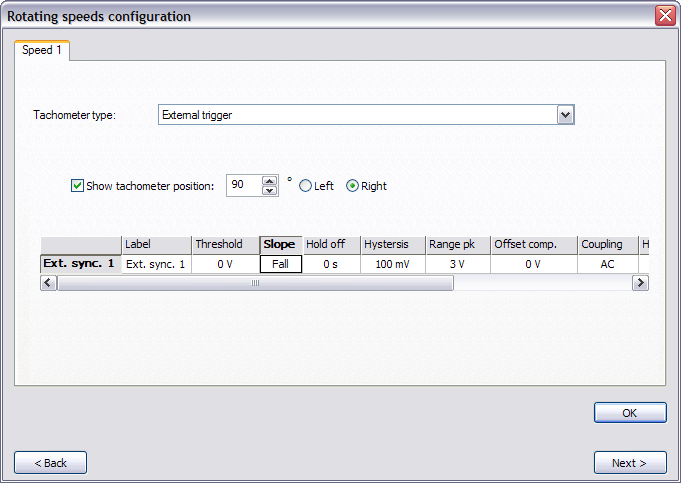
The keyphasor position can be setup in the software. It is only used for display purposes of the phase in the polar diagram. The value given for the keyphazor position doesn't change the value of the phase.
Figure 7. Different Keyphasor positions give different phase results
Trigger Slope
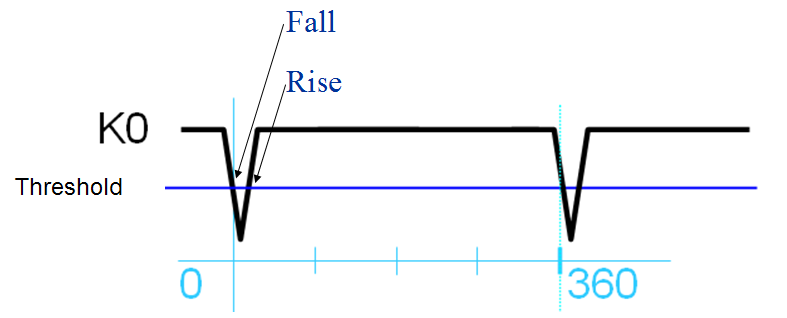
The phase value may slightly depend on the fall/rise trigerring condition. In ORBIGate this value can be selected as shown in figure 8. In some other system on the market this value is sometimes fixed. In the ADRE system it is fixed to "fall".
Figure 8. Fall/Rise trigerring condition
Figure 9. Different Keyphasor positions give different phase results
Phase display
Overview grid
The phase value of ordre one is shown in the grid in the column (1X Ph)
Figure 10. Phase display in ORBIGate
Bode Diagram
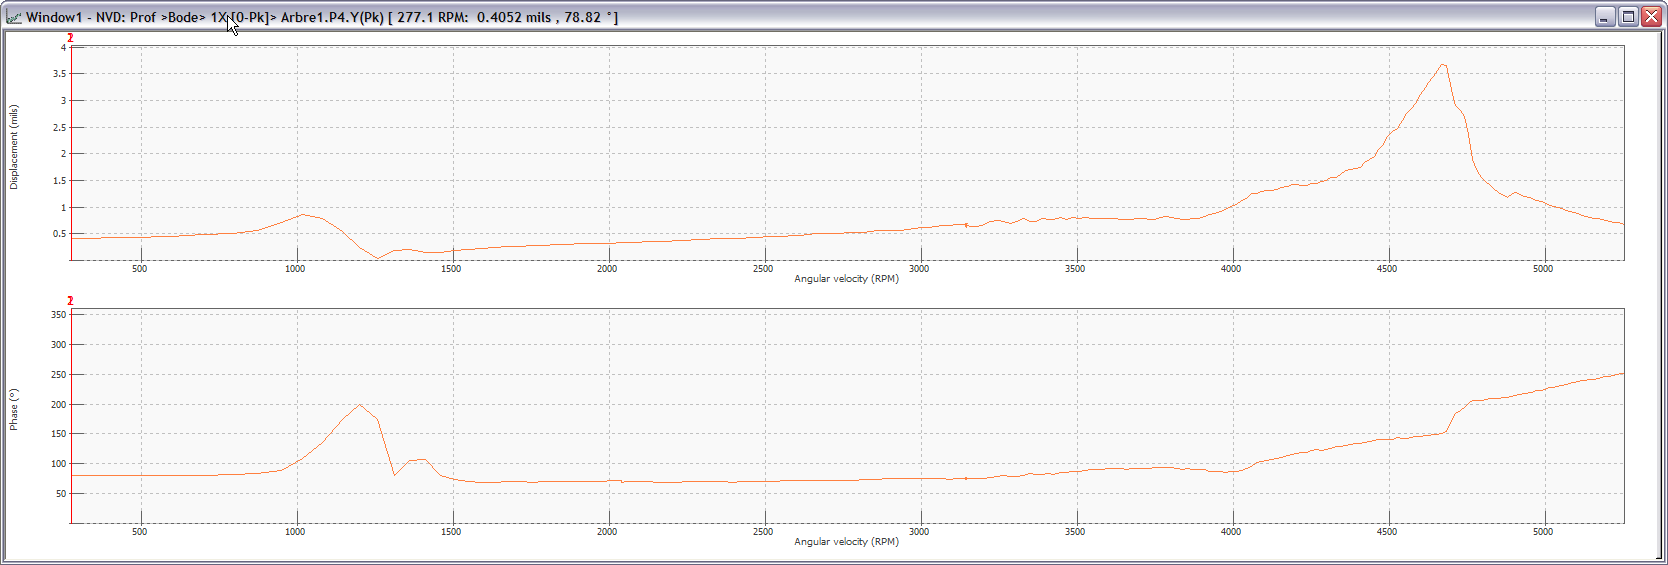
- In the Bode diagram, it is possible to show the phase on several phase rotation: for that, a right click should be done on the Bode diagram and choose the number of rotations. By default it is 1, giving 0/360°.
Figure 11. Phase display in ORBIGate
Polar Diagram
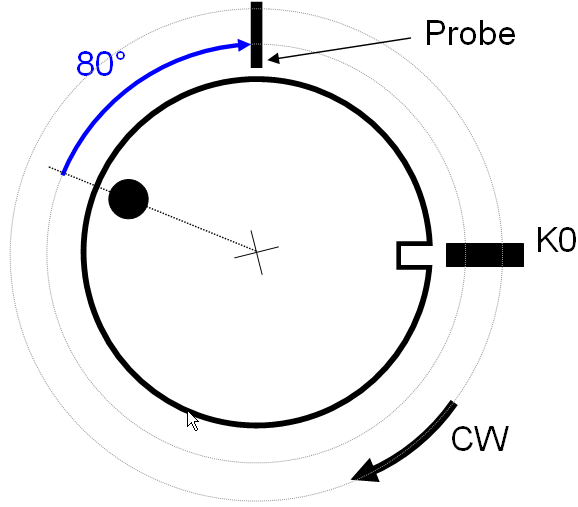
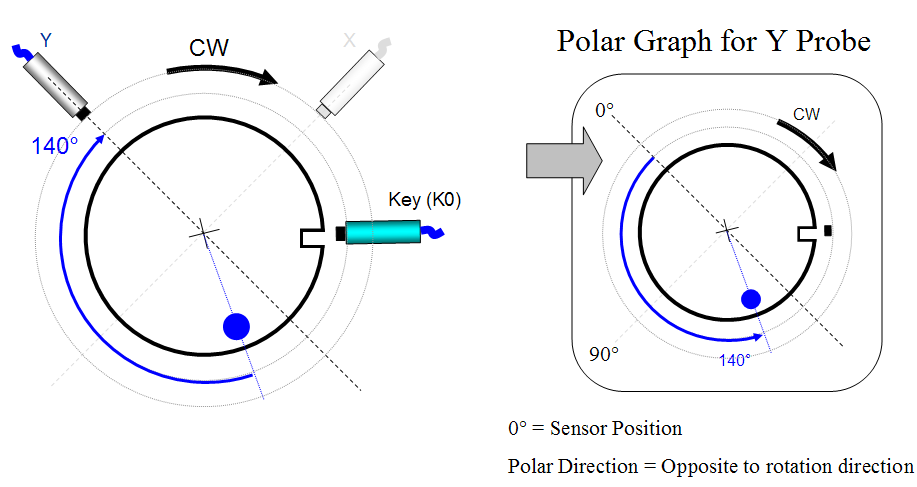
A typical machine configuration is shown as below:
Figure 12. Phase display in ORBIGate
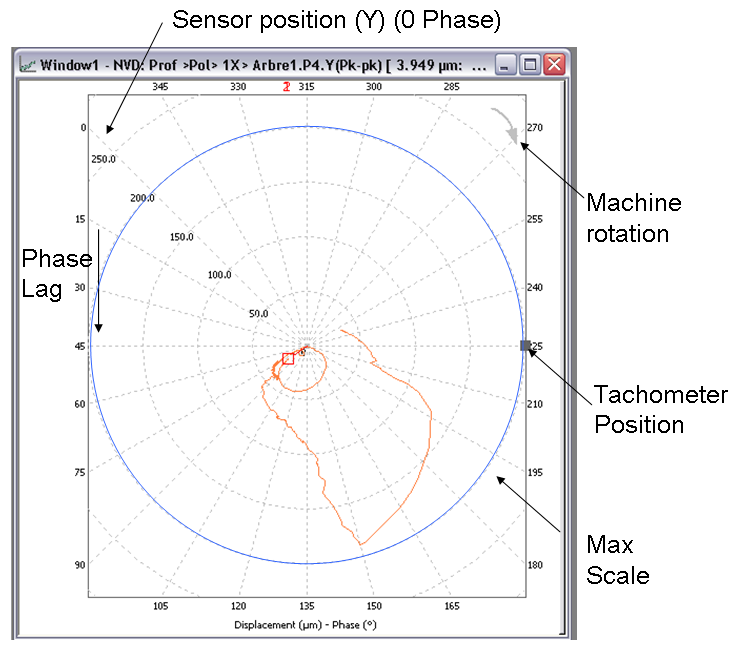
The main features of the ORBIGate polar diagram are:
- 0 Phase positioned as the measured probe
- Phase lag positive counting in opposite direction as machine rotation
- Machine rotation indication (CW or CCW arrow)
- Keyphasor position indication (as setup described in chapter 2.4 and figure 7)
- (0,0) at center
So, the polar diagram shows where is the unbalance located referred to the key slot (position of the keyphazor).
Figure 13. Phase display in ORBIGate during a run-up
Summary
- The phase can be shown in several types of diagrams: Overview grid, Vumeter, Bode and Polar.
- ORBIGate uses the lag convention
- The phase lag gives a positive value of the phase in ORBIGate
- It is possible to choose (in the preferences) the convention between -180°/180° and 0/360°. By default it is 0/360°.
- In the Bode diagram, it is possible to show the phase on several phase rotation: for that it is necessary to right click on the Bode diagram and choose the number of rotations.
- It is possible to choose to trigger the phase count on the rise or the fall of the keyphazor pulse. By default it is Fall.
- In the polar diagram, the phase rotates in the opposite direction of the machine rotation.
- In the polar diagram, the 0° is shown as the position of the sensor (proximity probe, velocity probe or accelerometer)
- In the polar diagram, the keyphazor position is shown as setup in the interface.

