Difference between revisions of "NVGate Time windows"
| (3 intermediate revisions by 2 users not shown) | |||
| Line 1: | Line 1: | ||
[[category:NVGate]] | |||
[[category:WikiOros]] | |||
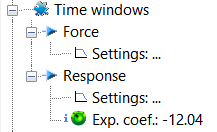
[[File:force_time.png|framed|right]] | [[File:force_time.png|framed|right]] | ||
<font color="#7F9698"></font>Used to define time weighting windows that can be applied to FFT blocks. | <font color="#7F9698"></font>Used to define time weighting windows that can be applied to FFT blocks. | ||
| Line 6: | Line 8: | ||
=====Video tutorial===== | =====Video tutorial===== | ||
<youtube>https:// | <youtube>https://www.youtube.com/watch?v=UIfeHGCBSgQ&list=PLwB9Ae8PGEbP-aPxWtOo1m59tingiiBIq&index=62</youtube> | ||
=====Force===== | =====Force===== | ||
| Line 33: | Line 35: | ||
[[Image:Filter_builder_12.png|framed|none]] | [[Image:Filter_builder_12.png|framed|none]] | ||
[[Image:Filter_builder_13.png| | [[Image:Filter_builder_13.png|700px|none]] | ||
* '''Exponential coefficient''': this coefficient is calculated with the coordinates of Decreasing point Y and Decreasing point X. | * '''Exponential coefficient''': this coefficient is calculated with the coordinates of Decreasing point Y and Decreasing point X. | ||
Latest revision as of 10:50, 26 November 2024
Used to define time weighting windows that can be applied to FFT blocks.
Video tutorial
Force
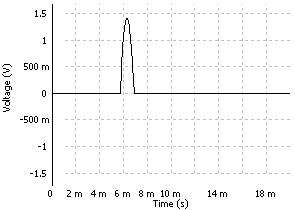
This setting is generally used to set up a uniform time window around the interesting part of the signal such as hammer impact, for example.
- Window Start: Starting point of the window as a percentage of the triggered block size of the plug-in using the window. The block size is the plug-in resolution setting value multiplied by 2.56. ex: for 401 lines resolution the triggered block size is 401*2.56 = 1024 samples.
- Window Stop: Stopping point of the window in percentage of the triggered block size of the plug-in using the window. The block size is the plug-in resolution setting value multiplied by 2.56. ex: for 401 lines resolution the triggered block size is 401*2.56 = 1024 samples.
Note: it is possible to adjust the start and stop values graphically by using drag and drop on the graph.
Response
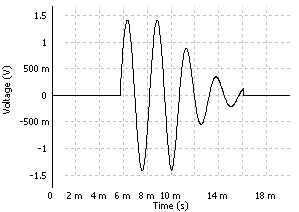
This setting is generally used to set up a uniform time window around the interesting part of the signal such as the response of an accelerometer after a hammer impact, for example.
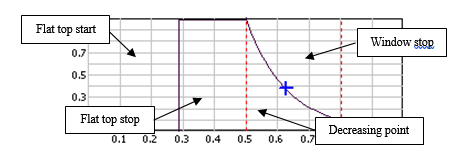
- Window Stop: Stopping point of the window as a percentage of the triggered block size of the plug-in using the window. The block size is the plug-in resolution setting value multiplied by 2.56. ex: for 401 lines resolution the triggered block size is 401*2.56 = 1024 samples.
- Flat top Start: Starting point of the window flat top as percentage of the triggered block size of the plug-in using the window. The block size is the plug-in resolution setting value multiplied by 2.56. ex: for 401 lines resolution the triggered block size is 401*2.56 = 1024 samples.
- Flat top Stop: Stopping point of the window flat top as a percentage of the triggered block size of the plug-in using the window. The block size is the plug-in resolution setting value multiplied by 2.56. ex: for 401 lines resolution the triggered block size is 401*2.56 = 1024 samples.
- Decreasing point X: Abscissa of the intermediate point that determines the decreasing coefficient of the exponential function as a percentage of the triggered block size of the plug-in using the window. The block size is the plug-in resolution setting value multiplied by 2.56. ex: for 401 lines resolution the triggered block size is 401*2.56 = 1024 samples.
- Decreasing 'point Y': Ordinate of the intermediate point that determines the decreasing coefficient of the exponential function as a percentage of the value of the signal.
- Exponential coefficient: this coefficient is calculated with the coordinates of Decreasing point Y and Decreasing point X.
In this example, it then gives
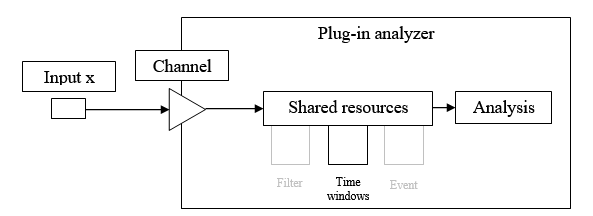
Note: a time window can be applied to several plug-in analyzer channels. The modification of the time window values will be applied to all the channels the time window is active.
Note: it is possible to adjust the values graphically by using drag and drop on the graph.
