Difference between revisions of "NVGate Diesel Engine Vibration Solution: EngineDiag"
| (14 intermediate revisions by 4 users not shown) | |||
| Line 1: | Line 1: | ||
Reciprocating machines | [[category:WikiOros]] | ||
With EngineDiag, OROS takes | [https://en.wikipedia.org/wiki/Reciprocating_motion Reciprocating machines] generate specific vibration signatures. Dedicated tools associating the machine mechanical characteristics and high performance analysis capabilities are necessary to understand the dynamic behavior of these machines. | ||
With EngineDiag, OROS takes on the challenge to offer tool integration in one product in order to enhance test efficiency. | |||
==Installation== | |||
== | ===Equipment required for the installation=== | ||
USB drive containing Angle-Frequency installation setup “SetupAngleFrequency.exe”. | |||
NVGate software must have been installed first. | |||
===Installation of NVGate software=== | |||
First you need to [[NVGate_2021:_Install_Process|install NVGate]]. | |||
===Installation of Angle-Frequency option=== | |||
For the Angle-Frequency option, it<nowiki>'</nowiki>s necessary to install a complementary application: <nowiki>'</nowiki>SetupAngleFrequency.exe<nowiki>'</nowiki>. | EngineDiag is a module integrated in [[NVGate]]. For the Angle-Frequency option, it<nowiki>'</nowiki>s necessary to install a complementary application: <nowiki>'</nowiki>SetupAngleFrequency.exe<nowiki>'</nowiki>. | ||
Double click on | Double click on | ||
[[Image:EngineDiag_06.png]] | [[Image:EngineDiag_06.png]] and the following window is dispalyed: | ||
[[Image:EngineDiag_07.png|framed|none]] | [[Image:EngineDiag_07.png|framed|none]] | ||
Click on Next, the following window | Click on "Next", and the following window is displayed: | ||
[[Image:EngineDiag_08.png|framed|none]] | [[Image:EngineDiag_08.png|framed|none]] | ||
Select the destination folder and click | Select the destination folder and click "Install". | ||
Note: if you change the default destination folder, be careful to install the Angle-Frequency module in the same directory | Note: if you change the default destination folder, be careful to install the Angle-Frequency module in the same directory as NVGate like the example below: | ||
[[Image:EngineDiag_09.png|framed|none]] | [[Image:EngineDiag_09.png|framed|none]] | ||
Click on “Install” to start the installation, and wait until the following window is displayed: | |||
[[Image:image_2021-05-17_111439.png|framed|none]] | |||
Click on “Close” to exit the setup wizard, and OROS EngineDiag is successfully installed. | |||
==Environment | ==Environment Configuration== | ||
With the EngineDiag module a new ribbon is available in NVGate. EngineDiag allows to access to NVGate through an interface dedicated to the engines and more generally to the reciprocating machines. | With the EngineDiag module, a new ribbon is available in NVGate. EngineDiag allows you to access to NVGate through an interface, which is dedicated to the engines, and more generally to the reciprocating machines. | ||
[[Image:EngineDiag_10.png|framed|none]] | [[Image:EngineDiag_10.png|framed|none]] | ||
| Line 37: | Line 46: | ||
===Properties=== | ===Properties=== | ||
To simplify | To simplify data saving, history creation and data search, it is possible and recommended to associate metadata to each measurement. | ||
One can | One can determine two types of metadata: | ||
* Properties related to a measurement campaign | * Properties related to a measurement campaign | ||
* Properties related to each measurement | * Properties related to each measurement | ||
Properties are defined by default in NVGate but the list of properties can be modified according to the user need. | Properties are defined by default in NVGate but the list of properties can be modified according to the user's need. | ||
The list of properties is available in the Home ribbon by clicking on Measurement properties. | The list of properties is available in the Home ribbon by clicking on Measurement properties. | ||
| Line 53: | Line 62: | ||
This window shows all the properties used. | This window shows all the properties used. | ||
For each | For each property a user can define two fields (Apply To & Suggest): | ||
* '''Apply to''': | * '''Apply to''': Indicates where the property will appear. | ||
* Apply to measurement: | * Apply to measurement: The property will appear in the save measurement only. | ||
[[Image:EngineDiag_13.png|framed|none]] | [[Image:EngineDiag_13.png|framed|none]] | ||
* Apply to Operation: the property will appear in the operation window and in the save measurement window. The user can pre fill in some of values in the window Operation available in the Engine ribbon. | * Apply to Operation: the property will appear in the operation window and in the save measurement window. The user can pre-fill in some of values in the window Operation available in the Engine ribbon. | ||
[[Image:EngineDiag_14.png|framed|none]] | [[Image:EngineDiag_14.png|framed|none]] | ||
| Line 67: | Line 76: | ||
* '''Suggest''' | * '''Suggest''' | ||
* Empty : | * Empty: The property is empty by default | ||
* Same as previous: | * Same as previous: By default the property keep the last value entered by the user. | ||
* Same as today: | * Same as today: The property keeps the same value during one day. The day after the value is reset to empty. | ||
By selecting show all in this window, all the properties, even those that are not used anymore, are displayed. | By selecting show all in this window, all the properties, even those that are not used anymore, are displayed. | ||
| Line 75: | Line 84: | ||
====Operation==== | ====Operation==== | ||
These properties related to a measurement campaign are generally | These properties related to a measurement campaign are generally related to several measurements done on the same day and on the same installation. Instead of writing this information for each measurement, it<nowiki>'</nowiki>s possible to define the environment once before stating the measurement. | ||
This information can be defined in the operation window available by clicking on the button | This information can be defined in the operation window available by clicking on the button | ||
| Line 81: | Line 90: | ||
. | . | ||
Below | Below are the properties by default: | ||
[[Image:EngineDiag_17.png|framed|none]] | [[Image:EngineDiag_17.png|framed|none]] | ||
The properties can be defined directly in | The properties can be defined by what is directly shown in the following example: | ||
[[Image:EngineDiag_18.png|framed|none]] | [[Image:EngineDiag_18.png|framed|none]] | ||
At this stage, new properties can be added if needed by clicking on Add new in this window | At this stage, new properties can be added if needed by clicking on "Add new" in this window | ||
[[Image:EngineDiag_19.png|framed|none]] | [[Image:EngineDiag_19.png|framed|none]] | ||
Select OK. | Select "OK". | ||
All these properties will be added to each measurement done this day. | All these properties will be added to each measurement that is done on this day. | ||
==== | ====Measurement==== | ||
In the | In the "Save Measurement" window, all the activated properties are displayed. | ||
The properties pre-filled in the operation window appear with the value defined by the user in the operation window. | The properties are pre-filled in the operation window and appear with the value defined by the user in the operation window. | ||
[[Image:EngineDiag_20.png|framed|none]] | [[Image:EngineDiag_20.png|framed|none]] | ||
| Line 106: | Line 115: | ||
==Engine Configuration== | ==Engine Configuration== | ||
One of the objectives of the EngineDiag module is to integrate in NVGate the physical data related to the engine under test in order to have all this information during the analysis. | One of the objectives of the EngineDiag module is to integrate, in NVGate, the physical data related to the engine under test in order to have all this information during the analysis. | ||
The design and the kinematic information can be described by clicking on the button Engine. | The design and the kinematic information can be described by clicking on the button Engine. | ||
| Line 133: | Line 142: | ||
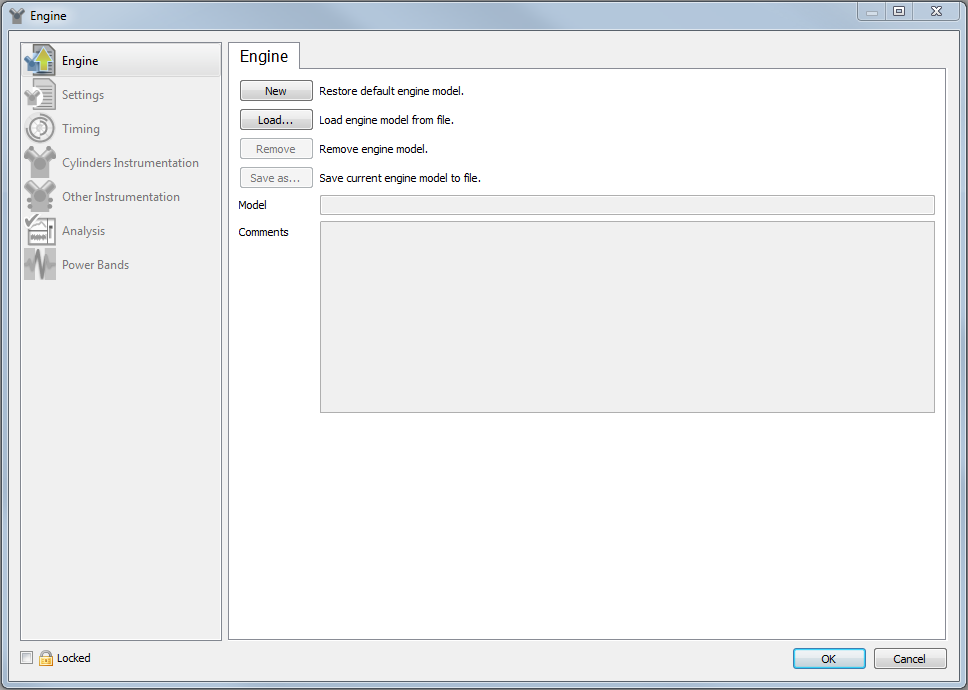
By clicking on "new", a default engine model is loaded and the "settings" panel is automatically displayed. | By clicking on "new", a default engine model is loaded and the "settings" panel is automatically displayed. | ||
Here, some modifications can be done. | |||
* Load: Load an existing engine model | * Load: Load an existing engine model | ||
By clicking on "Load", an existing engine model can be loaded by selecting a file .engine. | By clicking on "Load", an existing engine model can be loaded by selecting a file .engine. | ||
* Remove: Remove the current engine model | * Remove: Remove the current engine model. | ||
* Save as: Save the current engine model to a file | * Save as: Save the current engine model to a file. | ||
This panel gives also the model name defined in the settings panel and all the comments written by the user. The field "comments" is saved in the engine model. | This panel gives also the model name defined in the settings panel and all the comments written by the user. The field "comments" is saved in the engine model. | ||
===Settings=== | ===Settings=== | ||
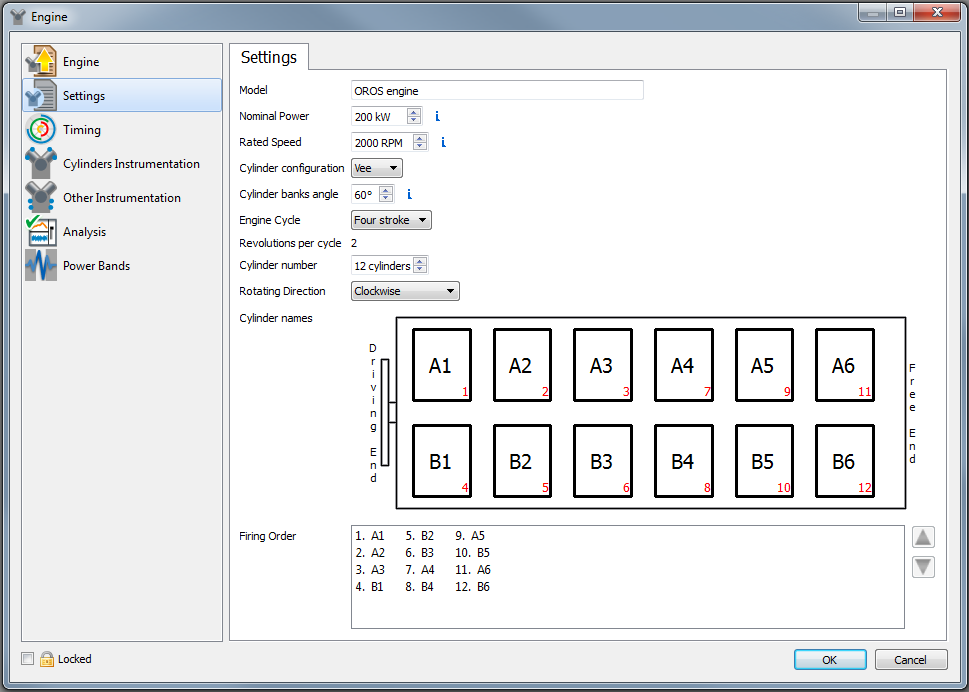
The settings panel allows to describe the engine characteristics. | The settings panel allows you to describe the engine characteristics. | ||
[[Image:EngineDiag_23.png|framed|none]] | [[Image:EngineDiag_23.png|framed|none]] | ||
The 3 fields: Nominal power, rated speed and cylinder bank angle are here for information. The results are not influenced by these values. | The 3 fields: Nominal power, rated speed and cylinder bank angle are here for more information. The results are not influenced by these values. | ||
The | The other settings will influence the results. | ||
* Cylinder configuration: | * Cylinder configuration: Free or In Line. | ||
* Engine cycle: 2 strokes or 4 strokes | * Engine cycle: 2 strokes or 4 strokes. | ||
* Cylinders number: | * Cylinders number: Indicate the cylinders number. | ||
* Rotating Direction: Clockwise or counterclockwise | * Rotating Direction: Clockwise or counterclockwise | ||
With this information, a schematic picture is | With this information, a schematic picture is automatic.ally drawn. The cylinder's names can be modified by clicking directly on them. | ||
On this picture, the small numbers in red represent | On this picture, the small numbers in red represent the firing order. This order can be modified in the panel below the picture. | ||
===Timing=== | ===Timing=== | ||
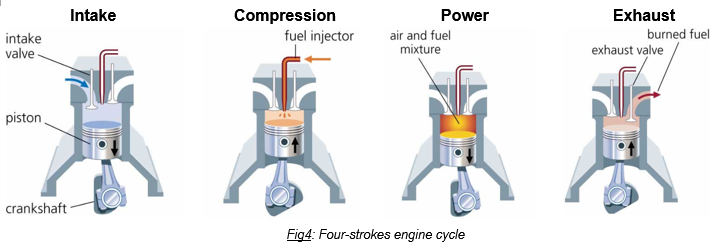
The timing panel allows to describe the timing information generally provided by the engine manufacturer. | The timing information corresponds to the machine kinematics. The cycle of each reciprocating machine is divided in to several phases. These phases are separated by kinematic events. The figure below shows the typical cycle of a 4-stroke diesel engine with the different phases: | ||
[[File:Engine_diag3.png|framed|none]] | |||
The duration of each phase is defined by the valves opening and closing. The position of these events is given in angle relative to the Top Dead Center (TDC) where the piston is at top of the cylinder or Bottom Dead Center (BDC) where the piston is at the bottom of the cylinder. | |||
This information is generally contained in the timing diagram provided by the engine manufacturer. | |||
EngineDiag supports the ability to enter the timing diagram information to be used in the analysis. <br> | |||
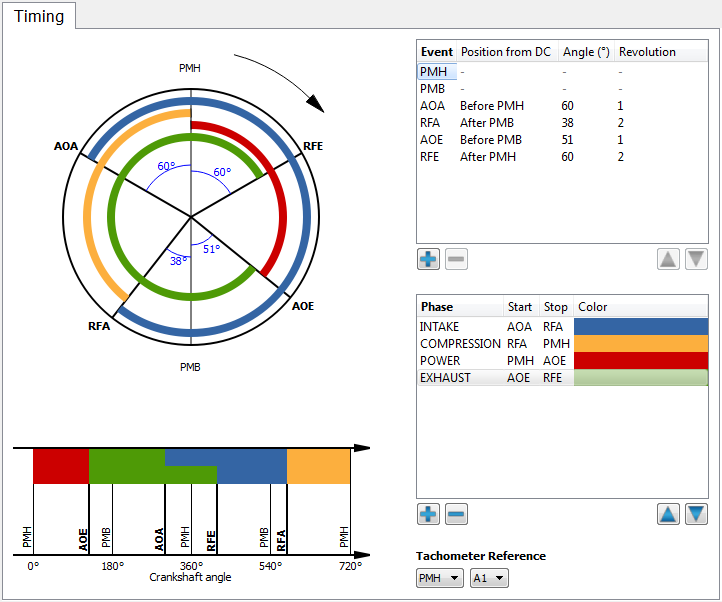
The timing panel allows you to describe the timing information generally provided by the engine manufacturer. | |||
[[Image:EngineDiag_24.png|framed|none]] | [[Image:EngineDiag_24.png|framed|none]] | ||
* The events table | * The events table | ||
The events table allows define the kinematic events (Intake opening, exhaust opening,…) and position them in relation to the events Top Dead Center (TDC) and Bottom Dead Center (BDC). | The events table allows you to define the kinematic events (Intake opening, exhaust opening,…) and position them in relation to the events Top Dead Center (TDC) and Bottom Dead Center (BDC). | ||
An event is defined by: | An event is defined by two things: | ||
* | * An angle from the TDC or BDC. | ||
* | * Its position in the engine cycle. | ||
Every | This information is important for four-stroke engines. It<nowiki>'</nowiki>s necessary to know if the event appears in the first or in the second crankshaft revolution. | ||
Every modification done in the events table is automatically reported on the two graphs displayed here. At the top, a typical timing diagram and at the bottom the linear engine cycle representation. | |||
A new event can be added by clicking on | A new event can be added by clicking on the | ||
[[Image:EngineDiag_25.png]] | [[Image:EngineDiag_25.png]] | ||
below the events table. | below the events table. | ||
. | . | ||
| Line 181: | Line 199: | ||
From the events described in the events table, the different phases of the engine cycle can be defined. Each phase is defined by its start and stop event as well as a color. The settings can be modified by double clicking on the concerned setting. | From the events described in the events table, the different phases of the engine cycle can be defined. Each phase is defined by its start and stop event as well as a color. The settings can be modified by double clicking on the concerned setting. | ||
A new phase can be added by clicking on | A new phase can be added by clicking on the | ||
[[Image:EngineDiag_27.png]] | [[Image:EngineDiag_27.png]] | ||
below the phases table. The selected phase can be removed by clicking on | below the phases table. The selected phase can be removed by clicking on the | ||
[[Image:EngineDiag_28.png]] | [[Image:EngineDiag_28.png]] | ||
. | . | ||
| Line 203: | Line 221: | ||
For each cylinder, one can define: | For each cylinder, one can define: | ||
* Analyzer input | * Analyzer input. | ||
* Label | * Label. | ||
* Type of transducer by using the transducer database. The sensitivity of the selected transducer is automatically displayed. | * Type of transducer by using the transducer database. | ||
The sensitivity of the selected transducer is automatically displayed. | |||
[[Image:EngineDiag_30.png|framed|none]] | [[Image:EngineDiag_30.png|framed|none]] | ||
Several transducers can be installed on the same cylinder. | Several transducers can be installed on the same cylinder. You can define the maximum number of inputs per cylinder. See the example below with 3 inputs: | ||
[[Image:EngineDiag_31.png|framed|none]] | [[Image:EngineDiag_31.png|framed|none]] | ||
| Line 218: | Line 237: | ||
[[Image:EngineDiag_32.png|framed|none]] | [[Image:EngineDiag_32.png|framed|none]] | ||
Several groups of transducers can be defined often associated to a machine part: bearing, absorber... | Several groups of transducers can be defined, which are often associated to a machine part: bearing, absorber... | ||
Double click on "New part" to define the part name and click on | Double click on "New part" to define the part name and click on the | ||
[[Image:EngineDiag_33.png]] | [[Image:EngineDiag_33.png]] | ||
to add a new part. | to add a new part. | ||
| Line 234: | Line 253: | ||
====Analysis==== | ====Analysis==== | ||
The Analysis panel allows to select the type of analysis that will be done. This information will be used to help the user to configure NVGate. | The Analysis panel allows you to select the type of analysis that will be done. This information will be used to help the user to configure NVGate. | ||
[[Image:EngineDiag_36.png|framed|none]] | [[Image:EngineDiag_36.png|framed|none]] | ||
| Line 242: | Line 261: | ||
* The asynchronous analysis uses the FFT plug-in | * The asynchronous analysis uses the FFT plug-in | ||
When the engine model is defined do not forget to save it in the Engine panel with the Save as button. | When the engine model is defined, do not forget to save it in the Engine panel with the "Save as" button. | ||
==NVGate configuration== | ==NVGate configuration== | ||
| Line 249: | Line 268: | ||
From the parameters defined in the engine model, the Advisor will help the user to configure NVGate correctly. | From the parameters defined in the engine model, the Advisor will help the user to configure NVGate correctly. | ||
The advisor is a | The advisor is a helpful tool, it<nowiki>'</nowiki>s not compulsory to use it for the configuration. | ||
[[Image:EngineDiag_37.png|framed|none]] | [[Image:EngineDiag_37.png|framed|none]] | ||
| Line 267: | Line 286: | ||
[[Image:EngineDiag_39.png|framed|none]] | [[Image:EngineDiag_39.png|framed|none]] | ||
|Regarding the type of analysis selected, some settings are missing to obtain all the results. | |Regarding the type of analysis selected, some settings are missing in order to obtain all the results. | ||
|- | |- | ||
| Line 273: | Line 292: | ||
[[Image:EngineDiag_40.png|framed|none]] | [[Image:EngineDiag_40.png|framed|none]] | ||
|Regarding the type of analysis selected, the NVGate configuration is correct. The user can choose which results he wants to display and start the acquisition | |Regarding the type of analysis selected, the NVGate configuration is correct. The user can choose which results he wants to display and start the acquisition. | ||
|} | |} | ||
By clicking on the Advisor button, all the errors will be displayed with title, explanation and criticality as below. | By clicking on the Advisor button, all the errors will be displayed with title, explanation and criticality, as shown below. | ||
[[Image:EngineDiag_41.png]] | [[Image:EngineDiag_41.png]] | ||
| Line 287: | Line 306: | ||
. | . | ||
* Click on [[Image:EngineDiag_44.png]]will automatically set up NVGate to solve the error. | * Click on [[Image:EngineDiag_44.png]] and it will automatically set up NVGate to solve the error. | ||
* Click on [[Image:EngineDiag_45.png]] will open the window where the user has to do an action to solve the error. | * Click on [[Image:EngineDiag_45.png]] and it will open the window where the user has to do an action to solve the error. | ||
To | To save time, the [[Image:EngineDiag_46.png]] button | ||
allows to fix all the displayed errors that can be solved automatically. | allows you to fix all the displayed errors that can be solved automatically. | ||
[[Image:EngineDiag_47.png|framed|none]] | [[Image:EngineDiag_47.png|framed|none]] | ||
The" Fix Selected" | The "Fix Selected" button, | ||
[[Image:EngineDiag_48.png]] | [[Image:EngineDiag_48.png]] | ||
, solves the selected errors in the list. | , solves the selected errors in the list. | ||
The advisor gives only | The advisor gives only advice. The user can read the information and decide to ignore some of the errors. Each error can be hidden by clicking on the button shown below. | ||
[[Image:EngineDiag_49.png|framed|none]] | [[Image:EngineDiag_49.png|framed|none]] | ||
The "Hide Selected" function, | The "Hide Selected" function, | ||
[[Image:EngineDiag_50.png]] | [[Image:EngineDiag_50.png]] | ||
, allows to hide several errors at the same time by selecting them. | , allows you to hide several errors at the same time by selecting them. | ||
All the hidden functions are not deleted. At | All the hidden functions are not deleted. At any time the user can display all of them by clicking on the button | ||
[[Image:EngineDiag_51.png]] | [[Image:EngineDiag_51.png]] | ||
. | . | ||
The advisor displays the important rules to make a correct measurement but the NVGate configuration is not restricted to the | The advisor displays the important rules to make a correct measurement but the NVGate configuration is not restricted to the advice shown here. | ||
All the capabilities of NVGate are available. The user can complete this first configuration to adapt | All the capabilities of NVGate are available. The user can complete this first configuration to perfectly adapt it to its application. | ||
==The | ==The Dedicated Results== | ||
With the Engine Module, several dedicated results are available. | With the Engine Module, several dedicated results are available. | ||
These results can be displayed through the | These results can be displayed through the "Add/Remove window" available in the ribbon "Display/Graphs". | ||
[[Image:EngineDiag_52.png|framed|none]] | [[Image:EngineDiag_52.png|framed|none]] | ||
| Line 326: | Line 345: | ||
[[Image:EngineDiag_53.png|framed|none]] | [[Image:EngineDiag_53.png|framed|none]] | ||
===Time signal - The Triggered | ===Time signal - The Triggered Block Engine=== | ||
The triggered block engine is a new result of the | The triggered block engine is a new result of the Sync. order plug-in associating the engine information to the standard synchronous triggered blocks. | ||
Select the results as below: | Select the results as below: | ||
| Line 334: | Line 353: | ||
[[Image:EngineDiag_54.png|framed|none]] | [[Image:EngineDiag_54.png|framed|none]] | ||
The following window will be displayed | The following window will be displayed: | ||
[[Image:EngineDiag_55.png|framed|none]] | [[Image:EngineDiag_55.png|framed|none]] | ||
| Line 345: | Line 364: | ||
[[Image:EngineDiag_56.png|framed|none]] | [[Image:EngineDiag_56.png|framed|none]] | ||
The cycle overview (defined in Engine/Timing) of each displayed cylinders are shown at the bottom of the window. The cycle overview of each cylinders is determined by: | |||
* The tachometer reference | * The tachometer reference. | ||
* The firing order | * The firing order. | ||
* The timing diagram | * The timing diagram. | ||
2 cursors displayed on the signals and the cycle overview allow you to identify the kinematic events on the signals. | |||
* | * | ||
[[Image:EngineDiag_57.png|framed|none]] | [[Image:EngineDiag_57.png|framed|none]] | ||
On the example above the cursors are positioned at the beginning of the 2 main events of the signal. Looking at the cycle overview, one can | On the example above the cursors are positioned at the beginning of the 2 main events of the signal. Looking at the cycle overview, one can note that: | ||
* | * The first cursor corresponds to the end of the exhaust phase, i.e. the exhaust valve closing. | ||
* The second cursor corresponds to the end of the intake phase, | * The second cursor corresponds to the end of the intake phase, i.e. the intake valve closing. | ||
* By default, only one cycle is displayed in this window, 360° (crankshaft angle) for a 2-strokes engine or 720 ° (crankshaft angle) for a 4-strokes engine. More cycles can be | * By default, only one cycle is displayed in this window, 360° (crankshaft angle) for a 2-strokes engine or 720 ° (crankshaft angle) for a 4-strokes engine. More cycles can be displayed. The number can be defined in the Engine Ribbon. | ||
[[Image:EngineDiag_58.png|framed|none]] | [[Image:EngineDiag_58.png|framed|none]] | ||
| Line 401: | Line 420: | ||
|} | |} | ||
The signals can be aligned on the same event by selecting the <nowiki>'</nowiki>align<nowiki>'</nowiki> function in the Engine Ribbon. | |||
[[Image:EngineDiag_59.png|framed|none]] | [[Image:EngineDiag_59.png|framed|none]] | ||
| Line 407: | Line 426: | ||
===Comparison=== | ===Comparison=== | ||
This Trigger Block Engine result can be saved as any NVGate | This Trigger Block Engine result can be saved as any NVGate result. Add the results in the "Save Selection" tab, which is available in the "Save Setup" window, which is accessible in the Measurement Ribbon. | ||
[[Image:EngineDiag_60.png|framed|none]] | [[Image:EngineDiag_60.png|framed|none]] | ||
Otherwise right click in the window and click on | Otherwise, right click in the window and click on "Add to result selection", like below. | ||
[[Image:EngineDiag_61.gif|framed|none]] | [[Image:EngineDiag_61.gif|framed|none]] | ||
| Line 418: | Line 437: | ||
[[Image:EngineDiag_62.png|framed|none]] | [[Image:EngineDiag_62.png|framed|none]] | ||
The | The saved results can be compared between them or with a current result in the same window. | ||
To add result in a window, drag&drop the result from the project manager to the window. | To add result in a window, drag&drop the result from the project manager to the window. | ||
| Line 426: | Line 445: | ||
The cycle overview of each of the measurements is also displayed. | The cycle overview of each of the measurements is also displayed. | ||
===The | ===The Averaged RMS Engine=== | ||
The Averaged RMS Engine is a result available in | The Averaged RMS Engine is a result available in Waterfall, allowing you to display the RMS level of the cylinders calculated on the engine cycle and averaged on the measurement. | ||
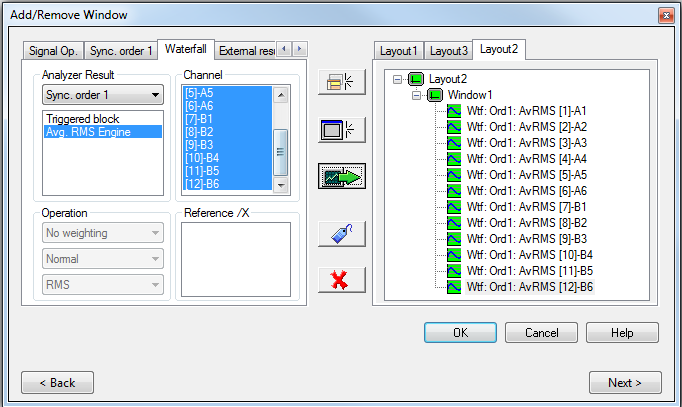
This new result is based on the RMS level calculated in the | This new result is based on the RMS level calculated in the Sync. Order plug-in. | ||
Select the results as below: | Select the results as shown below: | ||
[[Image:EngineDiag_64.png|framed|none]] | [[Image:EngineDiag_64.png|framed|none]] | ||
The following window will be displayed | The following window will be displayed: | ||
[[Image:EngineDiag_65.png|framed|none]] | [[Image:EngineDiag_65.png|framed|none]] | ||
This window shows the averaged RMS value on the engine cycle for each cylinder. The viewmeter indicates the value and the symbol | This window shows the averaged RMS value on the engine cycle for each cylinder. The viewmeter indicates the value and the symbol | ||
[[Image:EngineDiag_66.png]]represents the standard deviation. | [[Image:EngineDiag_66.png]] represents the standard deviation. | ||
These values are all displayed in a summary table in the infotrace. | These values are all displayed in a summary table in the infotrace. | ||
After a first visualization of the global RMS level calculated on the complete cycle, it<nowiki>'</nowiki>s possible to display the RMS level of each phase of the cycle | After a first visualization of the global RMS level calculated on the complete cycle, it<nowiki>'</nowiki>s possible to display the RMS level of each phase of the cycle; typically the combustion, the exhaust, the intake and the compression. | ||
To display these results, click on one phase of the cycle overview displayed at the bottom of the window. | To display these results, click on one phase of the cycle overview displayed at the bottom of the window. | ||
Below the RMS level calculated during the combustion. | Below the RMS level is calculated during the combustion. | ||
[[Image:EngineDiag_67.png|framed|none]] | [[Image:EngineDiag_67.png|framed|none]] | ||
| Line 457: | Line 476: | ||
===Comparison=== | ===Comparison=== | ||
This Avg. RMS Engine result can be saved like the | This Avg. RMS Engine result can be saved like the other NVGate results. Add the results in the "Save Selection" tab available in the "Save setup" window, which is accessible in the Measurement Ribbon. | ||
[[Image:EngineDiag_68.png|framed|none]] | [[Image:EngineDiag_68.png|framed|none]] | ||
| Line 465: | Line 484: | ||
[[Image:EngineDiag_69.png|framed|none]] | [[Image:EngineDiag_69.png|framed|none]] | ||
To compare results, drag&drop the results from the Project Manager to the window. | To compare results, drag & drop the results from the Project Manager to the window. | ||
The software will automatically arrange the results by cylinder and date. The results are grouped by cylinders and the first result displayed is the | The software will automatically arrange the results by cylinder and date. The results are grouped by cylinders and the first result displayed is the oldest one. | ||
[[Image:EngineDiag_70.png|framed|none]] | [[Image:EngineDiag_70.png|framed|none]] | ||
| Line 475: | Line 494: | ||
There is no limitation regarding the number of results that can be displayed at the same time. | There is no limitation regarding the number of results that can be displayed at the same time. | ||
To remove results, right click on the window, select <nowiki>'</nowiki>Remove | To remove results, right click on the window, select <nowiki>'</nowiki>Remove Result<nowiki>'</nowiki> and the results you want to remove. | ||
[[Image:EngineDiag_72.gif|framed|none]] | [[Image:EngineDiag_72.gif|framed|none]] | ||
This display allows to compare few measurements. To make trend analysis on several measurements, it<nowiki>'</nowiki>s possible to change the display mode. | This display allows you to compare a few measurements. To make a trend analysis on several measurements, it<nowiki>'</nowiki>s possible to change the display mode. | ||
The 2 modes are available by right clicking on the window and | The 2 modes are available by right clicking on the window and selecting "Display Mode". | ||
{|border="2" cellspacing="0" cellpadding="4" width="100%" | {|border="2" cellspacing="0" cellpadding="4" width="100%" | ||
| Line 499: | Line 518: | ||
|} | |} | ||
The History mode shows the values with the standard deviation in absolute time. It allows to follow the parameters during a long period. | The History mode shows the values with the standard deviation in absolute time. It allows you to follow the parameters during a long period. | ||
In this representation, a color is associated to each cylinder. | In this representation, a color is associated to each cylinder. The same color is used on the graph and in the results table in the infotrace. | ||
==Angle-Frequency | ==Angle-Frequency Analysis and Display== | ||
Angle-Frequency analysis is interesting when working on reciprocating machine. It allows to identify specific events. | Angle-Frequency analysis is interesting when working on a reciprocating machine. It allows you to identify specific events. | ||
The method implemented in the software is based on the Wigner-Ville algorithm. | The method implemented in the software is based on the [https://en.wikipedia.org/wiki/Wigner_distribution_function Wigner-Ville algorithm]. | ||
This method is particularly adapted for short transient signal where the STFT is not sufficient. Another advantage is the good resolution both in angle and frequency one can obtain. | This method is particularly adapted for short transient signal where the STFT is not sufficient. Another advantage is the good resolution, both in angle and frequency, that one can obtain. | ||
The principle is to represent the energy density on a colorspectrogram using the Wigner-Ville distribution (W (θ, f)). The relevance of the results of such analysis depends on settings including angle and frequency resolution. | The principle is to represent the energy density on a colorspectrogram using the Wigner-Ville distribution (W (θ, f)). The relevance of the results of such analysis depends on settings including angle and frequency resolution. | ||
| Line 521: | Line 540: | ||
This analysis is available in post-analyze only. | This analysis is available in post-analyze only. | ||
===A | ===A Dedicated Window=== | ||
Before starting, note that this analysis is available in post-analyze only. | Before starting, note that this analysis is available in post-analyze only. | ||
If a signal is loaded in the player, click on the button | If a signal is loaded in the player, click on the button "Angle-Frequency" in the Engine Ribbon to open the following dedicated window: | ||
[[Image:EngineDiag_77.png|framed|none]] | [[Image:EngineDiag_77.png|framed|none]] | ||
It<nowiki>'</nowiki>s also possible to use the | It<nowiki>'</nowiki>s also possible to use the "Angle-Frequency Analysis" on another signal not loaded in the player. | ||
In this case, right click on the concerned signal in the project manager and select Angle-Frequency Analysis. | In this case, right click on the concerned signal in the project manager and select "Angle-Frequency Analysis". | ||
[[Image:EngineDiag_78.gif|framed|none]] | [[Image:EngineDiag_78.gif|framed|none]] | ||
===Result | ===Result Manager=== | ||
The Result | The Result Manager shows the signal(s) and the tracks that will be analyzed in angle-frequency. | ||
Click on the button [[Image:EngineDiag_79.png]]. The following part of the window will appear. | Click on the button [[Image:EngineDiag_79.png]]. The following part of the window will appear. | ||
| Line 542: | Line 561: | ||
[[Image:EngineDiag_80.png|framed|none]] | [[Image:EngineDiag_80.png|framed|none]] | ||
'''Signal''' | |||
One can see the selected signal name and the corresponding project. | One can see the selected signal name and the corresponding project. | ||
It<nowiki>'</nowiki>s possible to open several different signals in a same window by clicking on "open signal". | It<nowiki>'</nowiki>s possible to open several different signals in a same window by clicking on "open signal". | ||
'''Tachometers''' | |||
The second step is to define the tachometers that will be used for the analysis: | The second step is to define the tachometers that will be used for the analysis: | ||
* Assoc. Tach: define | * Assoc. Tach: Here you can define the tachometer that will be used for the synchronous analysis. | ||
* Samp. Pulse: | * Samp. Pulse: Indicate the tachometer that will be used for the angular sampling. This signal must contain several pulses per revolution and will lead to a better accuracy in angle. Nevertheless, it<nowiki>'</nowiki>s not necessary to define a sampling pulse. The angular sampling can be done with the Assoc. Tach. In this case, set this parameter to none. | ||
'''Tracks''' | |||
Select the tracks that will be analyzed and displayed and click on <nowiki>'</nowiki>Add track<nowiki>'</nowiki>. If several signals are loaded in the window, the displayed tracks list will depend on the selected signal. Select each signal one by one and choose the tracks for each of them. | Select the tracks that will be analyzed and displayed and click on <nowiki>'</nowiki>Add track<nowiki>'</nowiki>. If several signals are loaded in the window, the displayed tracks list will depend on the selected signal. Select each signal one by one and choose the tracks for each of them. | ||
[[Image:EngineDiag_81.png|framed|none]] | [[Image:EngineDiag_81.png|framed|none]] | ||
After this first step, it<nowiki>'</nowiki>s possible to click again on [[Image:EngineDiag_82.png]]to reduce this window | After this first step, it<nowiki>'</nowiki>s possible to click again on [[Image:EngineDiag_82.png]]to reduce this window section. | ||
===Settings=== | ===Settings=== | ||
Three parameters have to be set up | Three parameters have to be set up: the angular resolution, the frequential resolution and the average size. They can be modified in the window bar: | ||
[[Image:EngineDiag_83.png|framed|none]] | [[Image:EngineDiag_83.png|framed|none]] | ||
'''Angular resolution:''' this parameter determines the angle that separates two values in the angle axis. The maximum resolution can be determined in function of the machine. | |||
For example, working on a 4-strokes 12 cylinders diesel engine, the angular resolution must be lower than 720/12= 60° to be able to differentiate all the events on the different cylinders. | For example, working on a 4-strokes 12 cylinders diesel engine, the angular resolution must be lower than 720/12= 60° to be able to differentiate all the events on the different cylinders. | ||
'''Frequential resolution:''' This parameter determines the frequency that separates two values in the frequency axis. | |||
'''Average size:''' This parameter is the average number used to calculate the Wigner-Ville spectrum. For this result, the average is made on the engine cycle (720° for a 4-strokes engine and 360° for a 2-strokes engine). In most cases, set the average number to 100 leads to good results. | |||
When these parameters are set up, click on [[Image:EngineDiag_84.png]]to launch the computation and display the result. | When these parameters are set up, click on [[Image:EngineDiag_84.png]]to launch the computation and display the result. | ||
| Line 580: | Line 600: | ||
[[Image:EngineDiag_85.png|framed|none]] | [[Image:EngineDiag_85.png|framed|none]] | ||
==== | ====Display Tools==== | ||
Each graph can be maximized by clicking on the following button in the top right corner of each graph. Move the mouse over this area to let the button appear. | Each graph can be maximized by clicking on the following button in the top right corner of each graph. Move the mouse over this area to let the button appear. | ||
| Line 590: | Line 610: | ||
[[Image:EngineDiag_87.gif|framed|none]] | [[Image:EngineDiag_87.gif|framed|none]] | ||
''Cursors'' | |||
By default the energy spectrum and the instantaneous power are calculated from the complete colorspectrogram. | By default, the energy spectrum and the instantaneous power are calculated from the complete colorspectrogram. | ||
With the mouse, it<nowiki>'</nowiki>s possible to select a part of the colorspectrogram and calculate the energy spectrum and instantaneous power from this selection. | With the mouse, it<nowiki>'</nowiki>s possible to select a part of the colorspectrogram and calculate the energy spectrum and instantaneous power from this selection. | ||
| Line 609: | Line 629: | ||
===Comparison=== | ===Comparison=== | ||
====Tracks from the same signal==== | ====Tracks from the same signal==== | ||
Open the result manager | Open the result manager with [[Image:EngineDiag_88.png]] | ||
[[Image:EngineDiag_89.png|framed|none]] | [[Image:EngineDiag_89.png|framed|none]] | ||
All the tracks available in the opened signal are | All the tracks available in the opened signal are shown. Select the tracks, click on add track and click on the button "Compute" to add these results in the window. | ||
[[Image:EngineDiag_90.png|framed|none]] | [[Image:EngineDiag_90.png|framed|none]] | ||
| Line 620: | Line 640: | ||
The buttons [[Image:EngineDiag_92.png]] | The buttons [[Image:EngineDiag_92.png]] | ||
at the left top corner allow to navigate among the results and visualize the various calculated colorspectrograms. | at the left top corner allow you to navigate among the results and visualize the various calculated colorspectrograms. | ||
====Report==== | ====Report==== | ||
To add the angle-frequency results in a report, go to the | To add the angle-frequency results in a report, go to the Report ribbon, select the active Word file and drag & drop the Angle-Frequency icon to the document. | ||
[[Image:EngineDiag_93.png|framed|none]] | [[Image:EngineDiag_93.png|framed|none]] | ||
Latest revision as of 10:59, 26 November 2024
Reciprocating machines generate specific vibration signatures. Dedicated tools associating the machine mechanical characteristics and high performance analysis capabilities are necessary to understand the dynamic behavior of these machines. With EngineDiag, OROS takes on the challenge to offer tool integration in one product in order to enhance test efficiency.
Installation
Equipment required for the installation
USB drive containing Angle-Frequency installation setup “SetupAngleFrequency.exe”.
NVGate software must have been installed first.
Installation of NVGate software
First you need to install NVGate.
Installation of Angle-Frequency option
EngineDiag is a module integrated in NVGate. For the Angle-Frequency option, it's necessary to install a complementary application: 'SetupAngleFrequency.exe'.
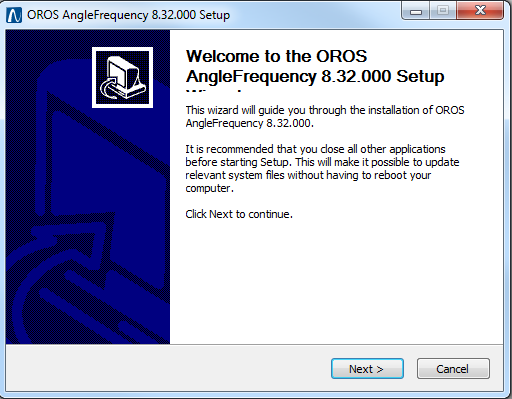
Double click on
![]() and the following window is dispalyed:
and the following window is dispalyed:
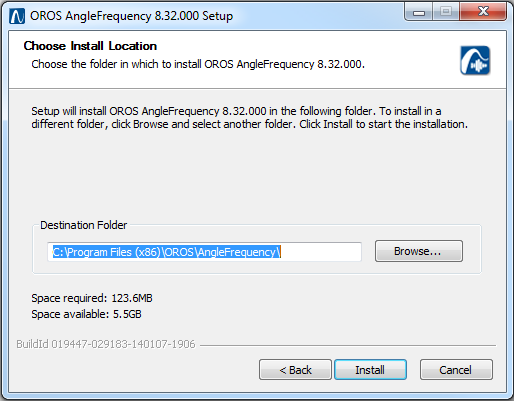
Click on "Next", and the following window is displayed:
Select the destination folder and click "Install".
Note: if you change the default destination folder, be careful to install the Angle-Frequency module in the same directory as NVGate like the example below:
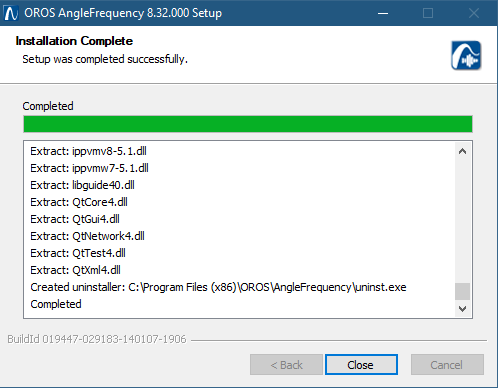
Click on “Install” to start the installation, and wait until the following window is displayed:
Click on “Close” to exit the setup wizard, and OROS EngineDiag is successfully installed.
Environment Configuration
With the EngineDiag module, a new ribbon is available in NVGate. EngineDiag allows you to access to NVGate through an interface, which is dedicated to the engines, and more generally to the reciprocating machines.
Properties
To simplify data saving, history creation and data search, it is possible and recommended to associate metadata to each measurement.
One can determine two types of metadata:
- Properties related to a measurement campaign
- Properties related to each measurement
Properties are defined by default in NVGate but the list of properties can be modified according to the user's need.
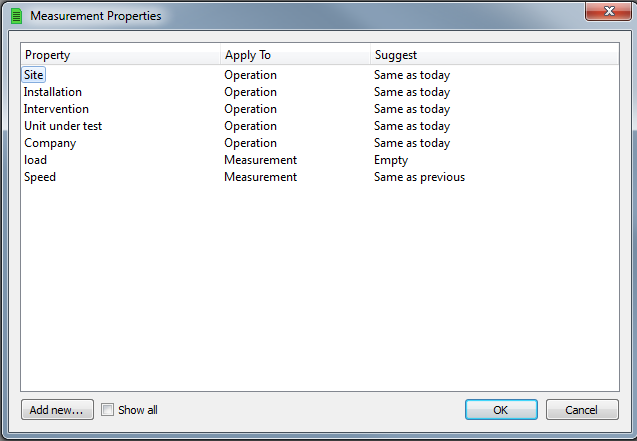
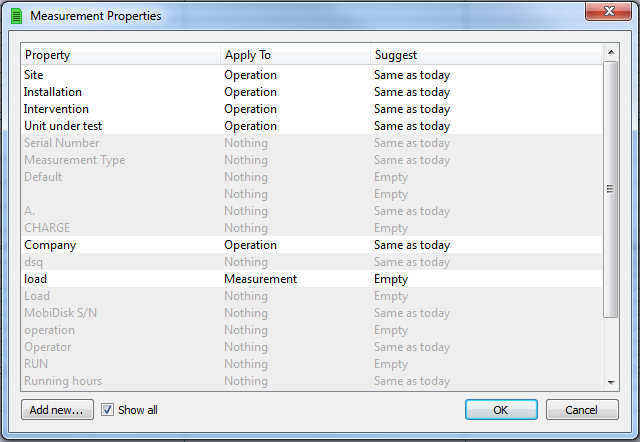
The list of properties is available in the Home ribbon by clicking on Measurement properties.
This window shows all the properties used.
For each property a user can define two fields (Apply To & Suggest):
- Apply to: Indicates where the property will appear.
- Apply to measurement: The property will appear in the save measurement only.
- Apply to Operation: the property will appear in the operation window and in the save measurement window. The user can pre-fill in some of values in the window Operation available in the Engine ribbon.
- Apply to nothing: the property will not appear.
- Suggest
     * Empty: The property is empty by default
     * Same as previous: By default the property keep the last value entered by the user.
     * Same as today: The property keeps the same value during one day. The day after the value is reset to empty.
By selecting show all in this window, all the properties, even those that are not used anymore, are displayed.
Operation
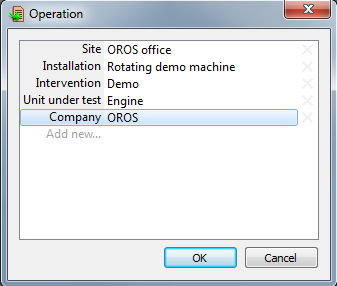
These properties related to a measurement campaign are generally related to several measurements done on the same day and on the same installation. Instead of writing this information for each measurement, it's possible to define the environment once before stating the measurement.
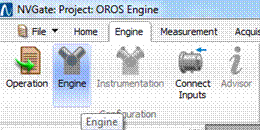
This information can be defined in the operation window available by clicking on the button
 .
.
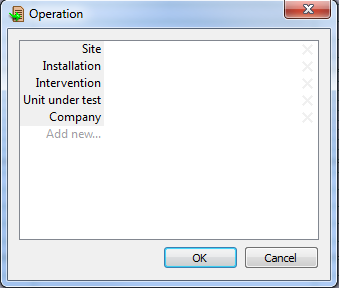
Below are the properties by default:
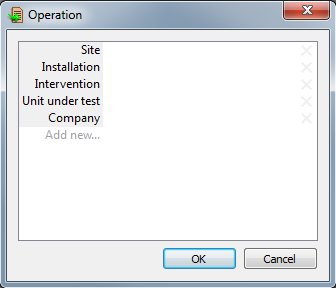
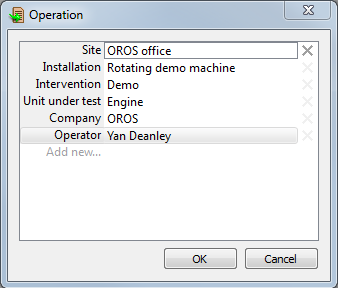
The properties can be defined by what is directly shown in the following example:
At this stage, new properties can be added if needed by clicking on "Add new" in this window
Select "OK".
All these properties will be added to each measurement that is done on this day.
Measurement
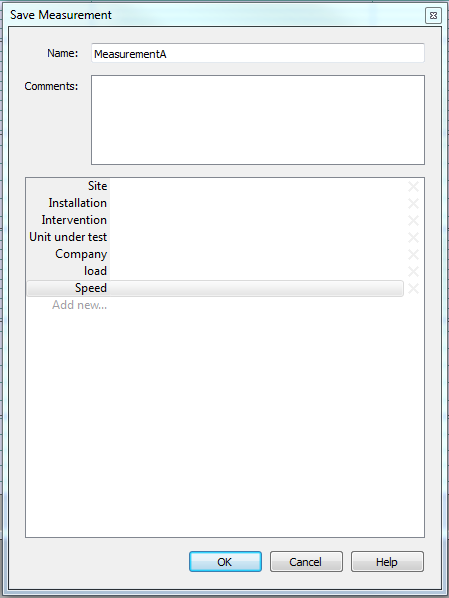
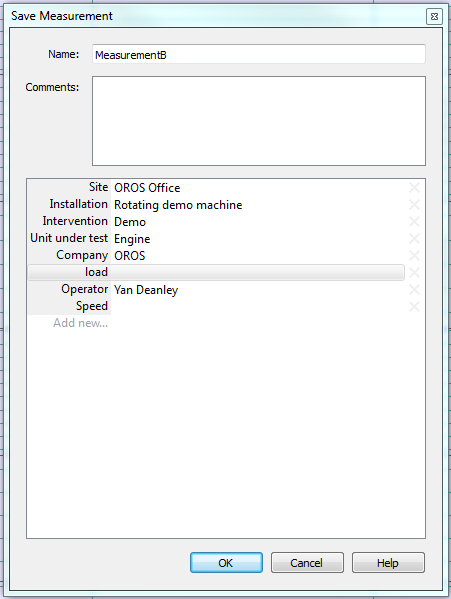
In the "Save Measurement" window, all the activated properties are displayed.
The properties are pre-filled in the operation window and appear with the value defined by the user in the operation window.
Engine Configuration
One of the objectives of the EngineDiag module is to integrate, in NVGate, the physical data related to the engine under test in order to have all this information during the analysis.
The design and the kinematic information can be described by clicking on the button Engine.
The following window is displayed.
From this window a complete Engine model can be described.
An Engine model contains the:
- Engine designation
- Engine settings
- Timing information
- Instrumentation
- Type of analysis applied to this engine
This information can be saved in an independent file .engine, in the NVGate projects and in the measurements.
Engine
From this first panel, several actions are available:
- New: create a new Engine model
By clicking on "new", a default engine model is loaded and the "settings" panel is automatically displayed.
Here, some modifications can be done.
- Load: Load an existing engine model
By clicking on "Load", an existing engine model can be loaded by selecting a file .engine.
- Remove: Remove the current engine model.
- Save as: Save the current engine model to a file.
This panel gives also the model name defined in the settings panel and all the comments written by the user. The field "comments" is saved in the engine model.
Settings
The settings panel allows you to describe the engine characteristics.
The 3 fields: Nominal power, rated speed and cylinder bank angle are here for more information. The results are not influenced by these values.
The other settings will influence the results.
- Cylinder configuration: Free or In Line.
- Engine cycle: 2 strokes or 4 strokes.
- Cylinders number: Indicate the cylinders number.
- Rotating Direction: Clockwise or counterclockwise
With this information, a schematic picture is automatic.ally drawn. The cylinder's names can be modified by clicking directly on them.
On this picture, the small numbers in red represent the firing order. This order can be modified in the panel below the picture.
Timing
The timing information corresponds to the machine kinematics. The cycle of each reciprocating machine is divided in to several phases. These phases are separated by kinematic events. The figure below shows the typical cycle of a 4-stroke diesel engine with the different phases:
The duration of each phase is defined by the valves opening and closing. The position of these events is given in angle relative to the Top Dead Center (TDC) where the piston is at top of the cylinder or Bottom Dead Center (BDC) where the piston is at the bottom of the cylinder.
This information is generally contained in the timing diagram provided by the engine manufacturer.
EngineDiag supports the ability to enter the timing diagram information to be used in the analysis.
The timing panel allows you to describe the timing information generally provided by the engine manufacturer.
- The events table
The events table allows you to define the kinematic events (Intake opening, exhaust opening,…) and position them in relation to the events Top Dead Center (TDC) and Bottom Dead Center (BDC).
An event is defined by two things:
- An angle from the TDC or BDC.
- Its position in the engine cycle.
This information is important for four-stroke engines. It's necessary to know if the event appears in the first or in the second crankshaft revolution. Every modification done in the events table is automatically reported on the two graphs displayed here. At the top, a typical timing diagram and at the bottom the linear engine cycle representation.
A new event can be added by clicking on the
![]() below the events table.
.
below the events table.
.
- The phases table
From the events described in the events table, the different phases of the engine cycle can be defined. Each phase is defined by its start and stop event as well as a color. The settings can be modified by double clicking on the concerned setting.
A new phase can be added by clicking on the
![]() below the phases table. The selected phase can be removed by clicking on the
below the phases table. The selected phase can be removed by clicking on the
![]() .
.
- Tachometer reference
The tachometer reference is the event synchronized to the tachometer that will be used for the synchronous analysis.
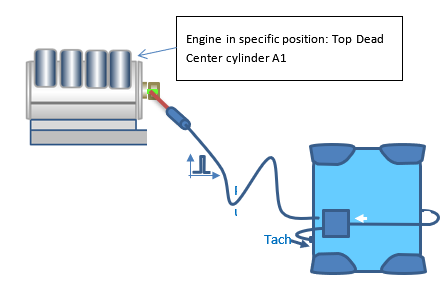
In the example below, the tachometer reference is TDC A1 because the pulse is synchronized with this event.
Instrumentation
The objective here is to describe the instrumentation installed on the engine under test to keep it in memory.
Cylinders instrumentation
This panel displays the instrumentation installed on the cylinders.
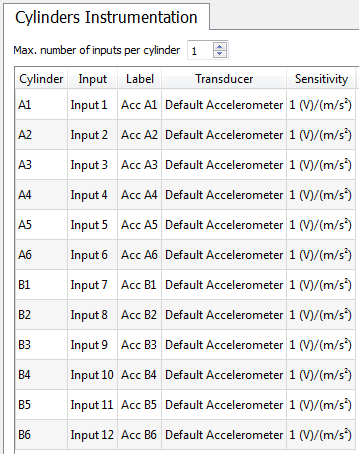
For each cylinder, one can define:
- Analyzer input.
- Label.
- Type of transducer by using the transducer database.
The sensitivity of the selected transducer is automatically displayed.
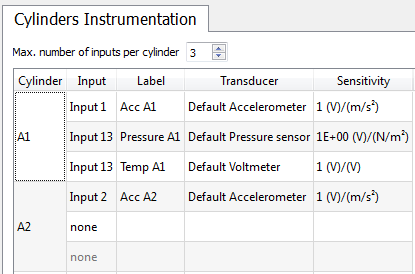
Several transducers can be installed on the same cylinder. You can define the maximum number of inputs per cylinder. See the example below with 3 inputs:
Other instrumentation
In addition to the cylinder instrumentation, others transducers can be installed on the machine.
Several groups of transducers can be defined, which are often associated to a machine part: bearing, absorber...
Double click on "New part" to define the part name and click on the
![]() to add a new part.
to add a new part.
Several transducers can be associated to each part. By selecting a part, the associated transducers are automatically displayed.
By selecting all the parts simultaneously, all the transducers installed on the engine are displayed.
Analysis
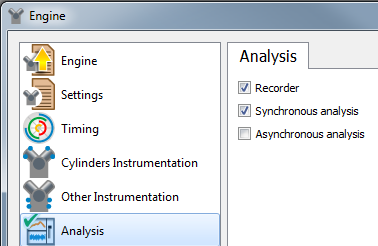
The Analysis panel allows you to select the type of analysis that will be done. This information will be used to help the user to configure NVGate.
- The recorder use the NVGate recorder
- The synchronous analysis uses the Synchronous order plug-in
- The asynchronous analysis uses the FFT plug-in
When the engine model is defined, do not forget to save it in the Engine panel with the "Save as" button.
NVGate configuration
The Advisor
From the parameters defined in the engine model, the Advisor will help the user to configure NVGate correctly.
The advisor is a helpful tool, it's not compulsory to use it for the configuration.
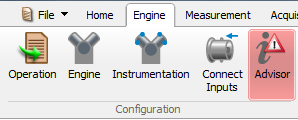
The advisor gives a status about the software configuration depending on the Engine model.
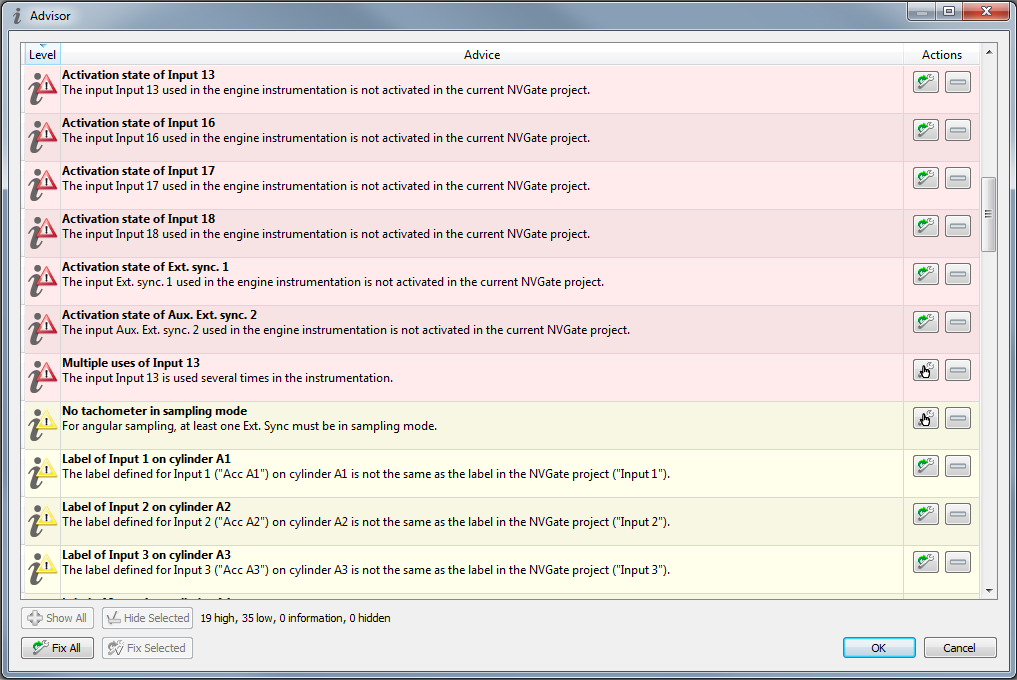
Using different colors, the advisor indicates the current status of the NVGate configuration
| The measurement will not be done correctly. The configuration should be adjusted. | |
| Regarding the type of analysis selected, some settings are missing in order to obtain all the results. | |
| Regarding the type of analysis selected, the NVGate configuration is correct. The user can choose which results he wants to display and start the acquisition. |
By clicking on the Advisor button, all the errors will be displayed with title, explanation and criticality, as shown below.
For each error, the advisor indicates if it can be solved automatically
![]() or manually
or manually
![]() .
.
- Click on
 and it will automatically set up NVGate to solve the error.
 - Click on
 and it will open the window where the user has to do an action to solve the error.
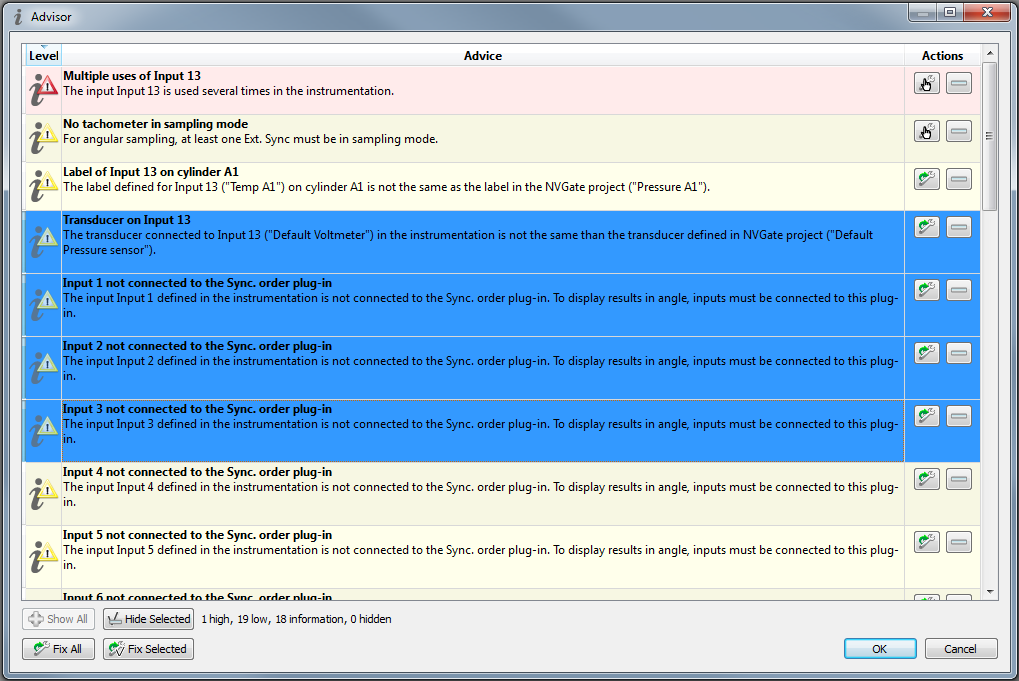
To save time, the ![]() button
allows you to fix all the displayed errors that can be solved automatically.
button
allows you to fix all the displayed errors that can be solved automatically.
The "Fix Selected" button,
![]() , solves the selected errors in the list.
, solves the selected errors in the list.
The advisor gives only advice. The user can read the information and decide to ignore some of the errors. Each error can be hidden by clicking on the button shown below.
The "Hide Selected" function,
![]() , allows you to hide several errors at the same time by selecting them.
, allows you to hide several errors at the same time by selecting them.
All the hidden functions are not deleted. At any time the user can display all of them by clicking on the button
![]() .
.
The advisor displays the important rules to make a correct measurement but the NVGate configuration is not restricted to the advice shown here.
All the capabilities of NVGate are available. The user can complete this first configuration to perfectly adapt it to its application.
The Dedicated Results
With the Engine Module, several dedicated results are available.
These results can be displayed through the "Add/Remove window" available in the ribbon "Display/Graphs".
And also in the ribbon "Engine".
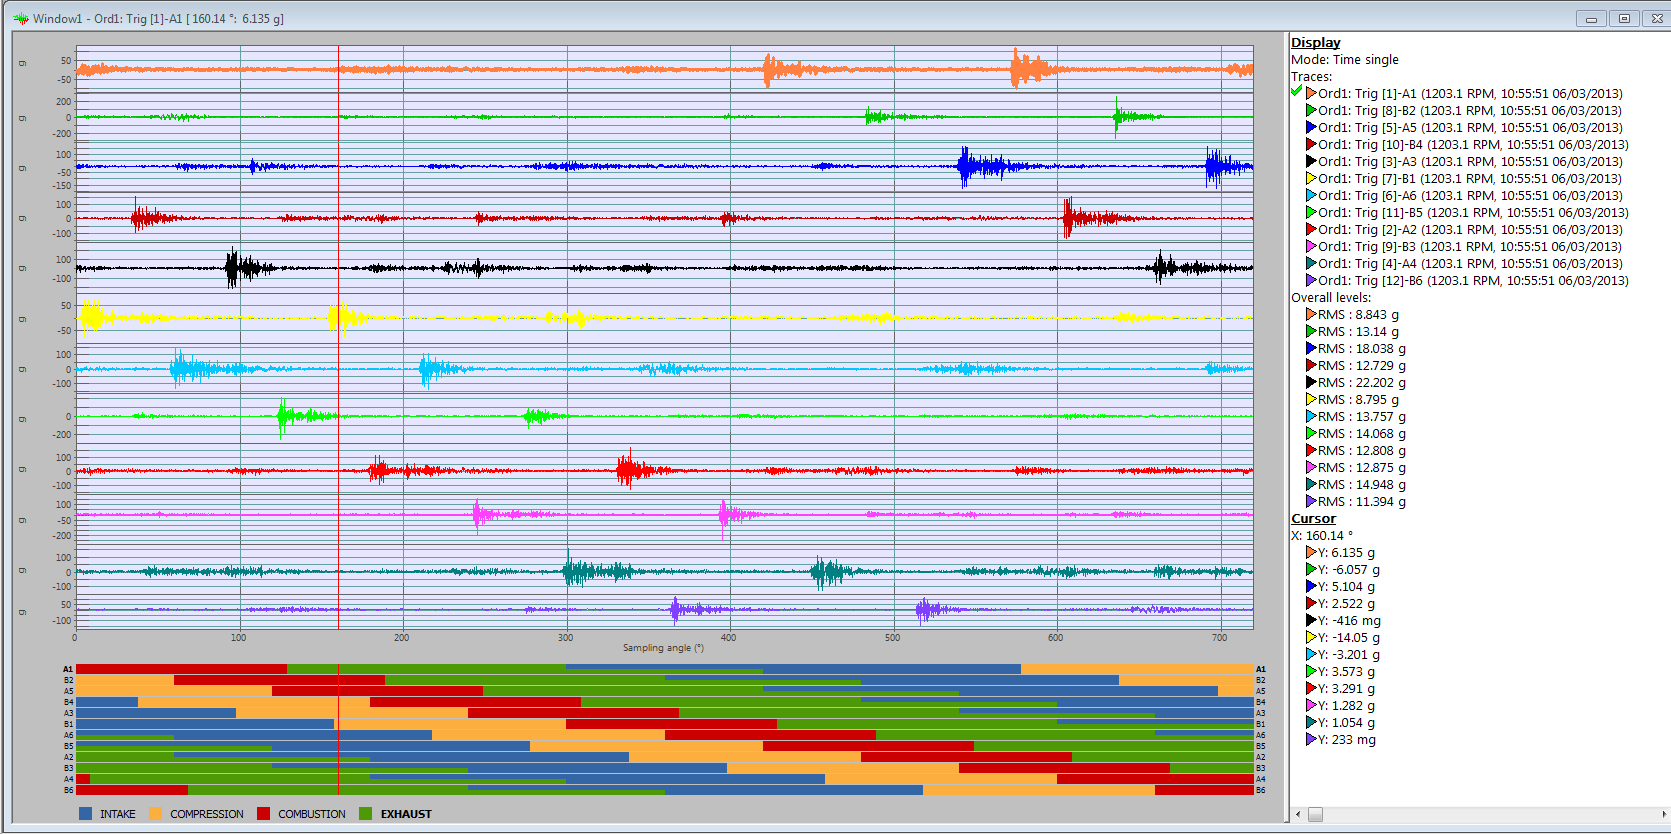
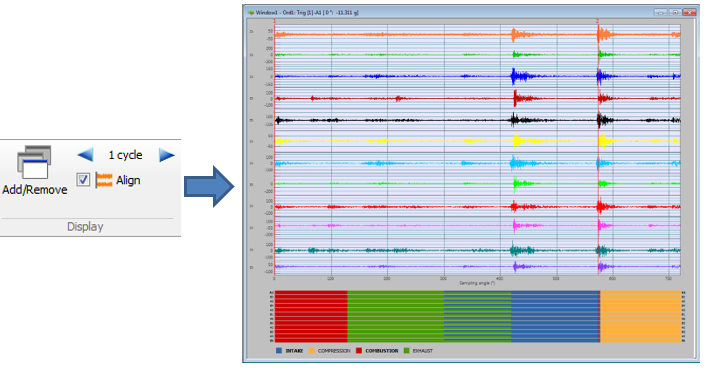
Time signal - The Triggered Block Engine
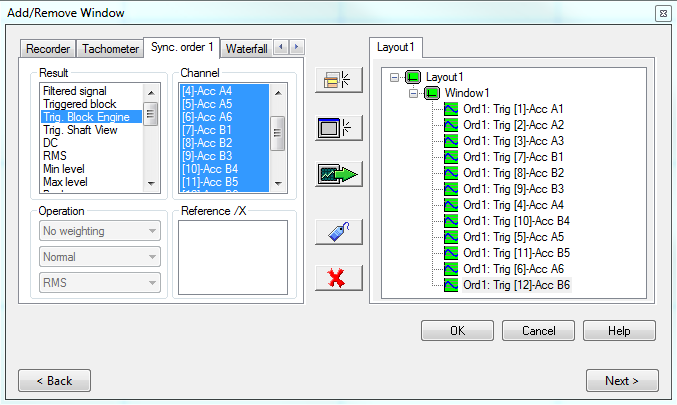
The triggered block engine is a new result of the Sync. order plug-in associating the engine information to the standard synchronous triggered blocks.
Select the results as below:
The following window will be displayed:
Specific features:
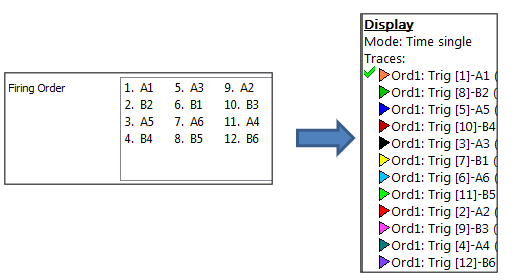
- The results are displayed automatically in the firing order defined in the window Engine/Settings
The cycle overview (defined in Engine/Timing) of each displayed cylinders are shown at the bottom of the window. The cycle overview of each cylinders is determined by:
- The tachometer reference.
- The firing order.
- The timing diagram.
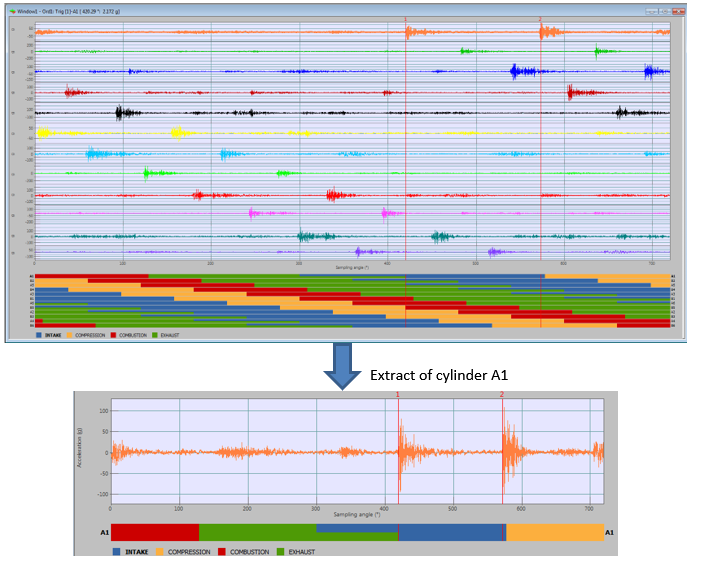
2 cursors displayed on the signals and the cycle overview allow you to identify the kinematic events on the signals.
On the example above the cursors are positioned at the beginning of the 2 main events of the signal. Looking at the cycle overview, one can note that:
- The first cursor corresponds to the end of the exhaust phase, i.e. the exhaust valve closing.
- The second cursor corresponds to the end of the intake phase, i.e. the intake valve closing.
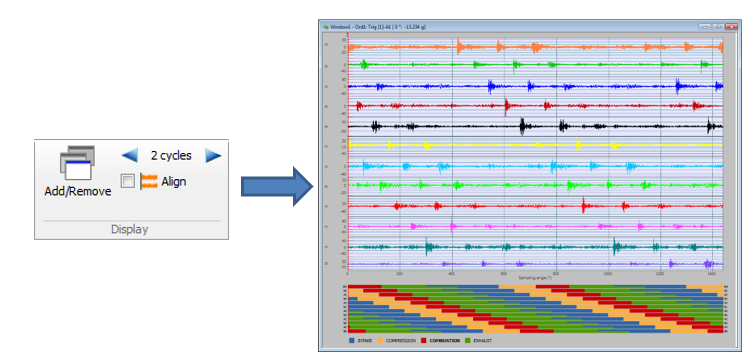
- By default, only one cycle is displayed in this window, 360° (crankshaft angle) for a 2-strokes engine or 720 ° (crankshaft angle) for a 4-strokes engine. More cycles can be displayed. The number can be defined in the Engine Ribbon.
The max number of cycles that can be displayed depends on the order resolution defined in the Synch order plug-in.
| Order resolution | Max number of cycles for 2-strokes engine |
Max number of cycles for 4-strokes engine |
| 1 | 1 | 0 |
| ½ | 2 | 1 |
| ¼ | 4 | 2 |
| 1/8 | 8 | 4 |
| 1/16 | 16 | 8 |
| 1/32 | 32 | 16 |
The signals can be aligned on the same event by selecting the 'align' function in the Engine Ribbon.
Comparison
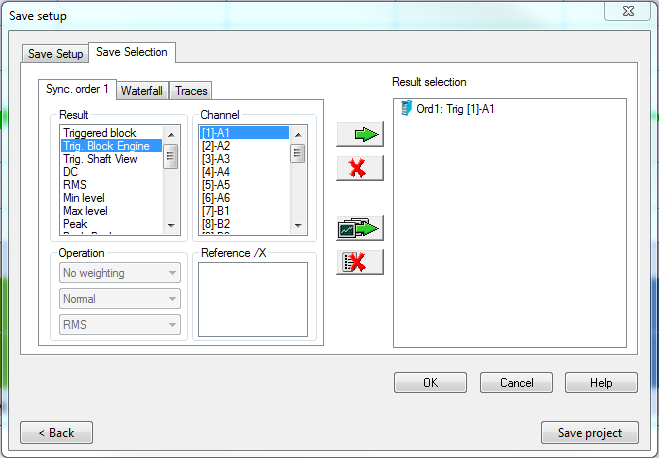
This Trigger Block Engine result can be saved as any NVGate result. Add the results in the "Save Selection" tab, which is available in the "Save Setup" window, which is accessible in the Measurement Ribbon.
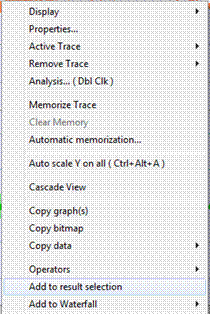
Otherwise, right click in the window and click on "Add to result selection", like below.
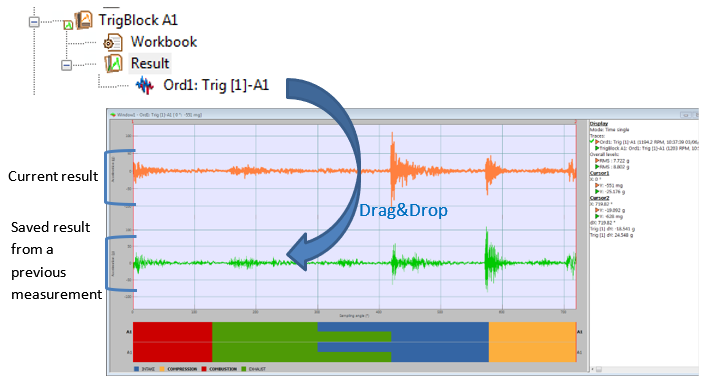
The new saved results will appear in the Project Manager.
The saved results can be compared between them or with a current result in the same window.
To add result in a window, drag&drop the result from the project manager to the window.
The cycle overview of each of the measurements is also displayed.
The Averaged RMS Engine
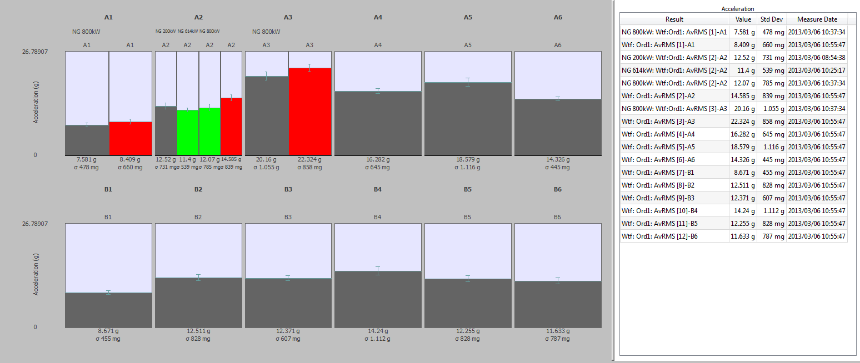
The Averaged RMS Engine is a result available in Waterfall, allowing you to display the RMS level of the cylinders calculated on the engine cycle and averaged on the measurement.
This new result is based on the RMS level calculated in the Sync. Order plug-in.
Select the results as shown below:
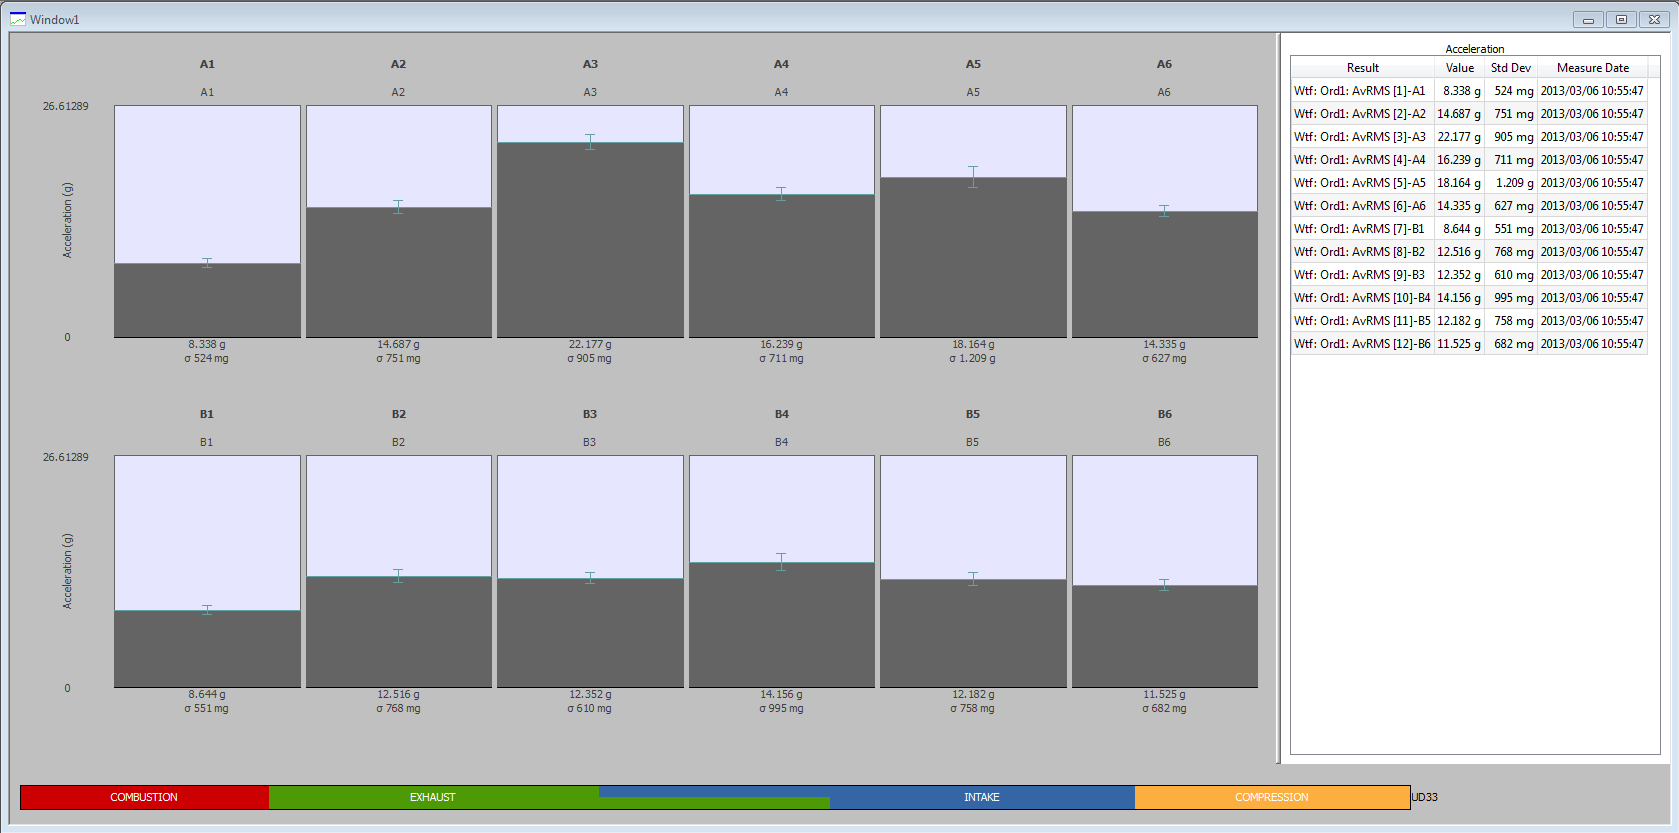
The following window will be displayed:
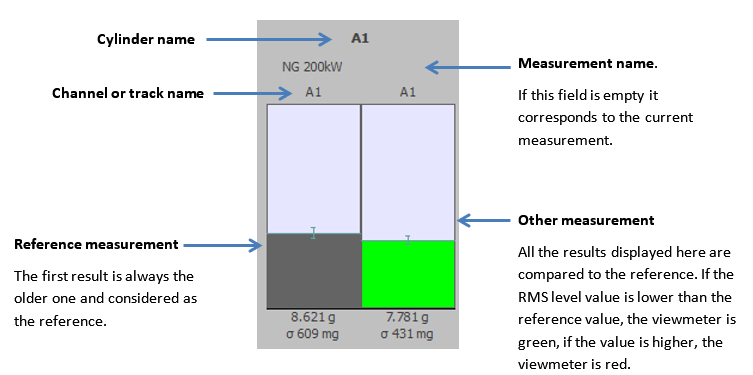
This window shows the averaged RMS value on the engine cycle for each cylinder. The viewmeter indicates the value and the symbol
![]() represents the standard deviation.
represents the standard deviation.
These values are all displayed in a summary table in the infotrace.
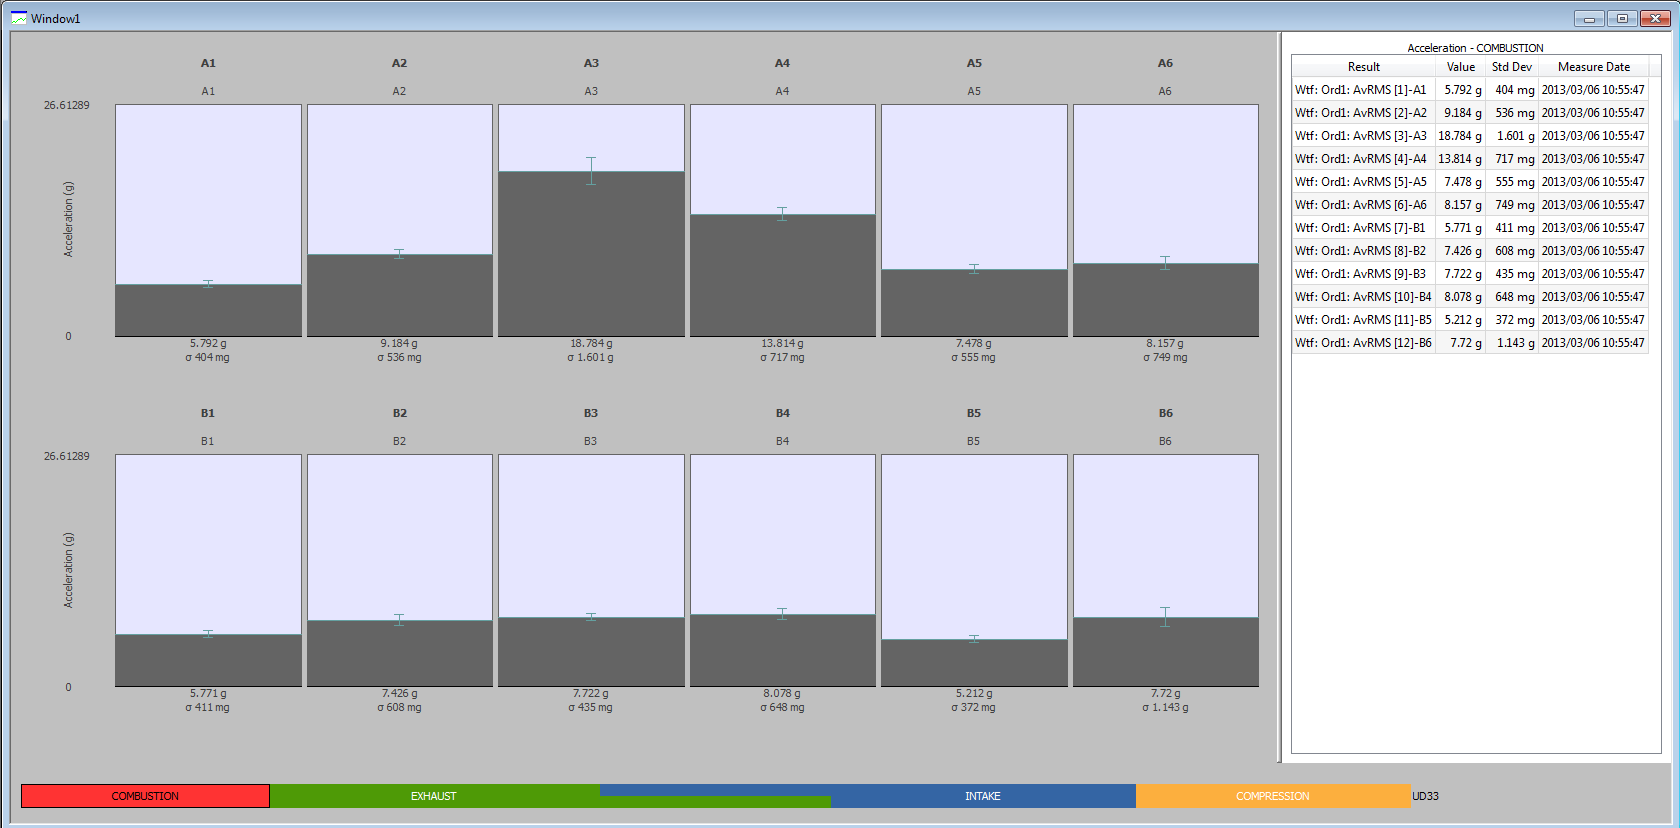
After a first visualization of the global RMS level calculated on the complete cycle, it's possible to display the RMS level of each phase of the cycle; typically the combustion, the exhaust, the intake and the compression.
To display these results, click on one phase of the cycle overview displayed at the bottom of the window.
Below the RMS level is calculated during the combustion.
To come back to the global RMS level calculated on the cycle, double click on the cycle overview.
Comparison
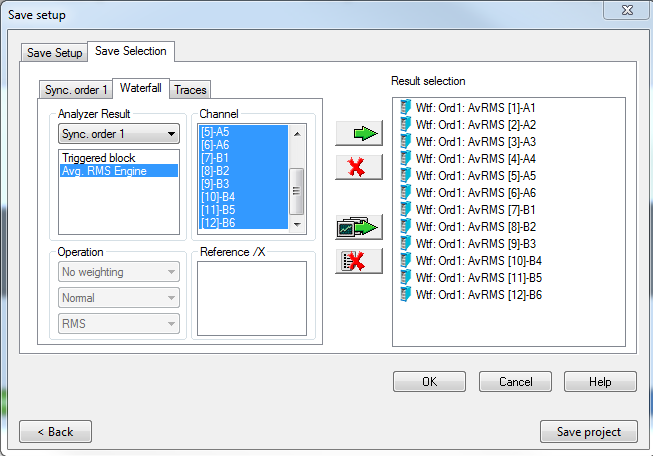
This Avg. RMS Engine result can be saved like the other NVGate results. Add the results in the "Save Selection" tab available in the "Save setup" window, which is accessible in the Measurement Ribbon.
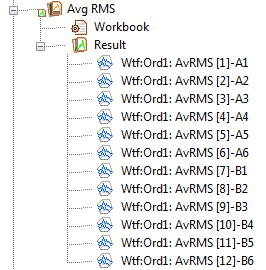
The new saved result will appear in the Project Manager.
To compare results, drag & drop the results from the Project Manager to the window.
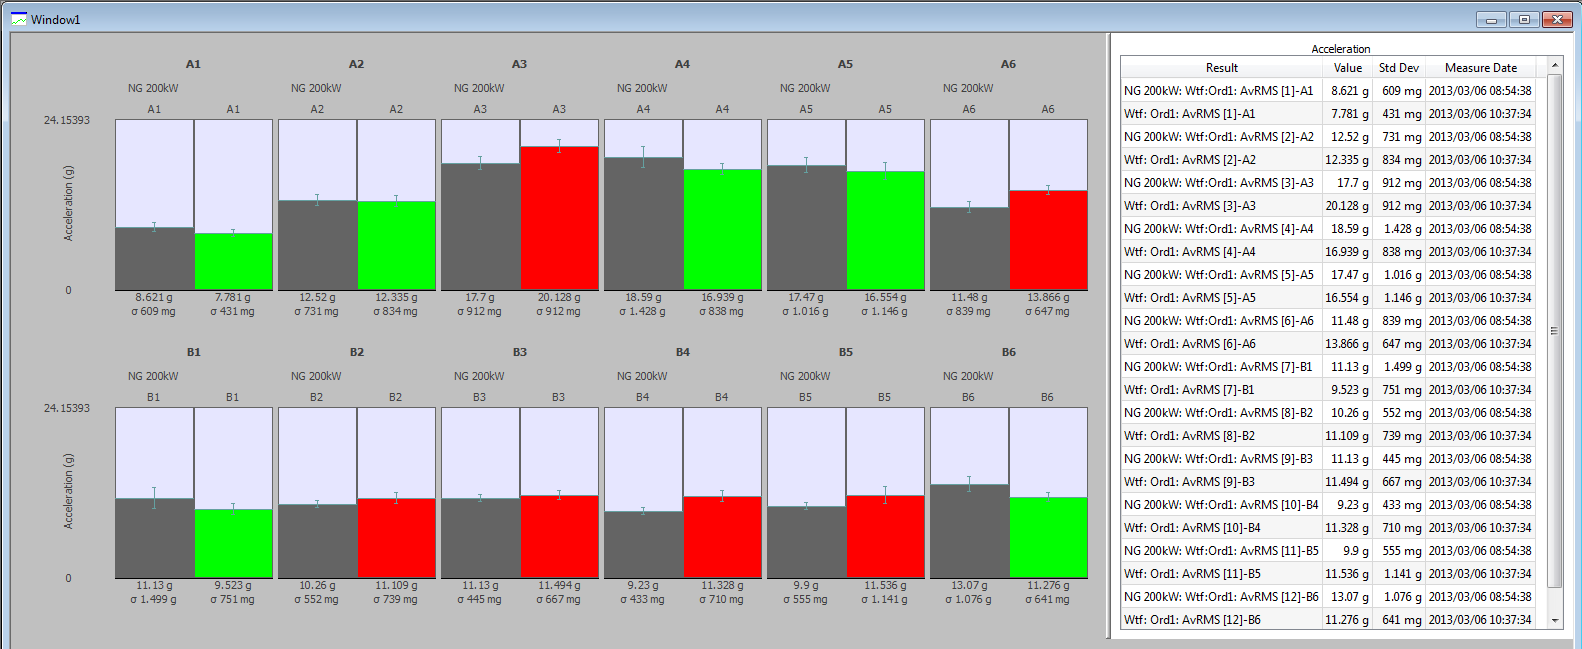
The software will automatically arrange the results by cylinder and date. The results are grouped by cylinders and the first result displayed is the oldest one.
There is no limitation regarding the number of results that can be displayed at the same time.
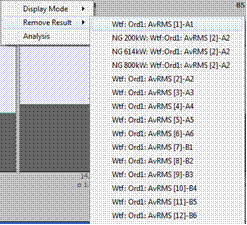
To remove results, right click on the window, select 'Remove Result' and the results you want to remove.
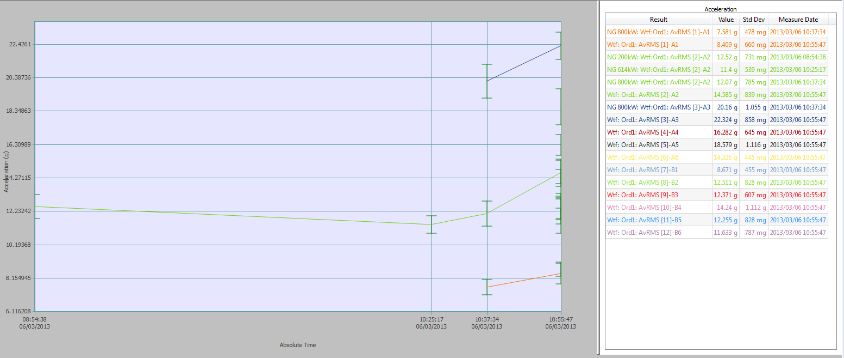
This display allows you to compare a few measurements. To make a trend analysis on several measurements, it's possible to change the display mode.
The 2 modes are available by right clicking on the window and selecting "Display Mode".
The History mode shows the values with the standard deviation in absolute time. It allows you to follow the parameters during a long period.
In this representation, a color is associated to each cylinder. The same color is used on the graph and in the results table in the infotrace.
Angle-Frequency Analysis and Display
Angle-Frequency analysis is interesting when working on a reciprocating machine. It allows you to identify specific events.
The method implemented in the software is based on the Wigner-Ville algorithm.
This method is particularly adapted for short transient signal where the STFT is not sufficient. Another advantage is the good resolution, both in angle and frequency, that one can obtain.
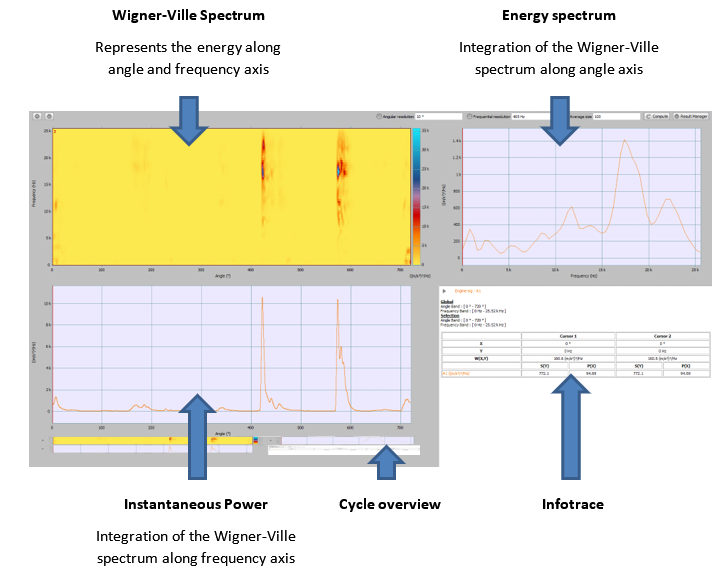
The principle is to represent the energy density on a colorspectrogram using the Wigner-Ville distribution (W (θ, f)). The relevance of the results of such analysis depends on settings including angle and frequency resolution.
From this representation, additional results are extracted to make the analysis easier. They correspond to the integration of the energy densities on the engine cycle and on a selected frequency range. They are defined as follows:
- Energy spectrum S (f ) = òS (q,f )dq
- Instantaneous power P (q) = òS (q,f )df
This analysis is available in post-analyze only.
A Dedicated Window
Before starting, note that this analysis is available in post-analyze only.
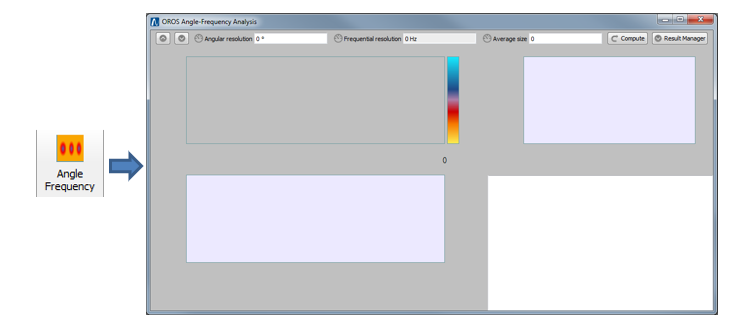
If a signal is loaded in the player, click on the button "Angle-Frequency" in the Engine Ribbon to open the following dedicated window:
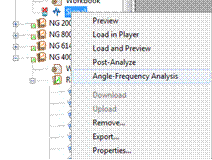
It's also possible to use the "Angle-Frequency Analysis" on another signal not loaded in the player.
In this case, right click on the concerned signal in the project manager and select "Angle-Frequency Analysis".
Result Manager
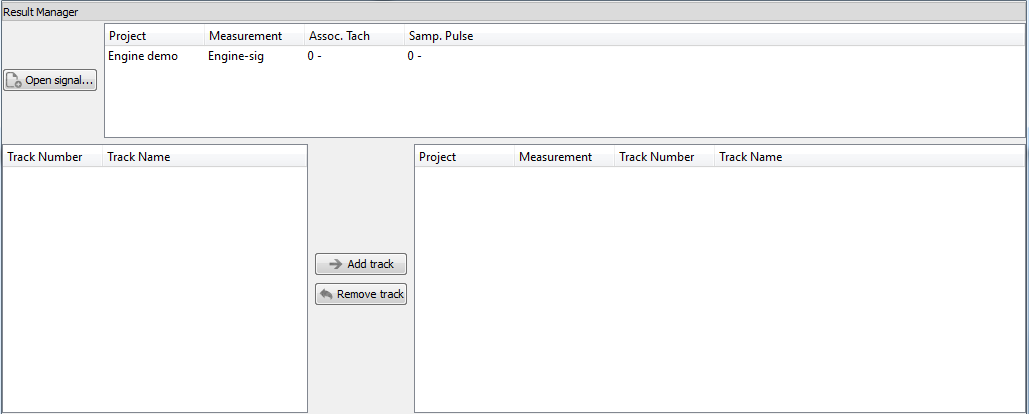
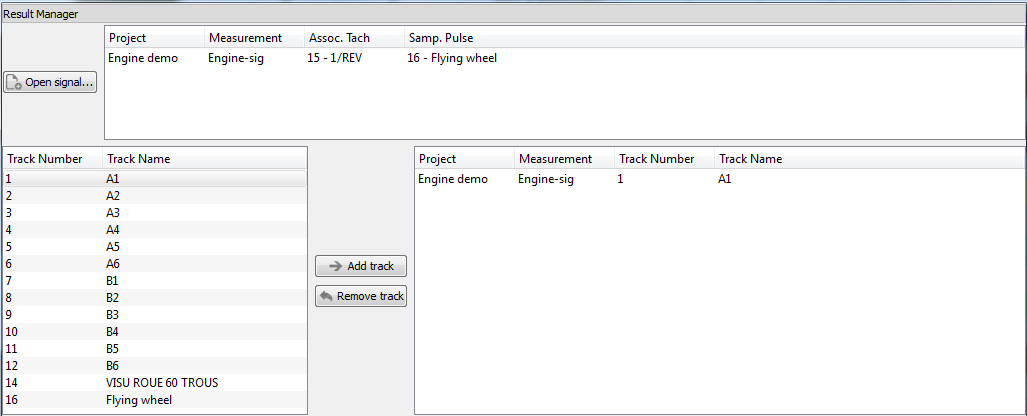
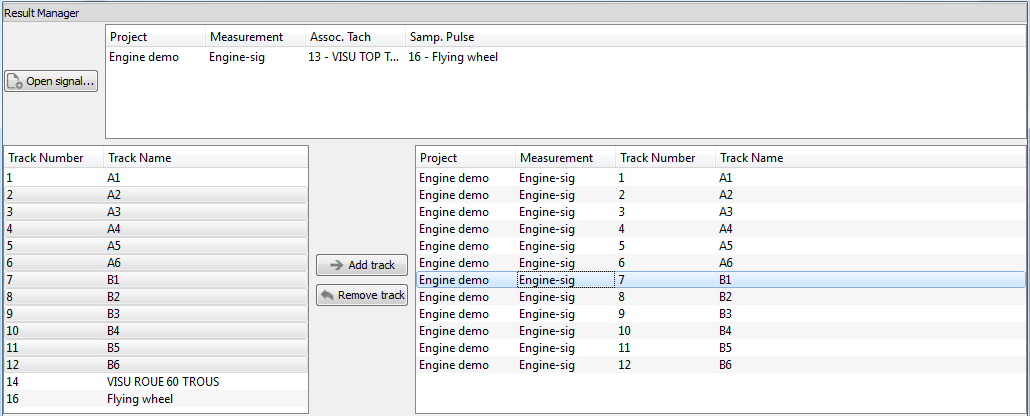
The Result Manager shows the signal(s) and the tracks that will be analyzed in angle-frequency.
Click on the button ![]() . The following part of the window will appear.
. The following part of the window will appear.
Signal One can see the selected signal name and the corresponding project.
It's possible to open several different signals in a same window by clicking on "open signal".
Tachometers The second step is to define the tachometers that will be used for the analysis:
- Assoc. Tach: Here you can define the tachometer that will be used for the synchronous analysis.
- Samp. Pulse: Indicate the tachometer that will be used for the angular sampling. This signal must contain several pulses per revolution and will lead to a better accuracy in angle. Nevertheless, it's not necessary to define a sampling pulse. The angular sampling can be done with the Assoc. Tach. In this case, set this parameter to none.
Tracks Select the tracks that will be analyzed and displayed and click on 'Add track'. If several signals are loaded in the window, the displayed tracks list will depend on the selected signal. Select each signal one by one and choose the tracks for each of them.
After this first step, it's possible to click again on ![]() to reduce this window section.
to reduce this window section.
Settings
Three parameters have to be set up: the angular resolution, the frequential resolution and the average size. They can be modified in the window bar:
Angular resolution: this parameter determines the angle that separates two values in the angle axis. The maximum resolution can be determined in function of the machine. For example, working on a 4-strokes 12 cylinders diesel engine, the angular resolution must be lower than 720/12= 60° to be able to differentiate all the events on the different cylinders.
Frequential resolution: This parameter determines the frequency that separates two values in the frequency axis. Average size: This parameter is the average number used to calculate the Wigner-Ville spectrum. For this result, the average is made on the engine cycle (720° for a 4-strokes engine and 360° for a 2-strokes engine). In most cases, set the average number to 100 leads to good results.
When these parameters are set up, click on ![]() to launch the computation and display the result.
to launch the computation and display the result.
Results
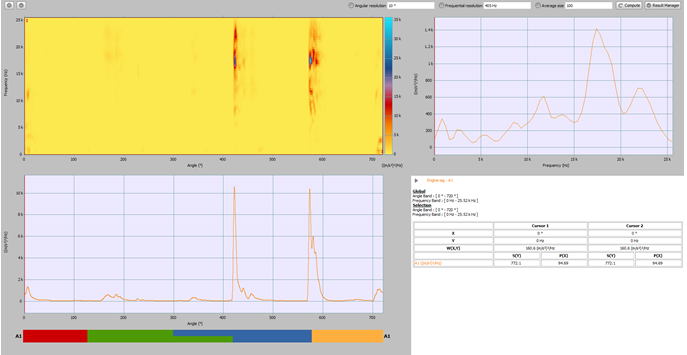
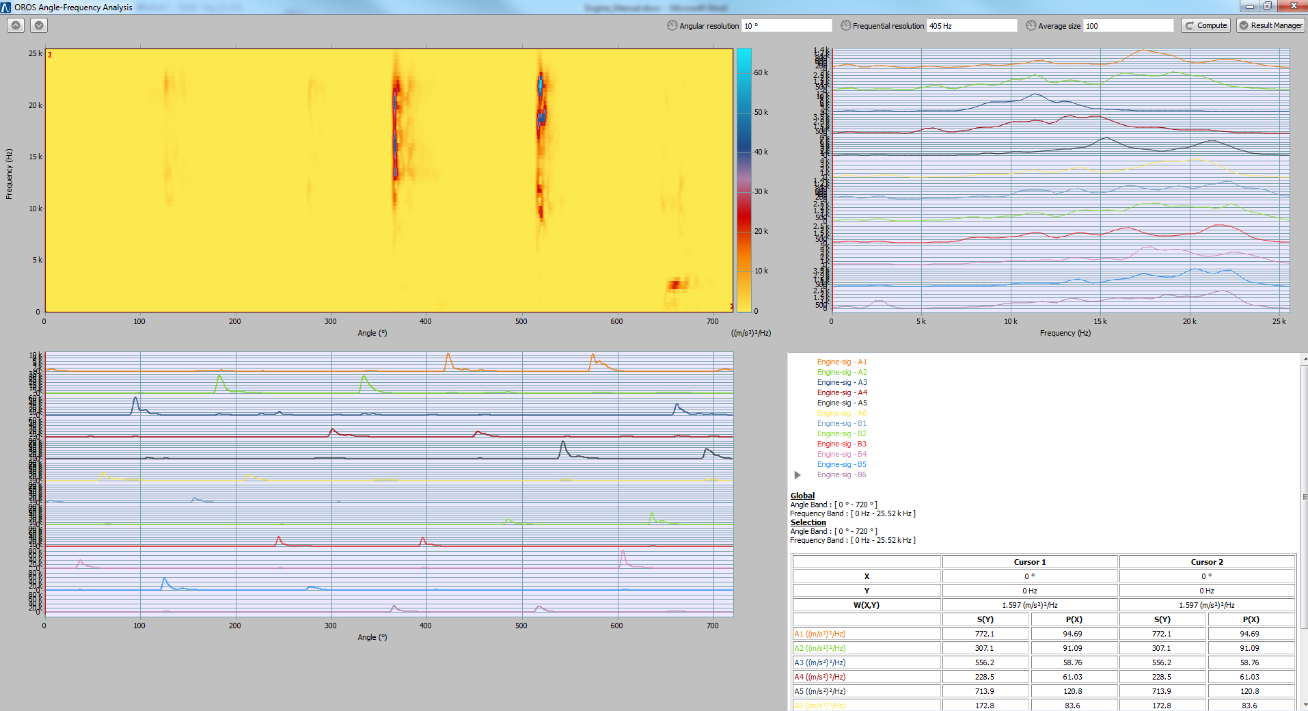
The window is shared in several parts to present all the useful information.
Display Tools
Each graph can be maximized by clicking on the following button in the top right corner of each graph. Move the mouse over this area to let the button appear.
In the same way, click on the following button to come back to the default view.
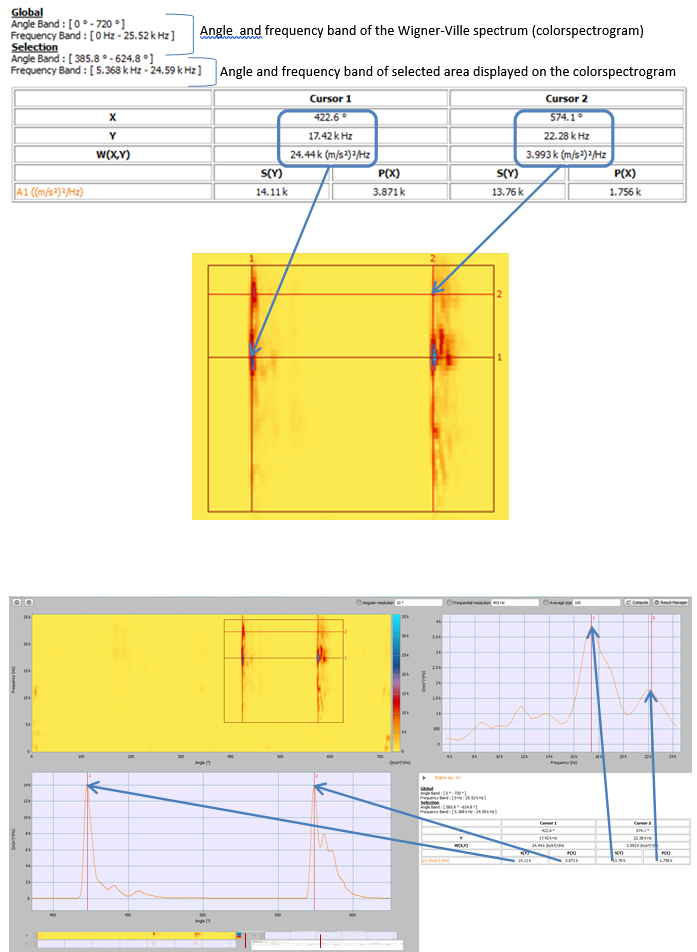
Cursors By default, the energy spectrum and the instantaneous power are calculated from the complete colorspectrogram.
With the mouse, it's possible to select a part of the colorspectrogram and calculate the energy spectrum and instantaneous power from this selection.
The previous selection can be moved and modified. The results are automatically adjusted depending on the selection.
Double click on the colorspectrogram to come back to the selection by default (the complete colorspectrogram).
2 vertical and 2 horizontal cursors are available on the colorspectrogram. The horizontal cursors are linked to the 2 cursors on the energy spectrum. The vertical cursors are linked to the 2 cursors on the instantaneous power and to the 2 cursors on the cycle overview.
All the cursors values are noted in the infotrace.
Comparison
Tracks from the same signal
All the tracks available in the opened signal are shown. Select the tracks, click on add track and click on the button "Compute" to add these results in the window.
Here, one colorspectrogram is displayed. ![]() indicates the displayed tracks.
indicates the displayed tracks.
The buttons ![]() at the left top corner allow you to navigate among the results and visualize the various calculated colorspectrograms.
at the left top corner allow you to navigate among the results and visualize the various calculated colorspectrograms.
Report
To add the angle-frequency results in a report, go to the Report ribbon, select the active Word file and drag & drop the Angle-Frequency icon to the document.
