Difference between revisions of "ORBIGate Manual User's guide"
| (2 intermediate revisions by the same user not shown) | |||
| Line 1: | Line 1: | ||
[[category:WikiOros]] | |||
==Getting started== | ==Getting started== | ||
This chapter is an overview of the main features and set-up steps of the ORBIGate software. More details are provided in later chapters of the operating manual. The Set-Up wizard lets you quickly go through the steps to get started. | This chapter is an overview of the main features and set-up steps of the ORBIGate software. More details are provided in later chapters of the operating manual. The Set-Up wizard lets you quickly go through the steps to get started. | ||
| Line 652: | Line 653: | ||
If among "All displacement points", one of them has its 1X<nowiki>[</nowiki>RMS<nowiki>]</nowiki> component going above 60 microns, then the data record should be started. | If among "All displacement points", one of them has its 1X<nowiki>[</nowiki>RMS<nowiki>]</nowiki> component going above 60 microns, then the data record should be started. | ||
[[Image:ORBIGate_74.png| | [[Image:ORBIGate_74.png|400px]] | ||
''"Alarm start" configuration'' | ''"Alarm start" configuration'' | ||
| Line 680: | Line 681: | ||
The graphics to be displayed are chosen from the "Display type" section on the left side of the "Add/Remove" window. One type of display should be chosen. Then, the test points to be displayed should be chosen and finally the results type. When the selection is done the trace can be added (by clicking on the icon as indicated on the table below). | The graphics to be displayed are chosen from the "Display type" section on the left side of the "Add/Remove" window. One type of display should be chosen. Then, the test points to be displayed should be chosen and finally the results type. When the selection is done the trace can be added (by clicking on the icon as indicated on the table below). | ||
[[Image:ORBIGate_78.jpg| | [[Image:ORBIGate_78.jpg|400px]] | ||
''The add/remove window'' | ''The add/remove window'' | ||
Latest revision as of 11:07, 26 November 2024
Getting started
This chapter is an overview of the main features and set-up steps of the ORBIGate software. More details are provided in later chapters of the operating manual. The Set-Up wizard lets you quickly go through the steps to get started.
The set up toolbar
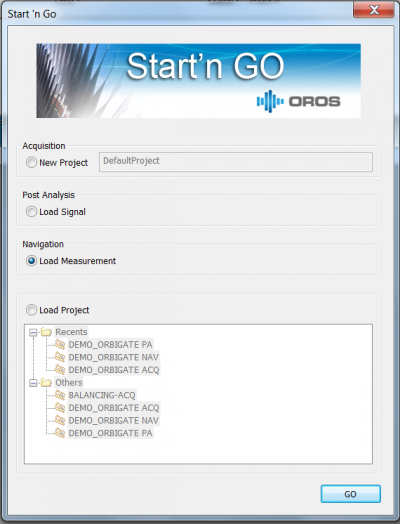
The Start’n Go window appears when ORBIGate software is opened. The user has 3 choices to get started from this window: Create New Project, Load Project and Load Measurement:
- Choosing "Load Project" allows the user to load measurement settings.
- Choosing "Load Measurement", will load the acquired measurement data.
- Choosing "Load Signal" will allow the user to display a measurement based on a recorded signal.
To get started, choose "Create New project" and press GO.
The Start ’n Go window
The next step is to configure the machine train.
The machine train configuration
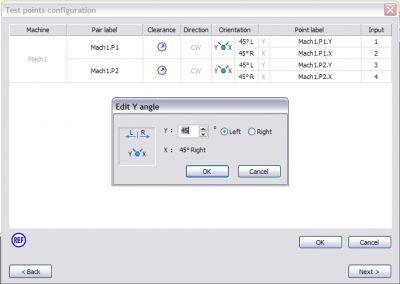
The test point’s configuration screen is where the probe orientations are configured. It is also where the labels can be modified.
The test points configuration
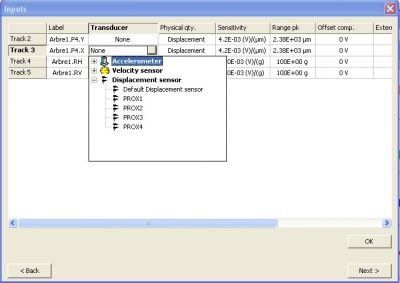
The next step is to configure the analyzer input properties (coupling, sensitivity etc…).
The inputs configuration
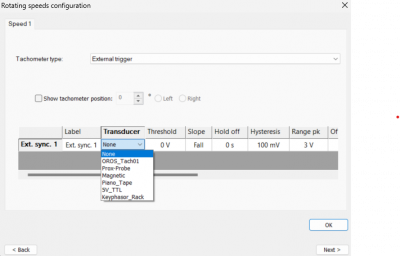
The following step is to configure the speed properties.
The rotating speed configuration
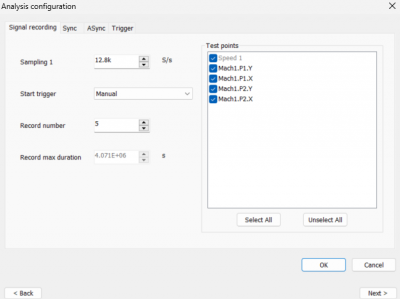
The Analysis dialog box allows for the configuration of everything related to the analysis. There is a choice of 3 types of analysis: Sync analysis, ASync analysis, and signal recording.
The analysis window configuration
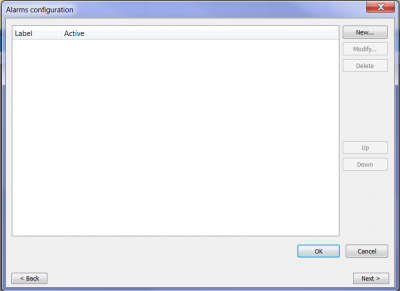
The next step, is the set-up of the alarms: alarm conditions and alarm actions. For the getting started stage, one doesn’t need to go through that step and can just press next.
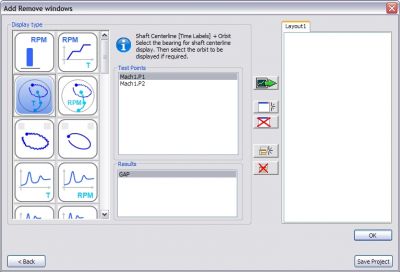
The final step is to display the graphical windows. After choosing the graphical windows, click the "Save project" button to save the project.
The Add/remove window configuration
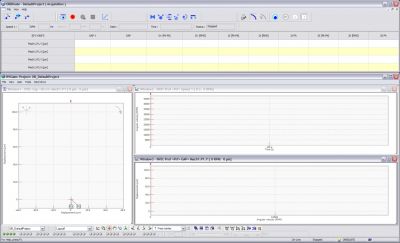
The test is ready to be run. Clicking on the monitoring icon
![]() as shown on the window below, will display the results.
as shown on the window below, will display the results.
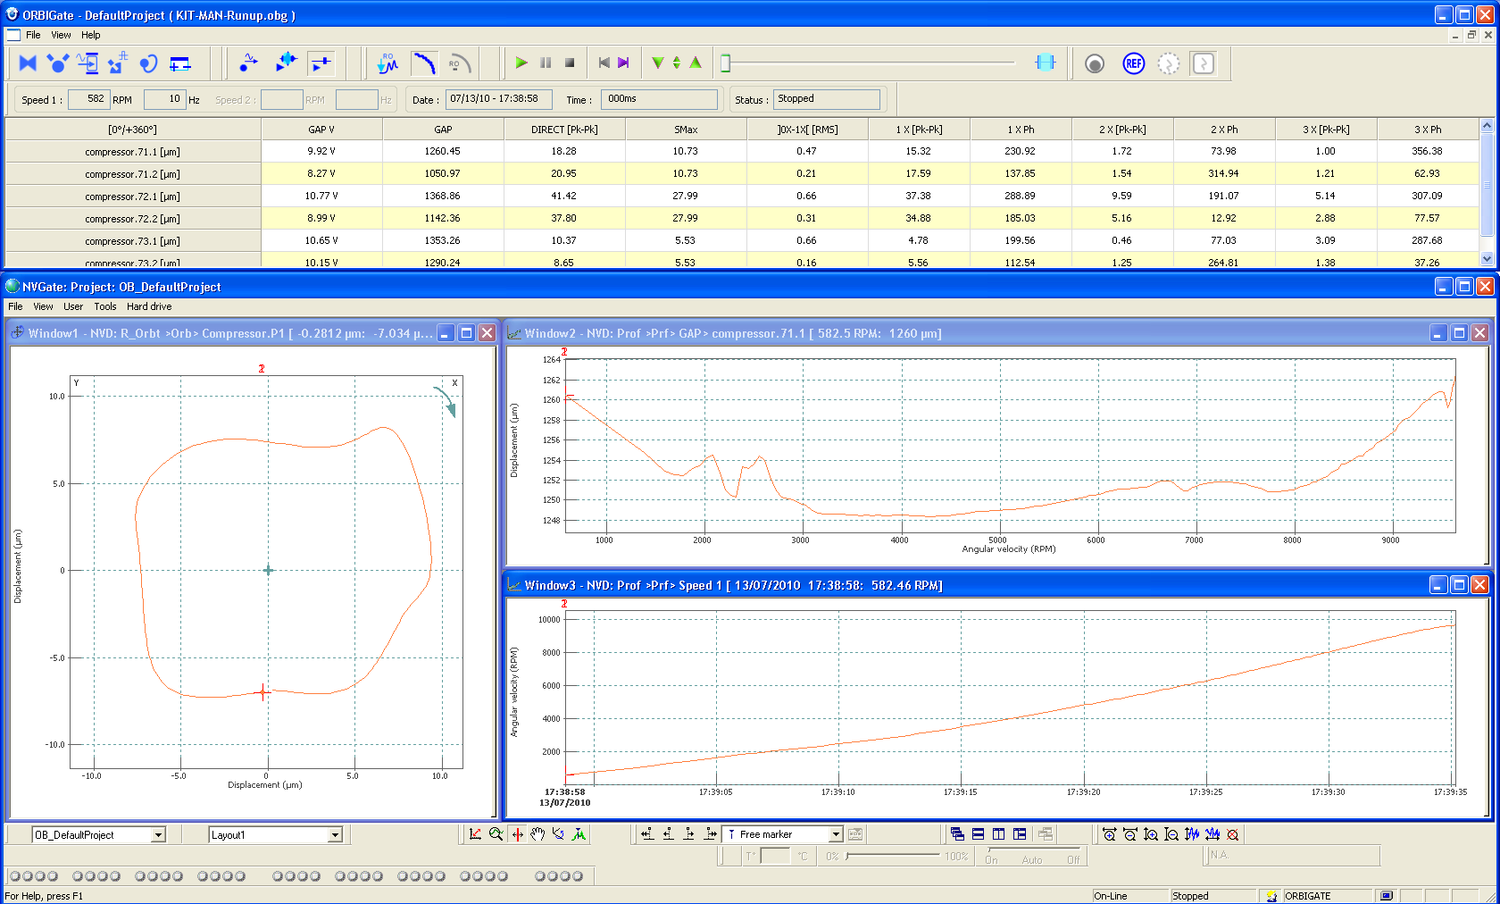
The acquisition working environment
Working environment
Workspace
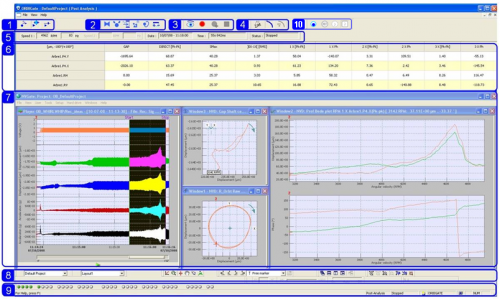
The working environment
The ORBIGate solution interface is made of a number of toolbars and displays organized as in the figure above. The reference indexes from the figure are:
1. Analysis Mode Toolbar
2. Set-Up Toolbar
3. Operation Toolbar
4. Run-Out Toolbar
5. ORBIGate status zone
6. Overview grid
7. Display zone
8. Display toolbar
9. Hardware status zone
10. Clearance circle and reference voltage toolbar
Start’n Go
The Start’n Go function helps the user to immediately start the test or set-up. If a set-up has already been defined, it can be loaded at this stage. Otherwise, a new project can be created.
If the objective is to analyze a measurement, it can be loaded through the Start’n Go interface as shown below.
The Start’n Go window
In order to avoid overwriting project names, the "GO" button is protected: It will automatically be grayed if an existing name is entered.
If the purpose is to go through a post analysis, a signal should be loaded. The signal to be loaded should be located in the current NVGate project database. The signal should contain at least one tachometer channel recorded on the external trigger. This signal can be recorded from NVGate or ORBIGate.
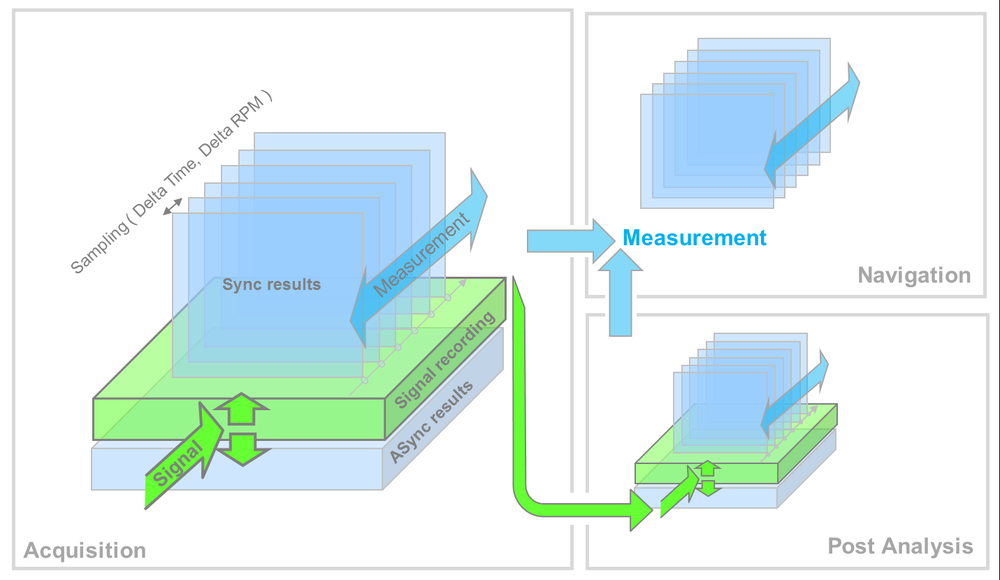
ORBIGate can be operated in three modes: the Acquisition mode, the Post Analysis and the Navigation mode. The user can switch from one to the other by using the operating mode icon toolbar as displayed below. The objective is to investigate measurement data: this is achieved by loading a Measurement File in the Navigation Mode. This measurement can be saved in the acquisition mode or in the post analysis mode.
The 3 Modes
|
|
Project and Measurement Management
Project management and operating modes
Projects are used to save a set-up. It controls both the acquisition set-up and the display set-up.
Projects are saved in the directory defined at the installation and modifiable with the "environment" software. The default path is "C:\OROS\ORBIGate data\Projects". One directory is created for each saved project.
When switching from one mode to the other, it is important to remember that the set-up is not the same. For this reason, the set-up is reset when the user switches modes. It is recommended to save the project when going from one mode to another. Consequently, when going from one mode to another, the following message appears in order to avoid losing the current set-up by mistake. In the figure below, as an example, the message appearing when switching to the Post Analysis mode is displayed.
Switching to the offline mode
Saving a project
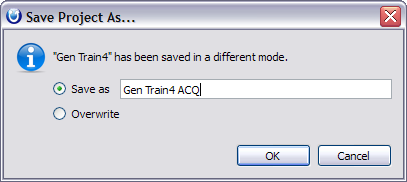
It is possible to save a project in different ways: either at the end of the setup wizard or through the "file menu". When switching from one mode another, it is recommended to save the project in each mode (for example, "test1 ACQ", "test1 PA", "test1 NAV") as the configuration is different. ORBIGate tracks any risks of overwriting projects when changing modes. A project was saved in one of the three modes (Acquisition, Post Analysis, and Navigation). Then, if after changing mode one attempt to overwrite the project, the below message is displayed. It proposes either provide a new name (recommended) or gives the flexibility to overwrite the existing one (not recommended).
Save overwriting check
Loading a project
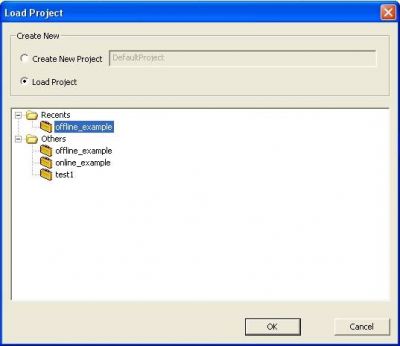
A project can be loaded through the menu and the command "Load…" (As shown in the picture below) or through the Start’n Go window.
Loading a project
Removing a project
It is possible to remove projects through the project windows by selecting the project and pressing "Delete" on the keyboard.
Measurement management
A measurement allows storing data during a test. The data are saved when pressing the record icon. A measurement name is given at the end of the test. The list of data saved is shown in the function table in the "Displays" chapter.
The record measurement icon
Measurement data is saved in a file with the extension "OBG". It is possible to share this file with other users (it is for example possible to send this file through e-mail). In order to be usable, this file should be placed directly in the "ORBIGate data" directory or in one of the projects directory.
By default, the measurement file is saved in the project directory used for the measurement.
Loading a measurement
A measurement is loaded through the command "File/Load Measurement". The following window is displayed. The measurements can be browsed through the measurements database interface.
Files can be sorted based on their:
- Measurement name
- Machine train, Company, Plant
- Project
- Date
- Comments
One can also search for keywords coming from any of the columns. The interface looks as below.
Measurement database interface
Sensor database
The sensor database is a great tool to store the sensors used frequently. When using it, the user can just choose the sensor from the database without redefining them each time. The sensor database should be completed in NVGate before starting ORBIGate.
When using ORBIGate, the sensor can be selected by clicking in the transducer column of the selected input. The sensor database is automatically displayed. Only the appropriate sensors are shown. For the pair points, the usable sensors are accelerometers, velocity probes, and displacement probes. For the mono points all sensors from the sensor database can be used.
Once the sensors are selected, the set-up of the input is automatically done according to the predefined properties of the sensor.
Setting Up the inputs
User preferences
User preferences allow storing set-ups that will be kept from one project to the other.
Path preferences
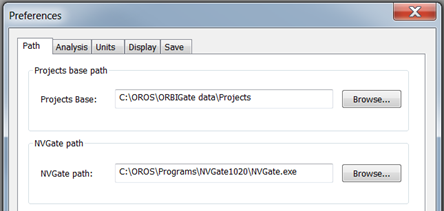
The location of the ORBIGate data can also be specified through this dialog window.
The preferences allow storing the paths used for operating ORBIGate. The NVGate.exe position can be selected at this level.
Path preferences
Analysis preferences
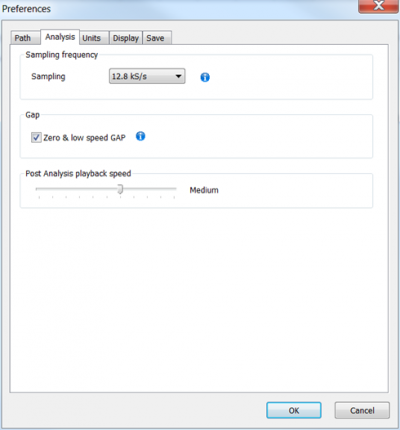
In the preferences, it is also possible to:
- Sampling frequency: Select the maximum sampling frequency allowed for the analyzer. Among others, it enables the user to limit the DSP load. Placing the mouse on the “i” icon will give local contextual information.
- Gap / Zero & low speed GAP: Enable the acquisition in the measurement of the Gap at Zero and low speed from ASync analysis. For that:
- Corresponding ASync channels should be connected
- ASync analysis resolution is recommended to be set to high resolution to fit the low speed conditions (typically at least 0.625 Hz as set by default).
- Post Analysis playback speed: It is possible to setup Post analysis signal playback speed in the user preferences: this allows controlling the post processing speed of the results. Increasing playback speed may introduce down sampling of the results collection in the measurement. It will cause results to be collected less often. When the objective is to control the visualization speed of the results it is recommended to use the navigation mode which is designed for that purpose.
Analysis preferences
Units preferences
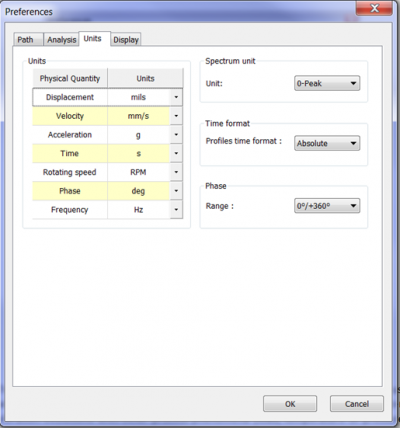
- Units: Users from different countries use different units: it is possible to select the unit used for each physical quantity in the window below.
- Spectrum unit can be 0-Peak or Peak-Peak. It can be modified locally in the window as well.
- Time format: Trends can be displayed with the absolute time or relative time as an X-Scaling. Time scale is especially useful when speed is not changing (steady state measurements) and when one wants to relate the vibration evolutions with other process phenomena (load, temperature or pressure changes). In order to get the absolute dating on the X axis, the corresponding preference should be chosen in the “preferences”, as shown in the window below.
|
|
|
- Phase: The phase can selected to be displayed as 0°/360° or -180°/+180°.
Display preferences
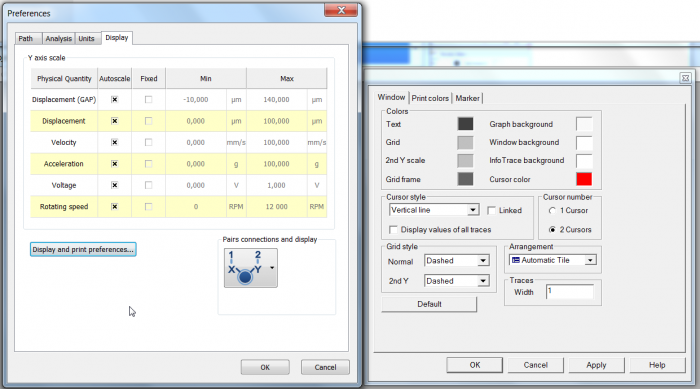
Display and print preferences window
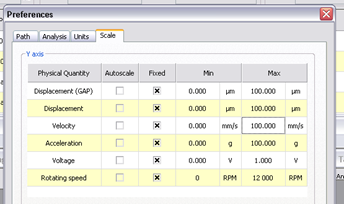
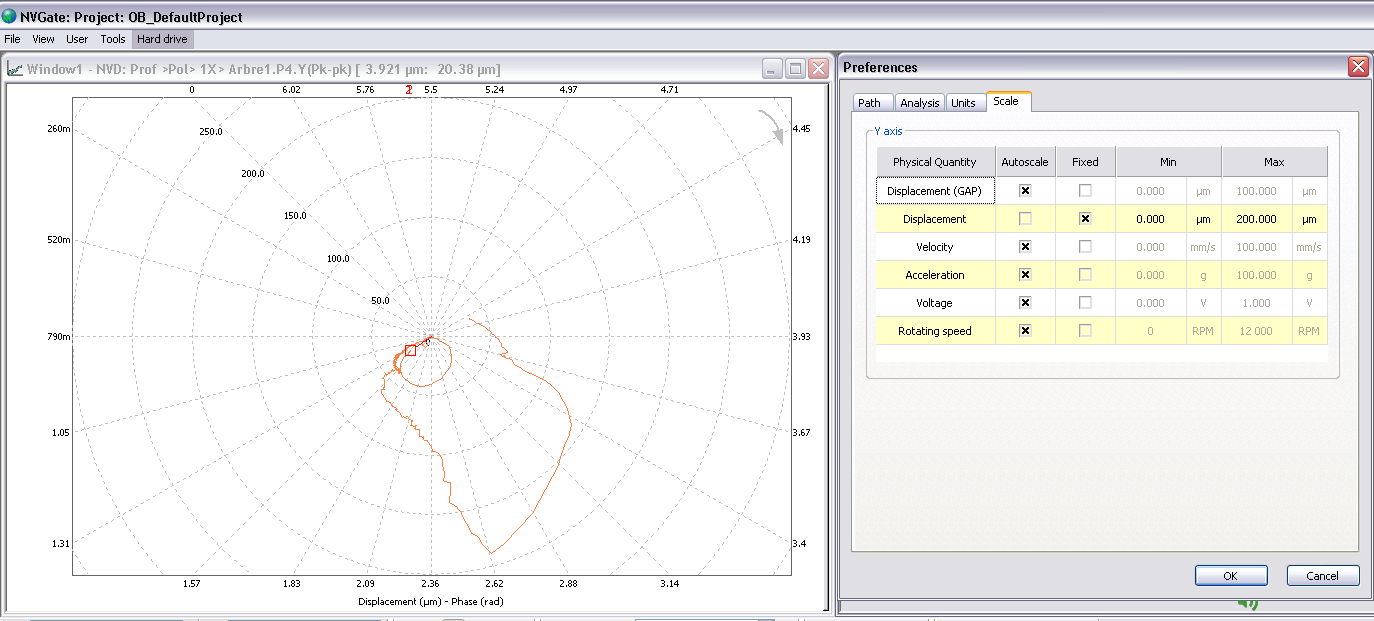
They are two options for the Y scaling settings: Auto scale or Fixed
- "Auto scale" corresponds to an "Auto scale up": the scale grows continuously adapting to the maximum spectrum value.
- The "fixed" allows to setup the maximum value for a graph
These values are defined by physical units (chosen in the “units” tab).
"Auto scale" or "Fixed" Scaling
| To apply the selection, one should press the corresponding toolbar icon to apply the scaling (second icon displayed). This is done for the current layout. The scaling preferences window can be accessed directly by using the “scaling preferences icon”. |
|
XY preferences
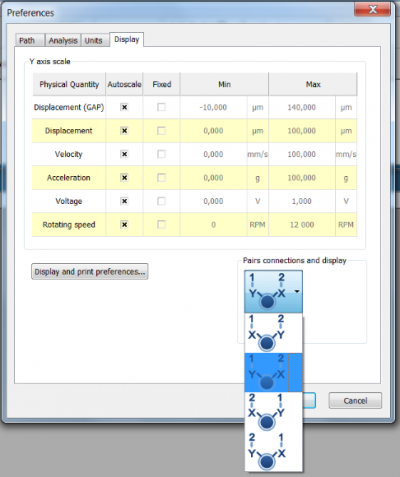
This preference aims at providing a better flexibility for the configuration of the probes positions in the graphics (Orbit, Shaft Centerline and Polar). This is meant to adapt to the different situation that may occur when connecting the systems to the buffered outputs on the online monitoring systems. Note: New XY preferences are taken into account for a new configuration. For example: if a project was saved with older XY preferences, these older preferences will be taken into account. |
Probes connections to the analyzer inputs
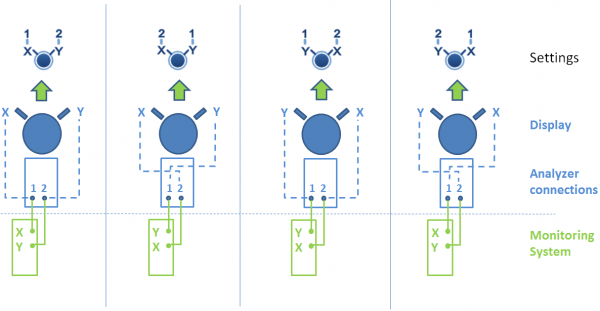
Depending on the buffered outputs connections provided on the online monitoring systems, the user may have to choose between connecting the X first or the Y first. The choice is now available.
Probe connections
XY or YX display
The same preference above allows to choose also if one want to display orbits, shaft centerline and polar with the Y on the left or the Y on the right.
XY or YX orbit visualization
Preferences choices
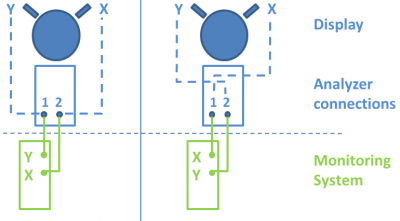
Consequently, there are 4 choices to allow the different configurations they are summarized in the graph below.
4 choices for probes connections preferences
Save preferences
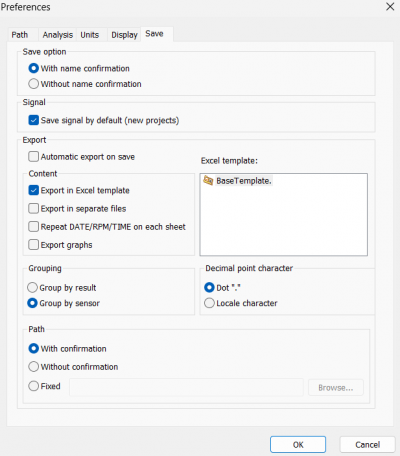
The save preferences options are shown below.
Save preferences dialog
Save
The save option can be “With name confirmation” or “Without name confirmation”.
- If it is set to “With name confirmation”, when pressing stop, a dialog window is issued with fields available for editing the measurement name and comments. This setting is preferably used as a standard.
- In some cases, the choice “Without name confirmation” can be made: in particular when using an automatic stop based on alarms (cf the dedicated chapter for Alarms). The name used to save the measurement is the default one (based on date & time).
Export
Data can be exported either in Acquisition, Post Analysis or Navigation mode.
- To export in acquisition mode or post analysis, the option ”Automatic export on save” should be used.
- In navigation mode, one should use the function “export” from the file menu to trigger the export.
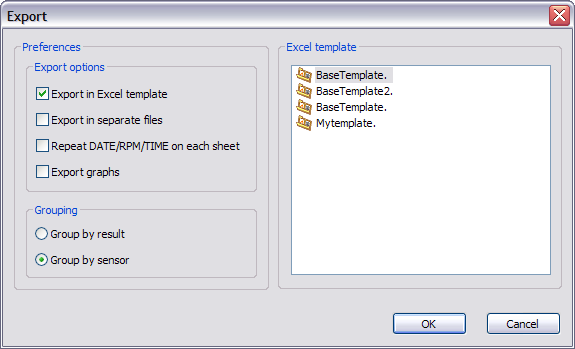
In both cases, the measurement is exported with the choosen preferences as described below.
Content
The export function uses MS Excel to export the data. The exported data are the data contained in the current loaded measurement (data contained in the grid columns).
- An option is also to export the data in separate CSV files.
- Checking the line “Repeat DATE/RPM/TIME on each sheet” will export this information on each spreadsheet of the Excel report
- “Export Graphs” will copy all the graphs displayed currently and paste them in a spreadsheet called “GRAPHS”.
Grouping
The grouping option allows exporting the data by grouping them either:
- By result (one spreadsheet for each type of results)
- By Sensor (one spreadsheet for each sensors)
Once the data have been exported, it is possible to reopen the Excel file and customize it within MS Excel. Then this file can be saved into the directory “C:\OROS\ORBIGate data\Templates” to become a new export template. This new report template can be used for data exported from the same project (same number of channels).
Path
The path of the exported document can be setup using this function. The default path is the directory of the project. It is where the file will be exported if the option “without name confirmation“ is selected.
Set-up
The set-up concerns the acquisition parameters and the display parameters.
Acquisition
Machine train
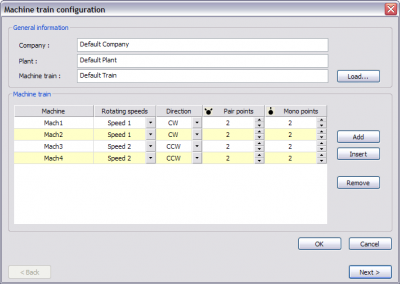
The initial step is to type in the machine train configuration. From that point, a set-up of the inputs is automatically displayed.
First step, the machine train configuration
The interface allows the user to enter a configuration such as the one displayed on the figure below:
A typical machine train
The first step is to enter the general information:
- The company name,
- The plant name
- The machine train name.
This information will be used
- In the report edition.
- It also helps when "loading a machine" as keywords.
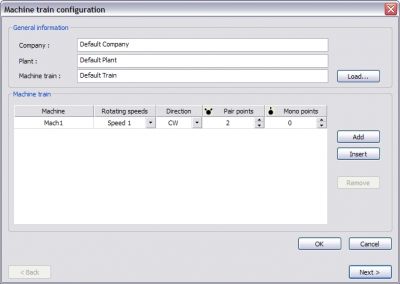
The machine train configuration
Then, it is time to enter the machine train details. It is possible to enter machines by pressing "add" or "insert". The machine name is automatically entered and can be modified by simply clicking in the machine cell.
A rotating speed can be selected. Up to 2 speeds can be chosen for each machine train.
The rotation direction can be selected: CW or CCW
Then, a number of pair points and mono points should be selected:
| Pair points are sensors such as proximity probes that go by set of pairs in order to display Orbits and Shaft centerline. Velocity probes and displacement probes can also be selected. In that case they are automatically integrated to get a displacement physical quantity. | |
| Mono points are extra sensors that come as standalone sensors. Accelerometers or velocimeters or axial proximity probes are typically used. |
Machine train LOADING
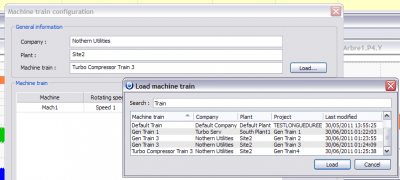
- The Machine train reload function allows loading a machine train that was saved in another project.
- Machine train configuration and parameters reload (inputs, configuration, gap reference etc…).
- Machine train search and sorting by key word: Machine train, Company, Plant, Project, Date.
Machine train loading
It allows reloading the information contained into the two first windows (below).
| Machine train configuration | Test points configuration | |||
Tip: This function is particularly useful when a user switches from the acquisition mode where a signal has been saved to the post analysis mode. Once in the post-analysis mode, it is then easy to reload the machine train of the acquisition project.
Test points configuration
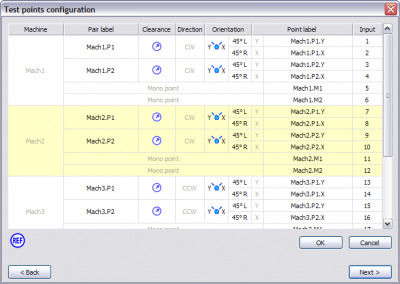
The test point configuration allows the set-up of the properties of the test points: channel label name and probes orientation.
Step 2, the test points configuration
As shown on the figure below, the test point’s configuration allows entering:
- The labels of the pair points
- The Clearance circle radius
- Proximity probes angular positioning: it is possible to choose the orientation of the probes by clicking on the probe orientation icon. The dialog box appears as displayed. The probes orientation can be set by steps of 1°. The angle between the probes is always 90°.
- The label of the measurement point
- The hardware input connection
The test points configuration
The default hardware input connection can be modified as in the figure below. It allows the user for example to inverse channel Y and X if those have been connected inversely.
Input connection choice
- Rotation direction is reminded in the test points configuration window
- Cells can be copy/pasted (including the probe orientations).
Inputs
The input properties are set-up through the input window accessed by clicking on the icon as shown on the figure below.
Step 3, The Inputs configuration
In the input window, the user can enter the setup of the input channels associated to the test points. Most of the input set-up can be collected from the sensor properties chosen from the sensor database.
The inputs configuration
Integration
- Pair points are always displacement values (because they are meant to display orbits). So Accelerometer or velocity probes are integrated once or twice.
- Monopoints can be integrated or derivate as desired during acquisition.
Monopoints integration
Tachometer
Step 4, The tachometer configuration
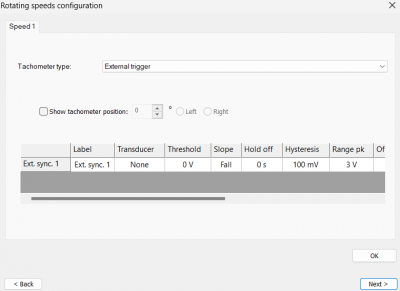
The properties of the speed measurement can be entered in the "Speeds" window: Three different modes are enabled.
The tachometer type can be set-up as: "External trigger". In this case, the speed is measured based on a tachometer sensor plugged to the external trigger channel.
External trigger configuration
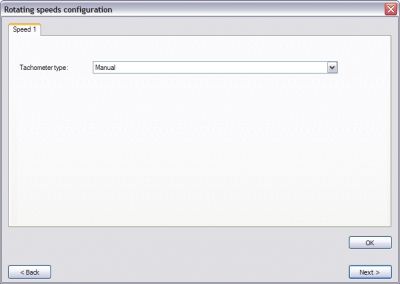
If no speed can be measured, it is possible to use the "Manual" tachometer. This supposes that the speed is stable and is defined by the user in the analysis window. In that case, the user should not rely on the phase results.
The manual tachometer type
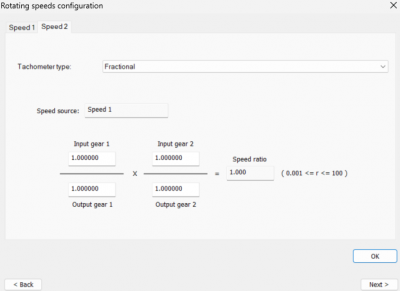
If a gear box is used in between two machines. It is possible to define a tachometer that depends on the ratio between each gear wheel. For that, the type "Fractional" should be selected.
The fractional tachometer type
In this case, it is not necessary to measure the second tachometer. It can be simply calculated from the first sensor and the gear ratio.
Analysis
The analysis set-up window can be accessed through the icon shown below.
Step 5, the analysis set up
ORBIGate is able to complete several types of analysis simultaneously: Sync analysis (Order Tracking analysis for the so called NX data), ASync analysis (FFT Analysis) and Signal Recording for the raw time data recording.
- Sync Analysis is referring to the Analysis Synchronous with the Rotating Speed (results coming from the SOA Analysis). There are two kinds of display X axis for the Sync spectrum: Frequency or Order. The Sync spectrum is available in the Navigation mode.
- ASync Analysis is referring to standard FFT analysis: It also gives a frequency spectrum. It is ASynchronous with the rotating speed: one advantage is that it can be monitored without any rotating speed.
Step 5, the analysis set up
When you press OK on this window, you might need to wait for a few seconds before it actually proceeds. It is the time allocated to connect the analysis plug-ins.
Signal recording
The signal recording allows the user to capture the full time domain signal with no gap. It is also possible to capture the signal by portions: one signal file will be issued. This signal file can be post-processed using ORBIGate or NVGate post analysis module.
The signal recording set-up
- The signal recording can be triggered using a manual start or can be synchronized with the measurement recording.
- The signal can be recorded in every case, including when no tachometer is detected.
Select and Unselect all window
Sync analysis
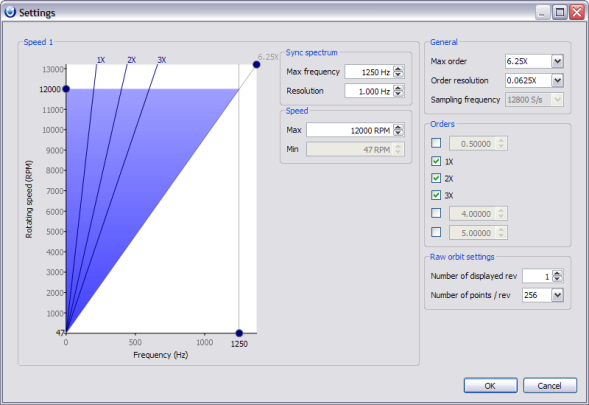
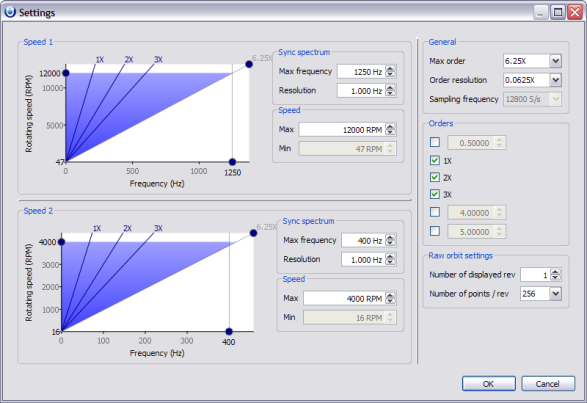
- The "All In One" interactive settings panel has been designed to make the settings as easy as possible for the user by displaying all available choices:
- Order synchronous analysis: Max order, order resolution and selected orders
- Frequency synchronous analysis (Sync spectrum): Max frequency, Resolution
- Rotating speed: Max and Min speed (Ratio between Max and Min speed is 256). When the speed is "manual", its value is chosen here as well.
- Number of displayed revolutions and number of points per rev
Sync analysis settings
Settings can be entered by hand or modified graphically on the image.
NX analysis allows to set-up what orders will be calculated and displayed as:
- NX orbits
- Grid
It is possible to calculate up to 3 default orders: 1X (Order 1), 2X (Order 2), 3X (Order 3) as well as 3 custom orders.
The user can specify how many rotations will be displayed for the raw orbit as well as how many points per rotation.
ASync analysis
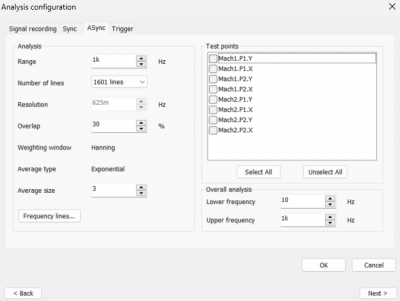
In addition to the NX recording, it can be interesting to acquire an FFT analysis. In that case, the FFT parameters used can be defined in the following window.
An interesting use of ASync monitoring is that it can operate without a keyphasor signal.
Signal recording, Sync, ASync, Trigger
The Overall level between two cut off frequencies can be determined as shown in the window above. This value will be noted as "OvB AS" (it is a RMS quantity).
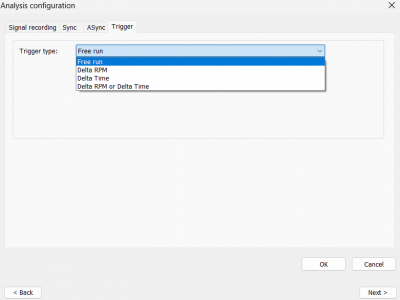
Trigger
Finally, it allows selecting the sampling frequency used for saving the data in the array.
Four different types of triggers are possible:
- Free Run: The data is saved in the array without any specific frequency specified.
- Delta RPM: The data is saved in the array every increase (or decrease) of speed with a defined step.
- Delta Time: The data is saved with a time period.
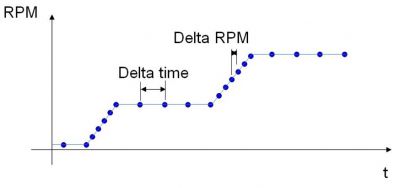
- Delta RPM or Delta Time: The data is saved with a "or" condition. It is saved every DeltaRPM steps or DeltaTime steps depending on which comes first. This trigger type is especially interesting when machines go through a start-up with a sequence of Run-up sessions and stable speeds sessions.
nx Recording, free run sampling
Delta Time is used to collect data for a specific amount of time.
nX Recording, Delta Time sampling
Delta RPM is used to collect data every increase (or decrease) of the rotating speed.
nX Recording, Delta RPM sampling
In some cases it is interesting to be able to mix the two above conditions as shown in the window below.
nX recording, the Delta RPM or Delta Time sampling
As a matter of fact, when the machine start-up is made of run ups and stable speed sequences as displayed on the figure below, it is interesting to alternate the delta RPM condition and delta time. In that case, the software detects which condition comes first. The amount of saved data is optimized: a high sampling during the run up periods (using delta RPM) and a lower sampling during the stabilization periods. These periods can be very long and often don’t have many changes in terms of vibrations.
A typical machine start-up
Alarm conditions and actions
Alarm conditions and actions are set-up through icon 6 of the set-up toolbar.
Step 6, the alarm conditions and actions
Configurating Alarms
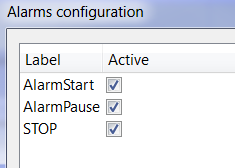
A list of alarms can be created for one particular project. The alarm can be activated or not.
Alarms list
The first thing to do is to give a name to the alarm. For example, "AlarmStart" as displayed in the window above. There is no chronology aspect in the list: each activated alarm condition is checked permanently.
The alarms are saved in the project. They should be configured for each project, as channels may be different from one machine to another.
Alarm conditions
An alarm is made of a condition and an action. If the condition is fulfilled, the action is started.
The condition test is done for a number of:
- Measurement points
- Parameters (1X, Overall etc …)
- Below / Above
- A value
It should be specified if all tests have to be fulfilled or at least one of them should be fulfilled.
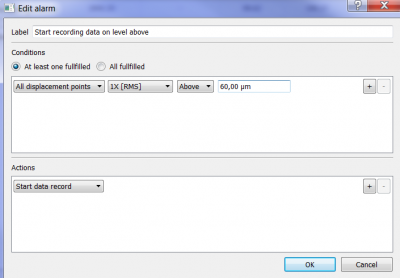
In the example shown in the window below one should read:
If among "All displacement points", one of them has its 1X[RMS] component going above 60 microns, then the data record should be started.
"Alarm start" configuration
Alarm actions
If the alarm condition is fulfilled, then a number of actions can be achieved (like "Start data record" as shown in the window above).
Alarm operation
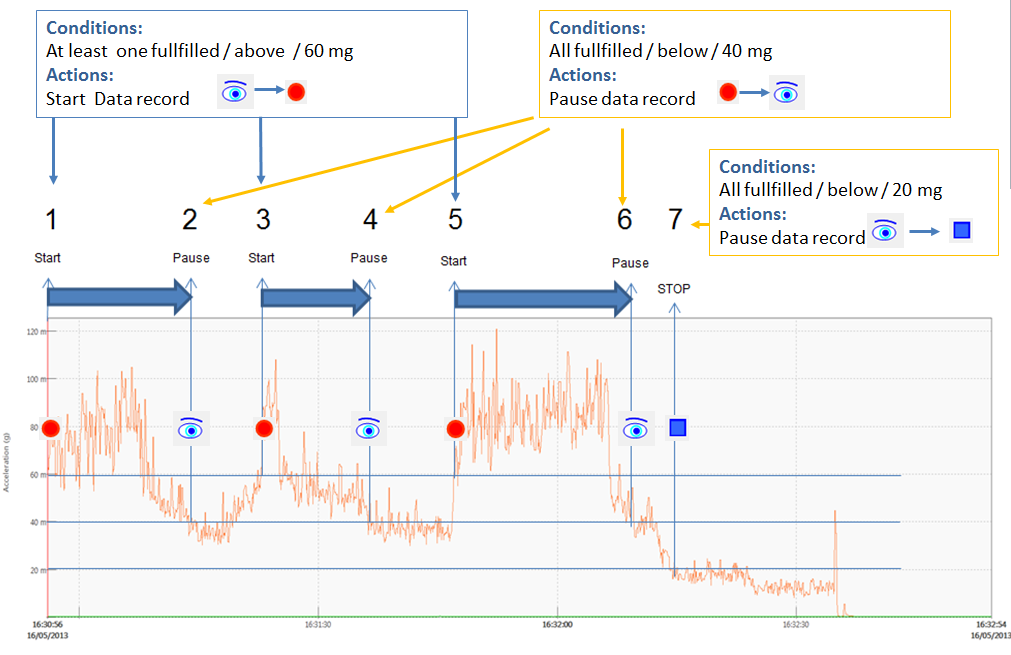
When using the alarm, one needs to start the monitoring
in order to start monitoring data and check conditions. From that point, the conditions are checked and actions started. Here is below an example of data record started on alarms and data record pause when the level goes down.
Example of operations between data record and data monitoring
Displays
A large number of displays can be selected depending on the needs of the user.
Adding and removing a window
Graphic windows can be shown or removed using the "add/remove window" icon as shown in the toolbar below.
Step 7, the add/remove window
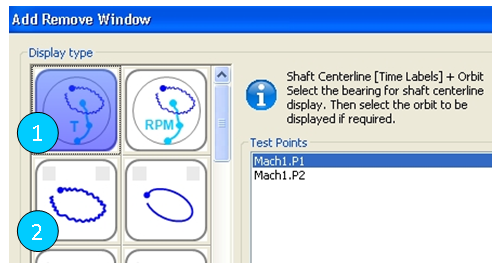
The graphics to be displayed are chosen from the "Display type" section on the left side of the "Add/Remove" window. One type of display should be chosen. Then, the test points to be displayed should be chosen and finally the results type. When the selection is done the trace can be added (by clicking on the icon as indicated on the table below).
The add/remove window
It is possible to have multiple traces on the same graph or several graphs per window.
| Allows adding a trace to a graph. If there is no graph, a new one is automatically created. | |
| Add a new graph. Delete the selected graph. |
Layouts:
Use the layout feature to display more graphics on the same screen. Several graphic layouts can be configured. During the actual test, the different layouts can be swapped using the command "CTRL+SHIFT+SPACE".
The layout can also be selected in the display toolbar or in the graphic zone.
| Add a new layout Delete the selected a layout |
Additional graphics are displayed in online mode. The available graphics are described in the following table.
- Layouts can be renamed by right clicking in the window area
- Windows can be renamed by right clicking on their label
- Windows and traces can be deleted by right clicking on them
| Display | Acquisition & Post Analysis |
Saved and displayed in Navigation mode | |
| RPM vu-meter and profile | YES | YES | |
| Full Shaft Motion | YES | YES | |
| Raw Orbit | YES | YES | |
| nX Orbit | YES | YES | |
| Shaft Centerline with Time/RPM ticks | YES | YES | |
| Profile vs. Time/RPM | YES | YES | |
| Bode Diagram vs. Time/RPM | YES | YES | |
| Polar plot with time/RPM ticks | YES | YES | |
| Signal vs. angle | YES | YES | |
| Order spectrum | YES | YES | |
| Frequency spectrum | YES | YES | |
| Sync Vumeters | YES | YES | |
| Recorded Signal | YES | NO | |
| Monitoring Shaft View | YES | NO | |
| Signal vs. time | YES | NO | |
| ASync Monitoring | YES | YES | |
| Async Vumeters | YES | YES | |
Functions table
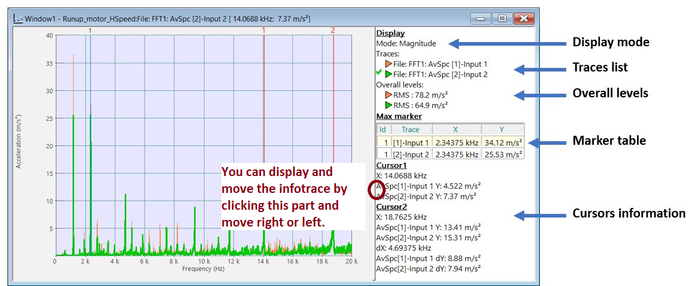
Infotrace
The infotrace displays information about the graph:
- Graph mode: magnitude, real...
- List of traces with their states: available or not / displayed in all areas or not / not displayed. You can move into the infotrace to select a specified trace and to follow cursor’s value of this trace. Memorized traces are also displayed in the list (Memx)
- Overall levels: Displays the RMS level in 2D windows containing spectra or time signals.
- Cursor information: x, y, order, dx, dy if available
- Marker arrays: Using keyboard arrows, you can select the active trace in the infotrace.
Scalar results
Graphic windows should be added and removed through ORBIGate "add/remove window" function.
- Overall values are available simultaneously in the overview grid as: RMS, pk-pk and 0-pk values. They are calculated on the synchronous signal blocks available for the orbit.
- nX orders are also available as RMS values in the grid and as trends vs. Time or RPM
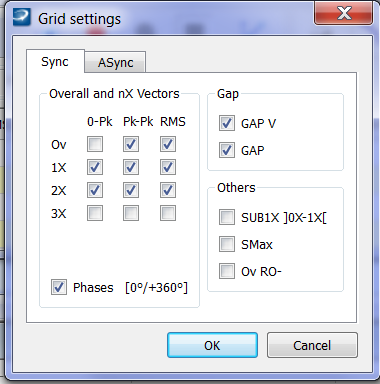
The Sync grid allows visualizing the main required parameters during a measurement: the grid columns can be setup by double clicking on one of the columns or by a right click. The "Sync grid settings" appears as shown beside.
- Ov RO- : It is the overall value corrected by the Run Out whenever a run out correction is applied.
- nX Vectors can be shown as 0-Pk or Pk-Pk (depending on the preference) or RMS
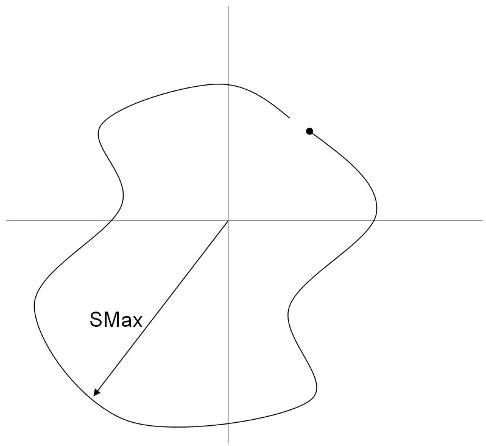
- Smax
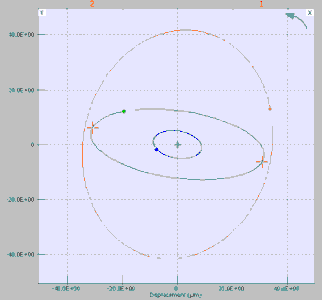
SMax is defined as the maximum value of the radius of the orbit, as displayed on the graph below.
SMax definition display
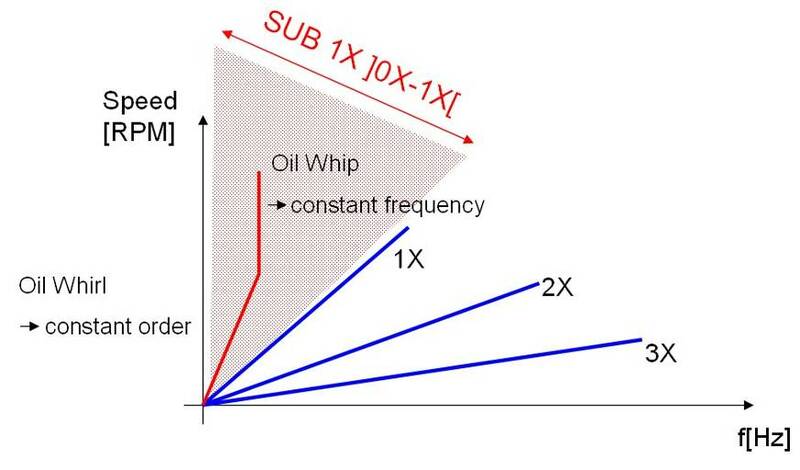
- SUB1X
SUB1X is a value that gives the vibration energy contained in the sub harmonic region. Its purpose is to evaluate instabilities such as oil whirl and oil whip.
The SUB1X function
This value is displayed in the array and can also be displayed as a RPM profile or time profile.
The grid
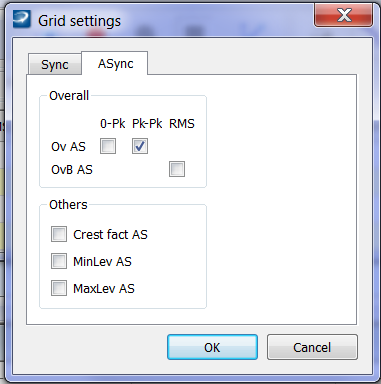
Results from the Synchronous and ASynchronous analysis are available in the grid. The grid can be configured by a right click on it.
There are two tabs available in the grid: one for setting up the Sync analysis and one for the ASync analysis.
|
|
|
In the grid, Async results are noted with the initials AS after the result name.
The orbit
The Orbit can be displayed in a multi-trace mode or in a multi-graph mode.
Multi trace orbit
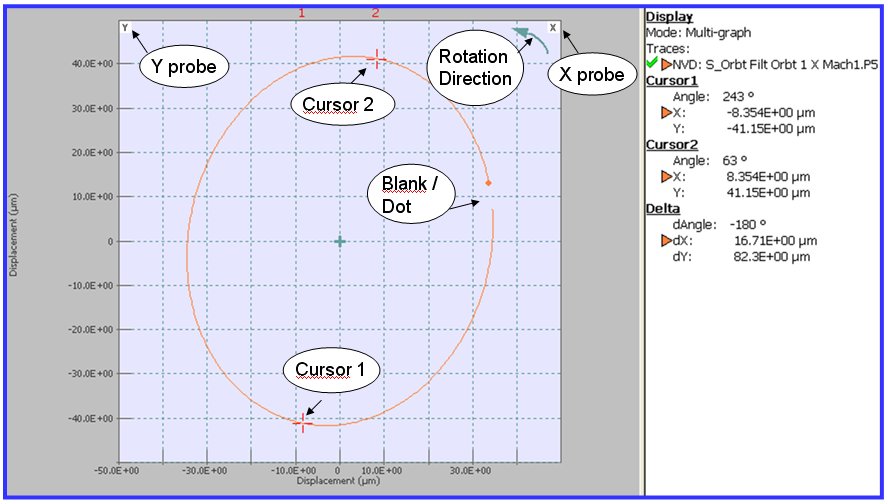
- The Orbit display shows the important parameters of the test:
- Rotation direction
- Blank/Dot indication
- X and Y probes position.
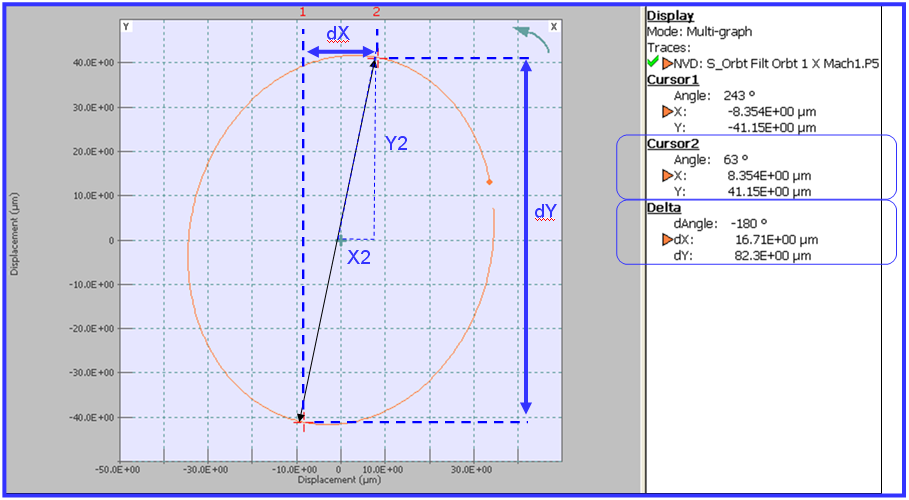
- The cursors are synchronized and can help to describe the deflection of the shaft as shown in figure 47. For example, each cursor 1 displayed is synchronized from one graph to another.
The Orbit display
The orbit cursors let the user measure a number of dimensions of the orbit. It is accessed by dragging to the left the info trace section (on the right side of the orbit window).
The Orbit cursors
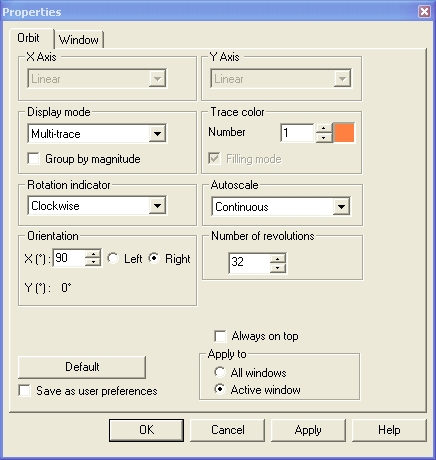
The options of the Orbit window can also be modified by using a right click and selecting properties.
The orbit display properties
The shaft centerline
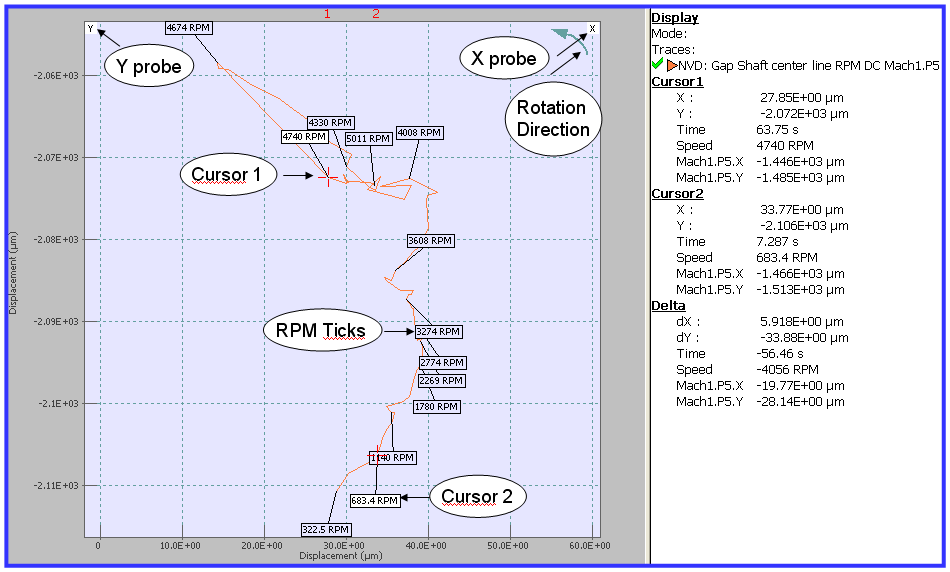
- The Shaft center line (also called GAP) display shows the important parameters of the test:
- Rotation direction,
- X and Y probes position
The Shaft Centerline display
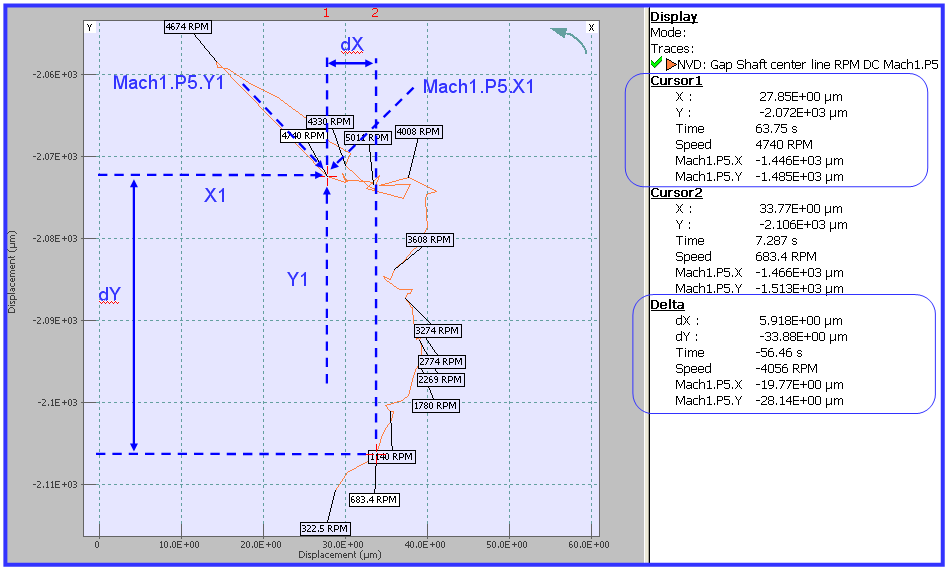
The shaft center line cursors let the user measure a number of dimensions of the shaft center line position. It is accessed by dragging to the left the info trace section (on the right side of the shaft center line window).
The Shaft Centerline cursors
The options of the Shaft Center line window can also be modified by using a right click and selecting properties.
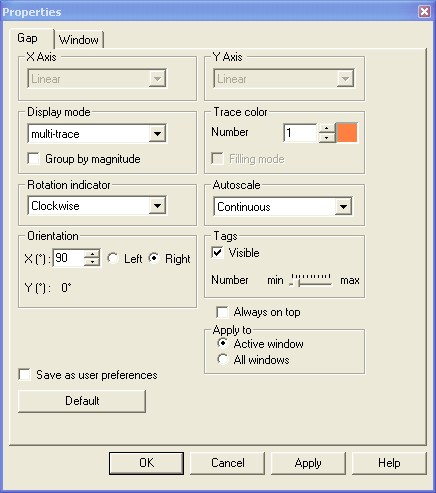
The Shaft centerline display properties
The cursor in the tags section can be moved to select the number of tags in the shaft center line display.
The full shaft motion
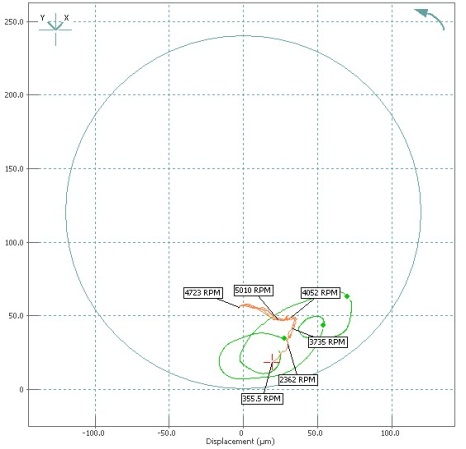
The Full Shaft Motion is displayed using the add/remove window in two steps. One should select first the Shaft Centerline display and then select the orbit. The orbit can be a raw orbit or an nX orbit.
An information section has been added in the add/remove window to describe specific information for the selected plot. The way to display the Orbit+Shaft Centerline + Clearance circle is described in the information section of the shaft centerline window.
The Full shaft motion in the add/remove window
The Full Shaft Motion: Orbit & Shaft Centerline
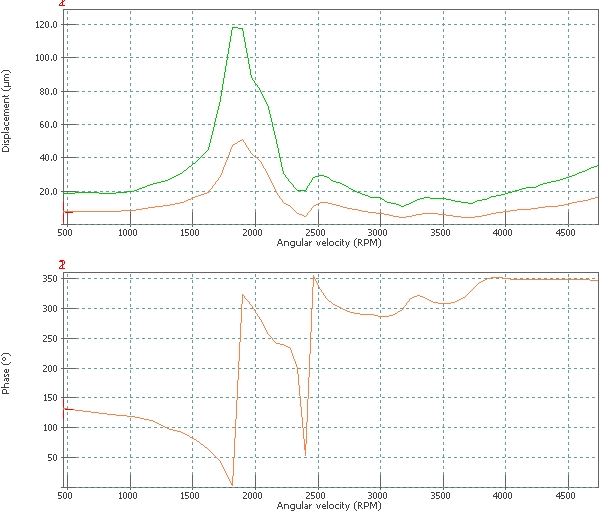
The Bode diagram
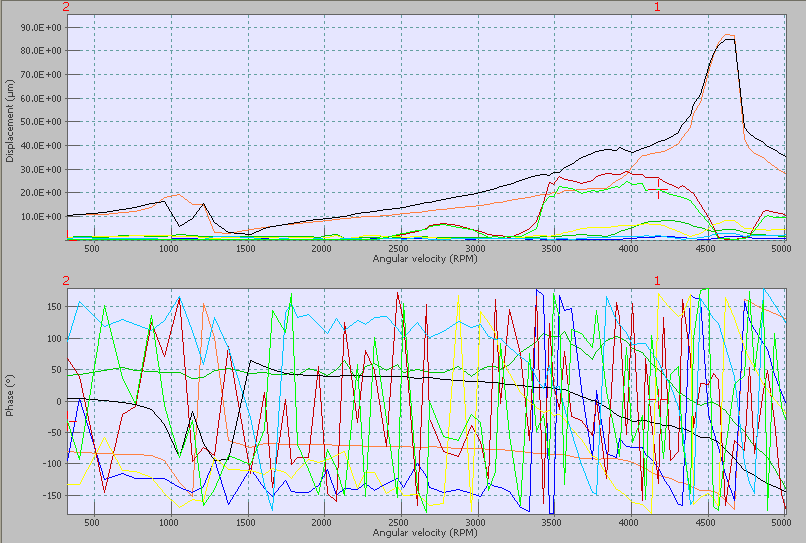
The Bode Diagram is one of the most useful graphics used for turbo machinery vibrations. It allows for displaying vibration levels as a function of rotating speed or time.
The Bode diagram display
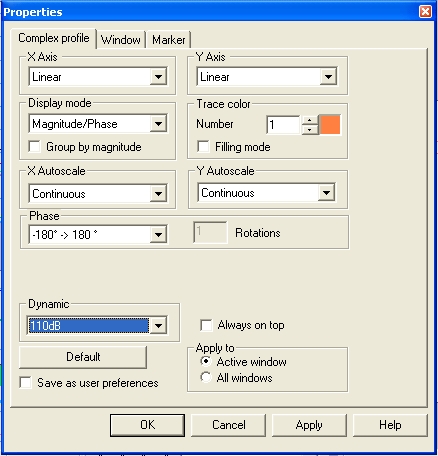
The properties can be accessed by right clicking on the graphic. At this point, it is possible for example to modify the cursor style used for the window.
The Bode diagram properties
1X Amplitude, and Phase and the Direct can be displayed together on the same plot. This is achieved by choosing first to display a Bode Diagram with the 1X result, then select a profile with the "Direct" selection and adding it in the Bode window. This graph is particularly useful to see to check the evolutions of other components than the 1X data (such as sub synchronous components for example).
1X and Direct
The polar diagram
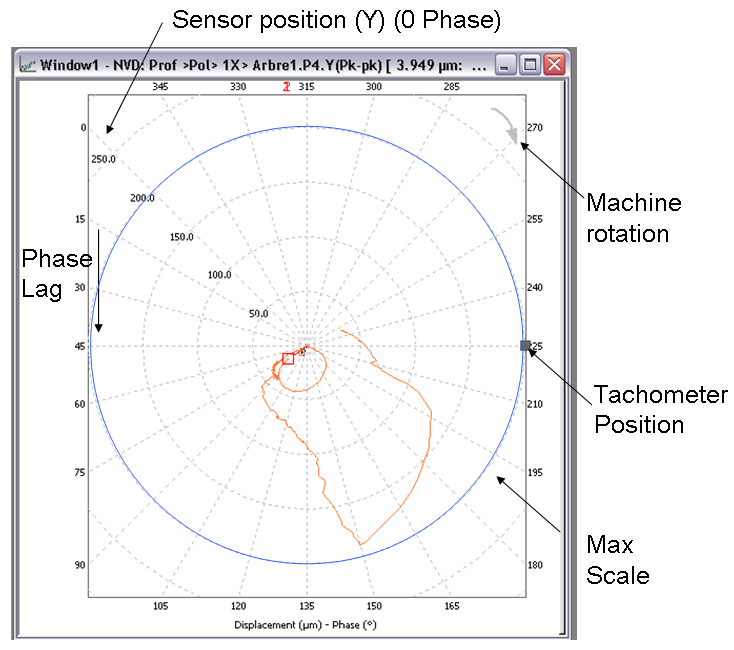
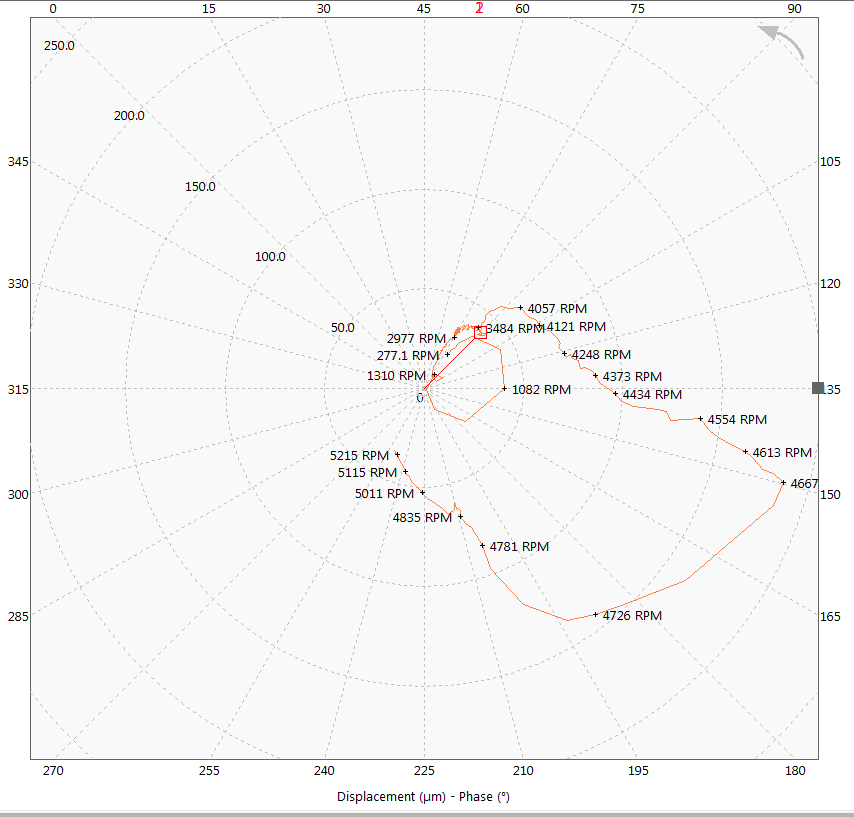
- For turbo machinery measurements the expected polar diagram should have the following features:
Typical polar graph display
- 0 Phase positioned as the measured probe
- Phase lag positive counting in opposite direction as machine rotation
- Machine Rotation & Keyphasor position indication
- (0,0) at center
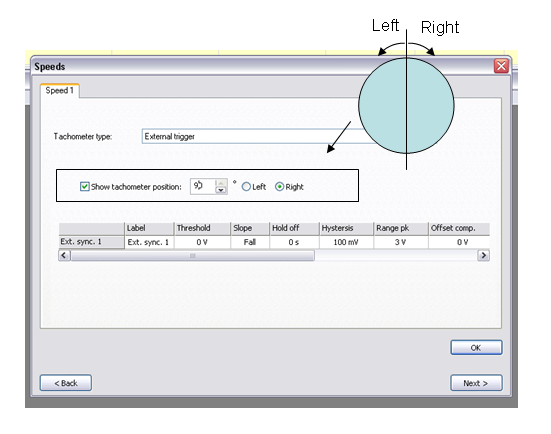
Tachometer (KeyphaSor) position
- The Tachometer position is indicated in the "Speeds" dialog box.
Keyphasor position setting
Polar graph scaling
- Using a fixed scale, the polar graph is displayed so that the (0, 0) origin is at the graph center so that results coming from different sensors can be easily compared.
Polar graph scaling
Polar graph tags
Tags are available for the polar graphs: it can be "time tags" or "RPM" tags. This choice is available in the add/remove window. |
|
Data acquisition
Once the set-up is done, the user can proceed to data acquisition.
Operation control
At this stage, three possibilities exist:
1. Monitor the data, without saving.
2. Record the data (displayed in the array).
3. Record the time domain data (for further post analysis).
4. Stop.
5. Update Scaling preference.
The operating toolbar
GAP Monitoring
The GAP monitoring function allows the user to check the GAP and GAP Voltage even when the machine is at rest or running at very slow speed. It is useful also to determine the DC Offset.
GAP monitoring toolbar
Saving data
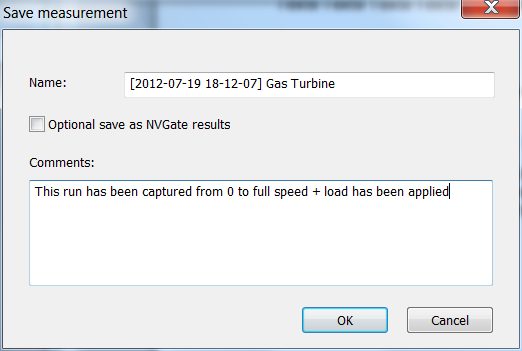
When an array record or a time domain record has been started, saving the file is automatically recommended as shown in the dialog box.
By checking "Optional save as NVGate results", the displayed results are also saved within the NVGate project manager as NVGate results. It allows comparing traces from the NVGate project manager.
The Save measurement dialog box
It is important to be able to correlate the measurements with the conditions under which it has been recorded. For that purpose, it is possible to enter a comment for each measurement. This is achieved when saving a measurement as shown on the screen nearby. It is possible to do it for a new measurement or for an existing measurement using the function "save measurement as...". The comment can be printed in the reports. It is also displayed during the measurement load in the database interface as shown in the display above.
Post analysis
Loading a signal
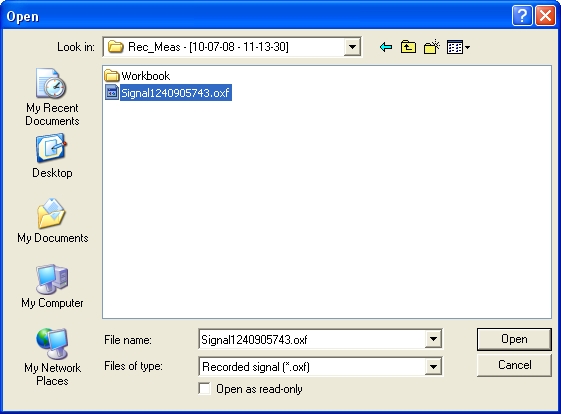
A new measurement can be created based on a time domain signal previously recorded. In that case, the first step is to load a signal with the oxf format. Then one should go through the analysis set-up as previously described in chapter 4. It follows the same principles as a real time acquisition. One can save a measurement as in the acquisition mode.
The signal to be loaded should be located in the current NVGate project database. The signal should contain at least one tachometer channel recorded on the external trigger. This signal can be recorded from NVGate or ORBIGate.
Post Analysis signal selection
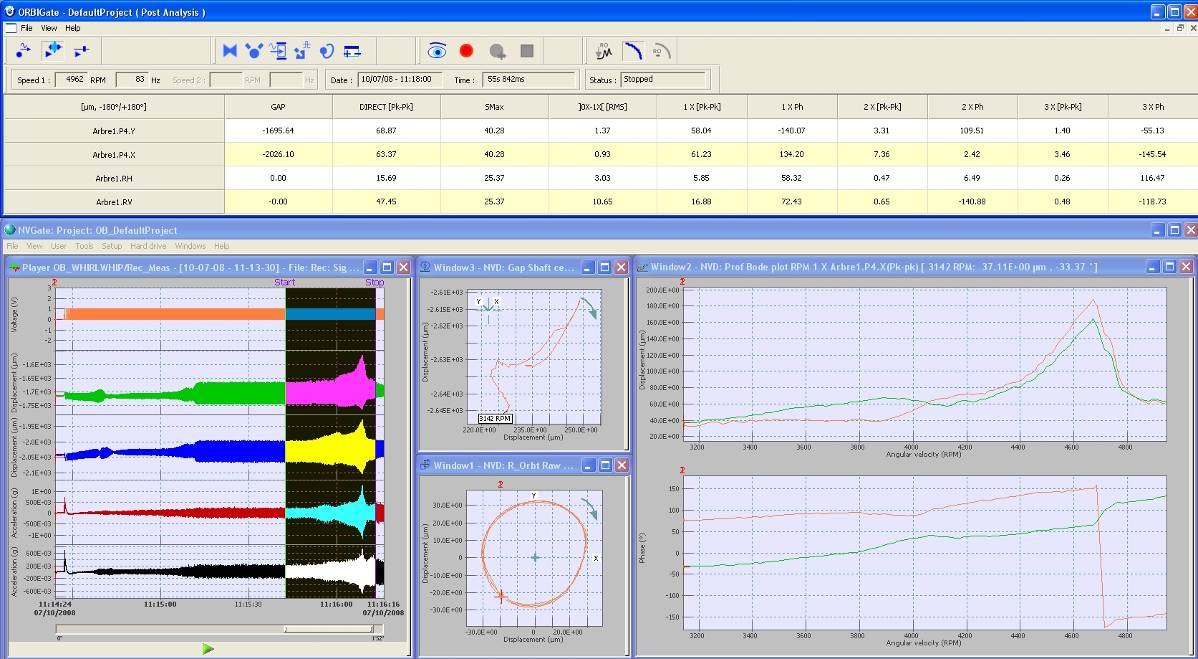
Once the signal is loaded, it will appear as in the window below:
Post analysis working environment
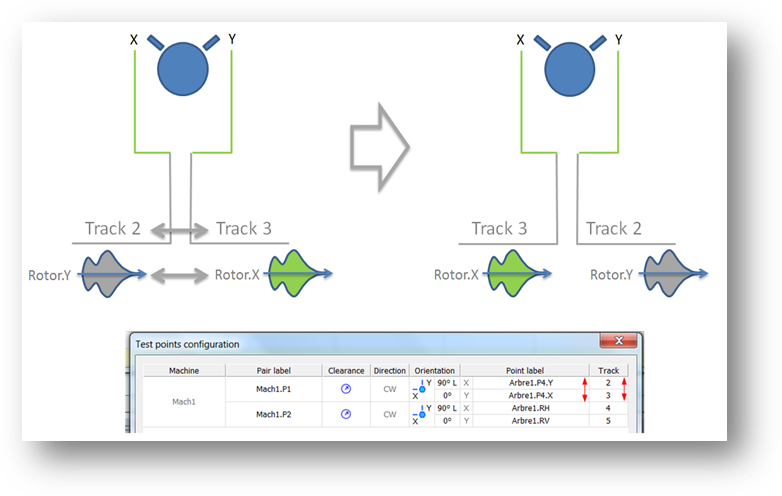
Loading a signal which has different XY preferences:
When a user loads a signal which has been recorded with a different preference, as shown on the figure below. The user needs to inverse the tracks and the labels.
Loading a signal with different XY preferences
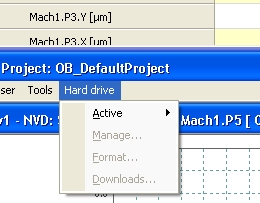
Hard drive Management
- The Hard drive management is accessible through ORBIGate.
- In addition, the recorded signal can be post-processed directly from the hardware. There is no need to download it to the PC. One can also stay in the connected mode and consequently it is not required to exit the software.
Hard drive management
Loading one measurement
A measurement or several measurements is loaded through the command "File/Load Measurements". The following window is displayed. The measurements are browsable through the measurements database interface.
Files can be sorted based on their:
- Measurement name
- Machine train, Company, Plant
- Project
- Date
- Comments
One can also search for keywords coming from any of the columns. The interface looks as below.
Measurement database interface
Once the measurement is loaded, one can look at it in the navigation mode.
Loading measurements
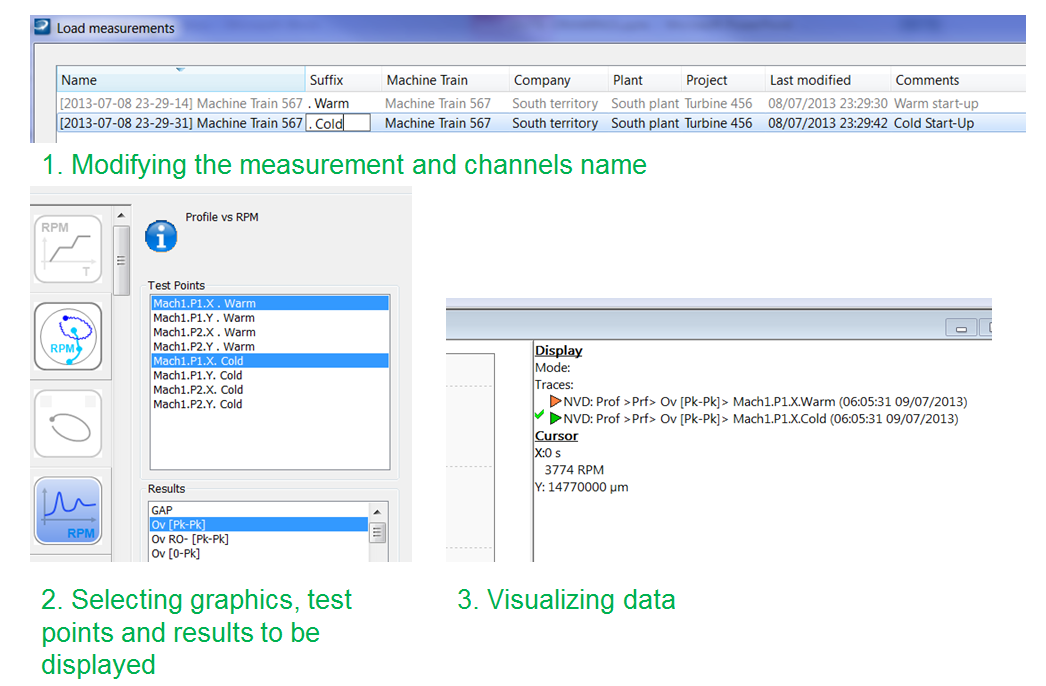
One can load several measurements in order to compare the results. In that case, one should tick at least two measurements from the list from the above window.
In the comparison mode, each trace is labeled with an extension (suffix) that is added to the test point labels: that will be added to measurement name and traces names during the operation in the comparison mode. This will make the comparison easier when it is achieved on the same machine.
Renaming the measurement for an easier comparison
Steps when comparing measurement data
- If a user chooses to load several measurements and enters comparison mode. The navigation functionalities will be restricted in that case.
Once a measurement has been saved, the next step is to be able to use it for analysis and reporting. The navigation mode of ORBIGate allows looking through the data using the navigation cursor.
The navigation toolbar and cursor
Using the navigation cursor, it is possible to go through data that have been saved for different RPMs and different dates.
| By pressing play, the navigator sweep the time history | |
| The pause button allows to pause the sweep | |
| The stop button stops the sweep | |
| The Backward button allows to go one step back | |
| The Forward button allows to go one step forward | |
| The decrease button allows to reduce the sweep speed | |
| The reset button allows to reset the sweep speed to the default value | |
| The increase button allows to increase the sweep speed | |
| The navigation cursor can be grabbed with the mouse and moved | |
| The Range selector interface allows to select a range of the measurement |
It is also possible to sweep forward and backward the history using the keyboard arrows.
Using the navigation cursor, all the data is updated in the graphic zone.
The working environment in the navigation mode
Range Selection
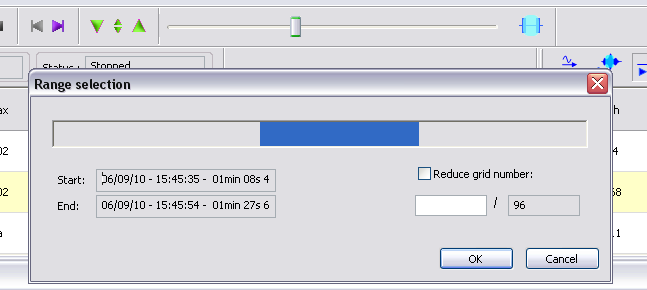
The Range Selector allows the user in the Navigation mode to select one part of the measurement range. The range selection allows choosing the START DATE/RPM value and the END DATE/RPM value. For doing that, the user should grab the Start/End of the blue line and drag it to the expected value.
Range selection
During that stage the number of data available in the measurement can also be resampled in order to reduce the amount of data. The "Nb grid selected" value gives the amount of array exported to the report.
The selected range can be saved as a new measurement using the file menu "save measurement as …"
Run Out Correction
The Run Out error can be corrected on the displayed results. This can be done in the navigation mode but also in real time or during post analysis using the toolbar shown below.
The Run Out toolbar
For that, the first step is to define a Slow Roll during the test. The selection of the Slow Roll is done by pressing the following icon.
Slow Roll selection icon
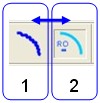
Once this is done, one can switch from corrected results to uncorrected results using the two icons below:
1- Uncorrected 2- Corrected |
Switching from corrected to uncorrected results
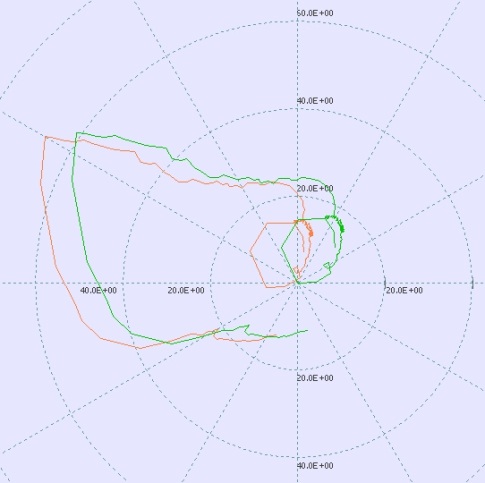
On the graph below, one can see the effect of the correction at the polar diagram of order 1. Such a graph can be created by saving the polar diagram in the NVGate project manager using the function "optional save as NVGate result".
A 1X polar diagram with and without run out correction
Reference voltage determination
GAP reference offset determination
The GAP Reference Offset can be determined by pressing the "Reference Offset" icon. It is used to position the shaft centerline referred to the (0, 0) of the plot.
Two choices are possible: the reference offset can be determined when the shaft is at bottom or when it is at center. In most cases it is carried out at bottom when the machine is at rest. In this case, the position is well known. When the machine is already running and one wants to start a shutdown, the only possibility is to choose the calibration "at center".
Gap reference voltage determination
- One action to be carried out before achieving a Full Shaft Motion display is the gap voltage reference determination. Actually, the shaft centerline has to be positioned in a coordinate system referred to a (0, 0) origin. To achieve that, the measured GAP voltage (DC component of the signal) should be associated to a known (or at least assumed) position of the shaft.
|
|
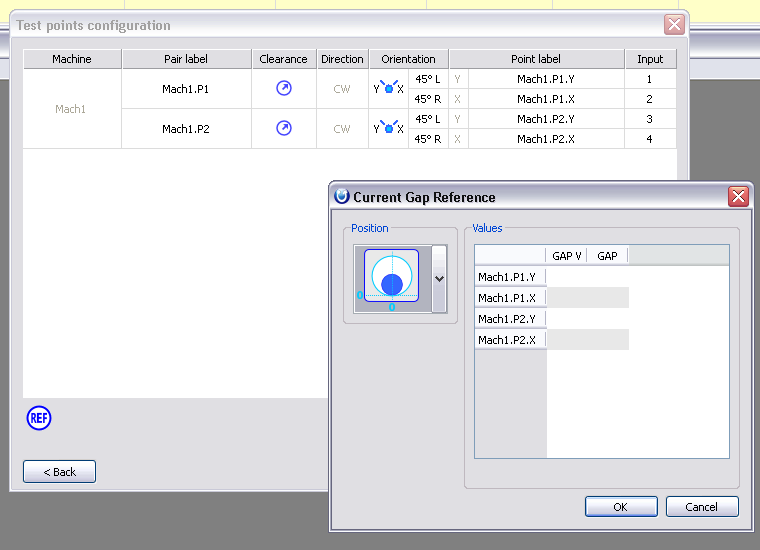
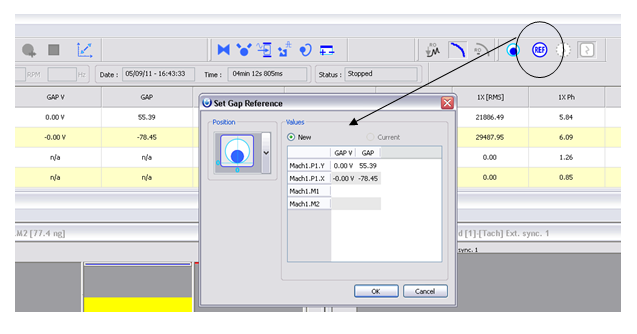
The reference values can be accessed in two ways: In the test point’s configuration or through the toolbar icon.
|
|
In this window the current values can be visualized or entered by hand.
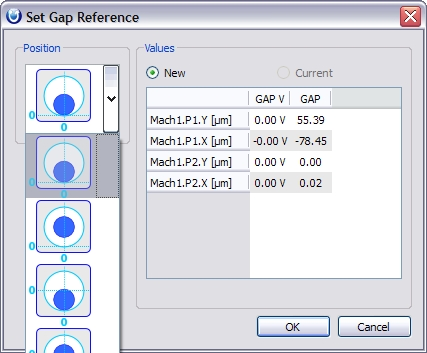
When accessing the "set gap reference" values through the toolbar icon. The values measured (shown in the grid) appear in the table when the button "new" is checked. If the button "current" is checked, the current values are shown.
At this stage, one should choose the corresponding position of the shaft and the preference for the 0 position (0 at center or 0 at bottom): Four choices are possible:
| 0 at bottom | 0 at center | |
|
||
|
The gap reference is saved in the measurement and in the project as well as in the machine train.
Bearing clearance circle
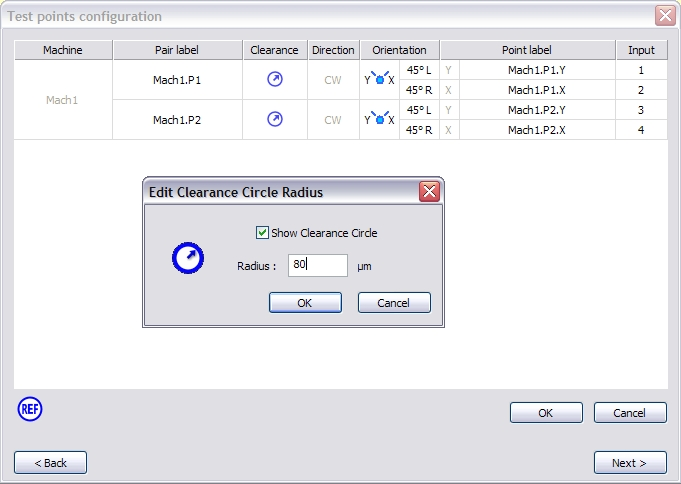
The bearing clearance radius can be entered and so the GAP clearance circle can be displayed. The value is entered in Microns or Mils depending on the unit defined in the preferences. If the choice is made to be "Show Clearance Circle", the circle will be shown automatically when a shaft centerline is displayed. If a value is not entered the circle won’t be shown and the shaft centerline will be displayed as standard.
Bearing clearance radius set-up
Acquiring the Gap reference voltage
Full shaft motion (Orbit+ Shaft centerline + Clearance circle) can be displayed simultaneously on the same plot for having a full display of the shaft motion.
The shaft centerline can be displayed taking the offset reference voltage into account or not. This choice is made through the 2 new icons implemented in version 3: "Apply Gap Reference Voltage" or "Disable Gap Reference Voltage". In order to see the Shaft Centerline displayed together with the Clearance Circle, one should use "Apply Gap Reference Voltage".
Apply gap reference voltage for shaft centerline representation
Exporting
In offline mode, it is possible to start the report tool. The report tool uses MS Excel to export the data. The exported data are the data contained in the current loaded measurement (data contained in the array columns).
- An option is also to export the data in separate CSV files.
- Checking the line "Repeat DATE/RPM/TIME on each sheet" will export this information on each spreadsheet of the Excel report.
- "Export Graphs" will copy all the graphs displayed currently and paste them in a spreadsheet called "GRAPHS".
The grouping option allows exporting the data by grouping them either:
- By result (one spreadsheet for each type of results)
- By Sensor (one spreadsheet for each sensors)
The export set up window
Once the data has been exported, it is possible to reopen the Excel file and customize it within MS Excel. Then this file can be saved into the directory "C:\OROS\ORBIGate data\Templates" to become a new template. This new report template can be used for data exported from the same project (same number of channels).
Reporting
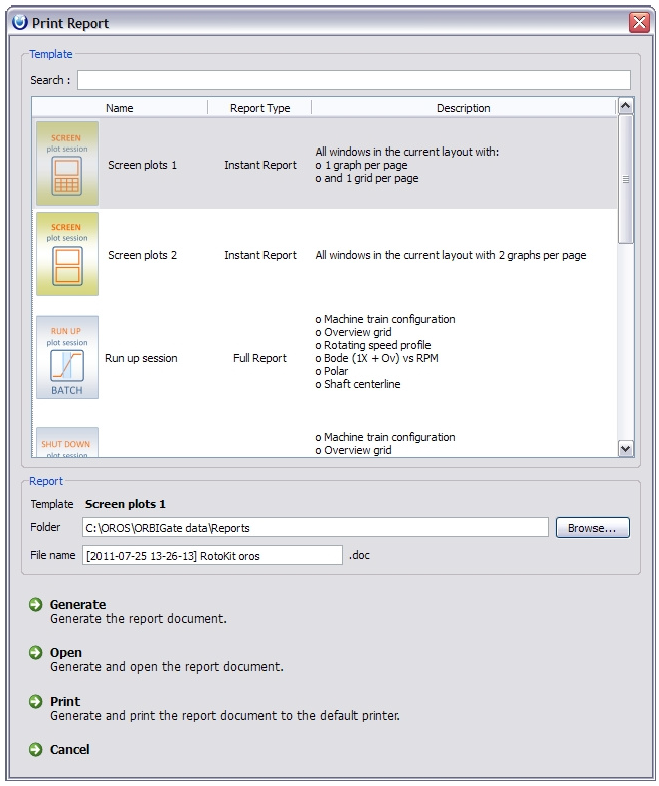
There are two ways to make a report:
FULL REPORT: The template decides what is going to be printed: windows to be printed in the report don’t need to be displayed by the user. The Full report is a batch report, accessible in the navigation mode.
INSTANT REPORT: Print all windows displayed in the current layout (on screen). The online report is available anytime during a test.
One of the great advantages is that the report template doesn’t need to be changed according to the number of test points.
The print report setup window


