Difference between revisions of "RT60 Calculator"
(→Tips) |
|||
| (2 intermediate revisions by the same user not shown) | |||
| Line 1: | Line 1: | ||
[[category:WikiOros]] | |||
[https://en.wikipedia.org/wiki/Reverberation Reverberation] in acoustics is the persistence of sound after a sound is produced. Reverberation, or reverb, is created when a sound or a signal is reflected causing a large number of reflections to build up and then decay as the sound is absorbed by the surfaces of objects in the space – which could include furniture, people, and air. | [https://en.wikipedia.org/wiki/Reverberation Reverberation] in acoustics is the persistence of sound after a sound is produced. Reverberation, or reverb, is created when a sound or a signal is reflected causing a large number of reflections to build up and then decay as the sound is absorbed by the surfaces of objects in the space – which could include furniture, people, and air. | ||
| Line 121: | Line 122: | ||
[[Image:RT60_13.png|thumb|none|270px]] | [[Image:RT60_13.png|thumb|none|270px]] | ||
4) if any issue using the excel file "impulsive source" use [https://orossas.sharepoint.com/:x:/g/support/EegqVjHun_9AtPeocfissKUBVs5xQVi1TmAjy_clQDDvyw?e=8YfypQ this one] "RT60 calculator impulsive source_corr" from november 2023 | |||
| Line 128: | Line 131: | ||
|style="background: green; text-align:center;"|<big>[[FFT_Spectrum_Analyzer_Multipurpose#Full_technical_support|<span style="color:white;">Contact support]]</big> | |style="background: green; text-align:center;"|<big>[[FFT_Spectrum_Analyzer_Multipurpose#Full_technical_support|<span style="color:white;">Contact support]]</big> | ||
|} | |} | ||
Latest revision as of 10:08, 26 November 2024
Reverberation in acoustics is the persistence of sound after a sound is produced. Reverberation, or reverb, is created when a sound or a signal is reflected causing a large number of reflections to build up and then decay as the sound is absorbed by the surfaces of objects in the space – which could include furniture, people, and air.
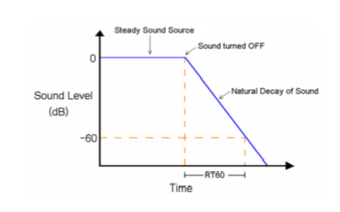
Definition: RT60 means '" Reverberation time - 60 dB". In other words, it means "how long a sound needs to decrease to 60 dB from it is initial energy level".
RT60 Measurement is used to define the Reverberation Time of a room in order to qualify this one.
Principle
The principle is to measure the RT60 for each third octave frequency band. Then, all these bands are combined to determine a global reverberation time.
Configuration
According to this method, the following plug-ins of NVGate are used:
- OCT plug-in: to have the energy level by frequency band
- Waterfall plug-in: to analyze the OCT profile
- Noise generator: you can use an OROS OR3X analyzer to generate a noise
The corresponding NVGate project is already done. You can find it in the folder "RT60 NVGate Project". An example is also available below.
Notes: This program is working with NVGate V11.00 and later.
Calculation
After the measurement, import the data into the excel sheet. This document combines each frequency band and automatically calculates the reverberation time.
Please find the mentioned excel sheet in the folder "OROS RT60 Calculator". A tutorial is also available below.
Package
Download
Please contact your local distributor for access to the RT60 package.
| Schedule a demo | Get a quotation | Contact support |
Package composition
- NVGate project folder
- NVGate project
- OROS Calculator Folder
- RT60 Calculator.xlsm
RT60 Measurement
How to use RT60 NVGate model
Video Full tutorial
Note : The configuration project create on the video( step 1 to 7) is directly on the package, do not need to rebuild it.
Import the NVGate model into NVGate and perform the measurement
1- Copy the entire folder "RT60 third octave" and paste it into your NVGate model database. By default, the NVGate model database is located in: "C:\OROS\NVGate data\Workbook Library\User".
2- Create a new project in NVGate.
3- Then, select the "RT60 Model" in the next window and click on "load".
4- Adjust the threshold of the EDGE 1. This event should start the waterfall.
5- Your measurement is ready; just start the measurement and stop your sound source just after.
6- Your measurement is saved and located in the project manager. There, right click on the result of your measurement and select export.
7- Finally, export your result in a .txt format.
On user export preference, use : "generate one file per result"
8- open the "OROS RT60 Calculator.xlsm".
How to use the OROS RT60 Calculator
Import file
1) In the tab "pos 1" of the Excel file "OROS RT60 Calculator", click on the "Import data position 1" button.
2) Then, select the .txt file to import.
3) Import the data of the other positions (using the same procedure).
4) In the "average level" tab, the average level of all the imported positions is automatically calculated. It is possible to deactivate a position in the settings tab:
In this example, the average level – and RT60 - will be calculated for positions 1, 2 and 3.
5) In the "overview" tab, you can have a look at the decay curve of each third octave band and check the regression line.
Part of the "overview" tab
6) If needed, it is possible to change the calculation mode (T20 / T30 / Manual) to see which one better fits the curve. For that, go to the tab corresponding to the third octave band frequency.
7) The report includes the RT60 values and the calculation mode (T20 / T30 / Manual ("m")) for each third octave band, a graph and the global RT60 value. You can change the frequency band for the global RT60 computation (from… to…).
Tips
1) In the settings tab, you can change the calculation mode for all third octave bands:
2) In the settings tab, you can choose the bounds of the graphs and click on "set" to change automatically the axis of all graphs.
3) To not display the 50, 63 and 80 Hz values in the report, adjust the following fields in the settings tab:
4) if any issue using the excel file "impulsive source" use this one "RT60 calculator impulsive source_corr" from november 2023
| Schedule a demo | Get a quotation | Contact support |
