Difference between revisions of "NVGate Marker"
| Line 2: | Line 2: | ||
[[Image:Reports_Tools_Ribbons_26.png|framed|right]] | [[Image:Reports_Tools_Ribbons_26.png|framed|right]] | ||
NVGate features a complete set of real-time markers that help identifying typical signature and points of exception in both time and spectral graphs. | NVGate features a complete set of real-time markers that help identifying typical signature and points of exception in both time and spectral graphs. | ||
=== | ===Marker description=== | ||
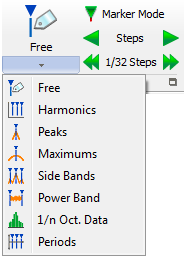
The marker group allows selecting and positioning the chosen marker. The markers allow quantifying measurement behaviors such as the band power between 2 frequencies, track signal harmonics or tracking the max amplitude of a signal… | The marker group allows selecting and positioning the chosen marker. The markers allow quantifying measurement behaviors such as the band power between 2 frequencies, track signal harmonics or tracking the max amplitude of a signal… | ||
| Line 300: | Line 300: | ||
The record marker is available from the ''Analysis\Record'' group. ''See [[NVGate_Ribbons:_Analysis_Tab|Analysis tab]].'' | The record marker is available from the ''Analysis\Record'' group. ''See [[NVGate_Ribbons:_Analysis_Tab|Analysis tab]].'' | ||
===Copy marker table=== | |||
Available in Infotrace area. Used to copy marker data to the clipboard. The data is formatted to be pasted easily in Word<sup>®</sup> or Excel<sup>®</sup>. | Available in Infotrace area. Used to copy marker data to the clipboard. The data is formatted to be pasted easily in Word<sup>®</sup> or Excel<sup>®</sup>. | ||
| Line 317: | Line 317: | ||
[[Image:Display_Graphs_Traces_168.png|framed|none]] | [[Image:Display_Graphs_Traces_168.png|framed|none]] | ||
===Marker table in reports=== | |||
The marker table can be droped in the report template. See | The marker table can be droped in the report template. See [[NVGate_Report|NVGate Report]] for details. | ||
===Marker manager=== | |||
Gives the list of all the markers in the window, except record markers. In this dialog box, any window marker can be removed or modified. | Gives the list of all the markers in the window, except record markers. In this dialog box, any window marker can be removed or modified. | ||
Revision as of 18:15, 7 January 2022
NVGate features a complete set of real-time markers that help identifying typical signature and points of exception in both time and spectral graphs.
Marker description
The marker group allows selecting and positioning the chosen marker. The markers allow quantifying measurement behaviors such as the band power between 2 frequencies, track signal harmonics or tracking the max amplitude of a signal…
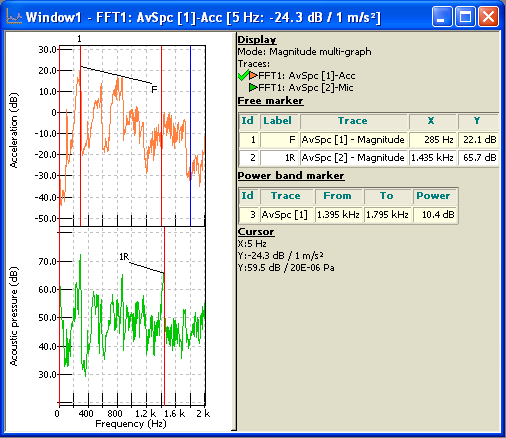
There is also a copy function using the right click from the Infotrace that allows to paste the whole marker table to Word® or Excel®.
Free marker
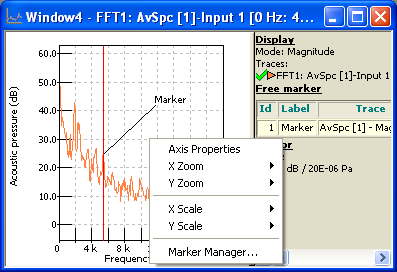
Switch the cursor to deposit a free marker in the click location. The free marker can be positioned everywhere to add a legend in a spectra, profile, 1/n octave and waterfall section.
When available, a free marker can be placed and moved within a graph to track specific values. A label can be associated with each free marker.
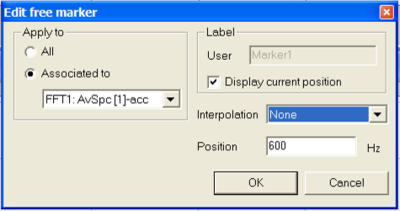
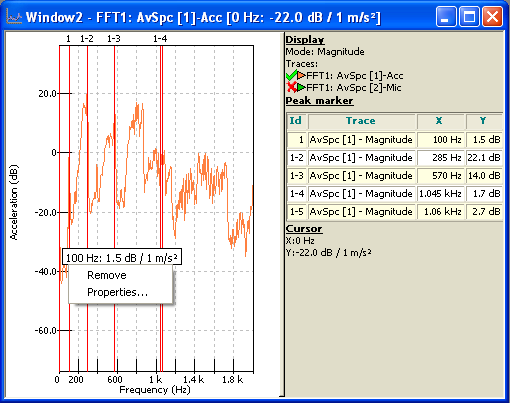
Right clicking on a free maker displays menu including "Properties", which opens edit free maker dialog box.
- Label: The label associated with the marker. The user can enter directly a name or pick ’display current position’ to display automatically the coordinates of the selected point.
- Position: The X position of the current marker. The position value can be fixed by entering the new value in this box.
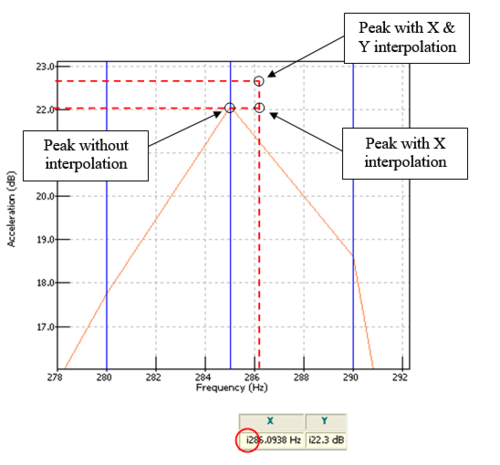
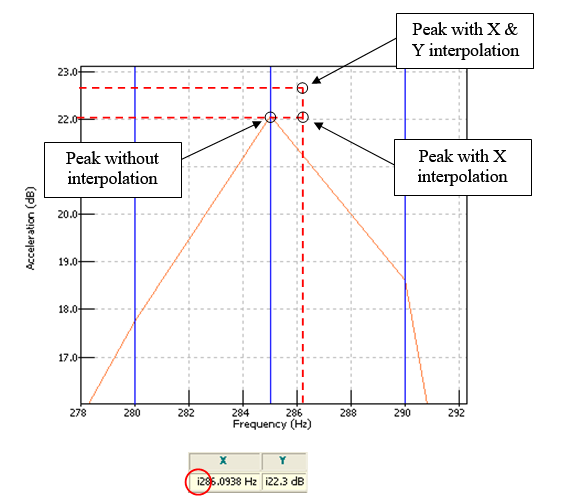
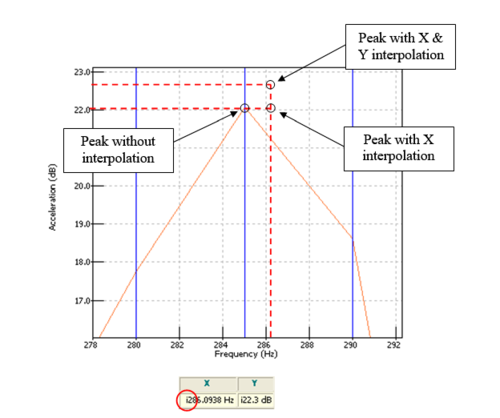
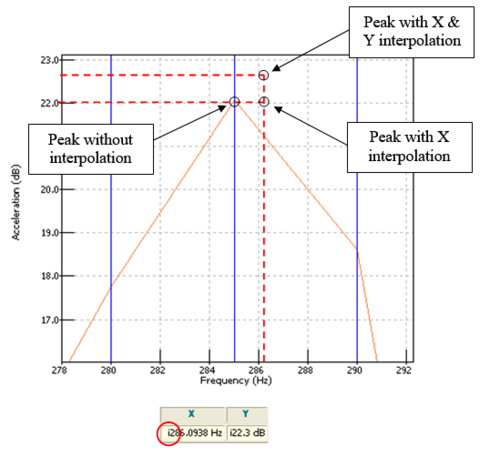
- Interpolation: This setting selects the interpolation of values displayed in the marker table.
- None: no interpolation applied.
- X: x interpolation is active.
- X & Y: x and y interpolations are active.
When the interpolation function is active, the interpolated value is preceded by a "i".
Note: the interpolated values of free markers will be available only if the free marker is placed on a peak. The peak detection criteria are the same as the peak marker adjusted in the User preferences.
- Apply to
- All: the marker is associated with all curves of the graph. All Y values will be computed and displayed in the free marker tab.
- Associated to: the marker is associated with only one trace of the graph. If active is selected, the marker is applied to the current active trace of the graph.
Harmonic marker
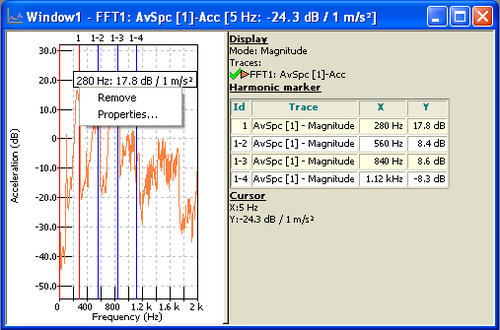
Switch the cursor to deposit a set of harmonics in the click location. The harmonic marker can be positioned everywhere in a spectra and waterfall X/Y sections.
Computes and displays harmonic values for the selected trace(s).
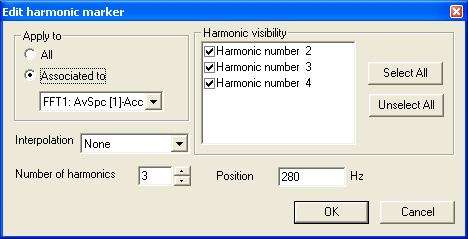
Harmonic marker properties
- Harmonic visibility: Harmonics checklist. Only checked harmonics will be displayed.
- Interpolation
- None: no interpolation applied.
- X: x interpolation is active.
- X&Y: x and y interpolations are active.
When the interpolation function is active, the interpolated value is preceded by a "i".
Note: the interpolated values of harmonic markers will be available only if the harmonic marker is placed on a peak.
- Apply to
- All: the marker is associated with all curves of the graph. All Y values will be computed and displayed in the free marker tab.
- Associated to: the marker is associated with only one trace of the graph. If active is selected, the marker is applied to the current active trace of the graph.
Peak marker
Switch the cursor to add a set of peak detection markers in the clicked graph. The peak marker detects automatically the peaks in the spectra and waterfall X/Y sections.
Computes and displays peak values for the selected trace(s).
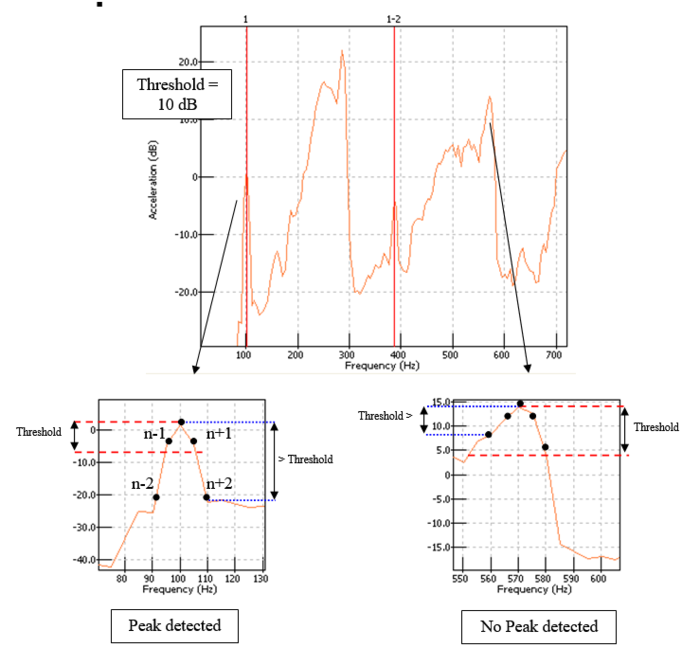
A spectrum line is detected as a peak if two following conditions are matched:
- The 2 adjacent spectrum line levels (N-1, N+1) are lower than the central spectrum line one’s
- The 2 following adjacent spectrum line levels (N-2, N+2) are lower than the central spectrum level minus the peak threshold
Peak marker properties
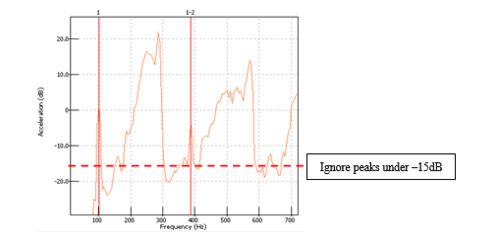
- Threshold: In the example below, the "Threshold" is 10 dB.
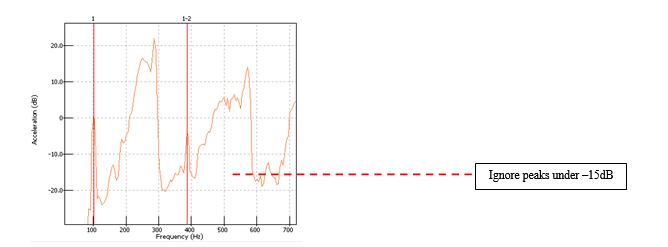
- Ignore under: Does not display the detected peak if the peak is under this value. In the example below, the "ignore under" value is –15 dB.
- Number of peak: Number of peaks to be displayed. That will first display the greatest peaks.
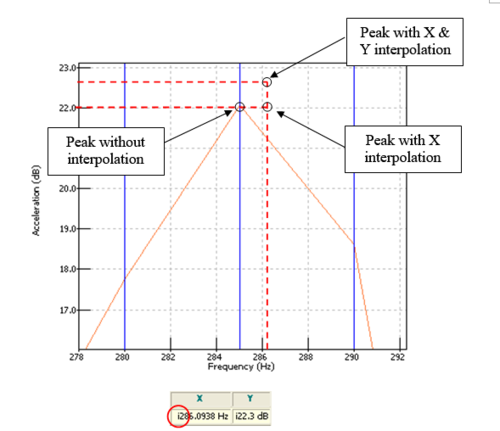
- Interpolation
- None: no interpolation applied.
- X: x interpolation is active.
- X & Y: x and y interpolations are active.
When the interpolation function is active, the interpolated value is preceded by an "i".
- Apply to
- All: the marker is associated with all curves of the graph. All Y values will be computed and displayed in the free marker tab.
- Associated with: the marker is associated with only one trace of the graph. If active is selected, the marker is applied to the current active trace of the graph.
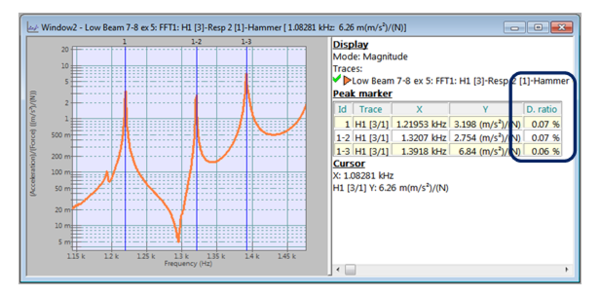
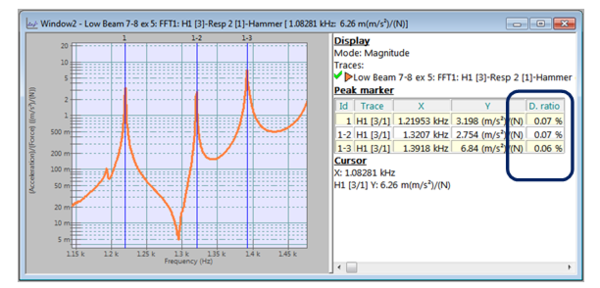
- Damping ratio damping ratio is calculated for each detected peak. The calculation is based on the Half-power-band-width method, where DR is the damping ratio:
The calculation of the damping factor is activated through the marker properties or preferences.
When it is activated an additional column is added in the corresponding marker table. The marker table can be saved in an MS Office document or simply copied and pasted.
Warning, using nonhomogeneous weighting windows (i.e.: equivalent noise bandwidths are not the same) on FRF channels leads to incorrect peak interpolation and damping results.
Max marker
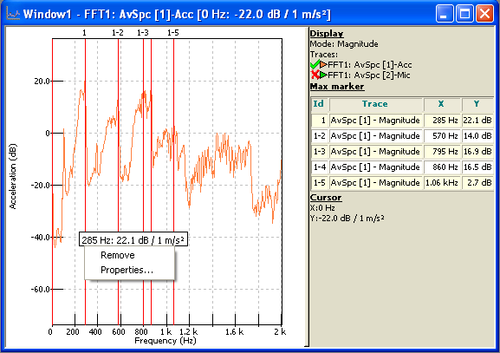
Switch the cursor to add a set of maximum detection markers in the clicked graph. The max marker detects automatically the maximum in the spectra and waterfall X/Y sections.
Computes and displays max values for the selected trace(s).
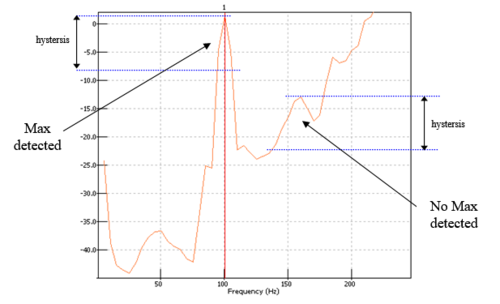
A maximum is defined as a local maximum such that the variation in size of spectral density of ray, in relation to other local maximum surrounding it, is greater than a set threshold
Max marker properties
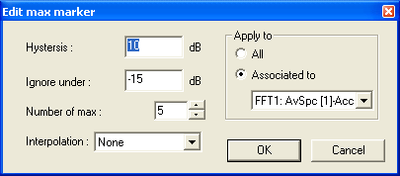
- Hystersis
- Ignore under: Does not display the detected peak if the peak is under this value. In the example below, the "ignore under" value is –15 dB.
- Number of max: Number of max to be displayed. That will first display the greatest max.
- Interpolation
- None: no interpolation applied.
- X: x interpolation is active.
- X & Y: x and y interpolations are active.
When the interpolation function is active, the interpolated value is preceded by a "i".
- Apply to
- All: the marker is associated with all curves of the graph. All Y values will be computed and displayed in the free marker tab.
- Associated to: the marker is associated with only one trace of the graph. If active is selected, the marker is applied to the current active trace of the graph.
- Damping ratio damping ratio is calculated for each detected Maximum. The calculation is based on the Half-power-band-width method, where DR is the damping ratio:
The calculation of the damping factor is activated through the marker properties or preferences.
When it is activated an additional column is added in the corresponding marker table. The marker table can be saved in an MS Office document or simply copied and pasted.
Warning, using nonhomogeneous weighting windows (i.e.: equivalent noise bandwidths are not the same) on FRF channels leads to incorrect peak interpolation and damping results.
Side band marker
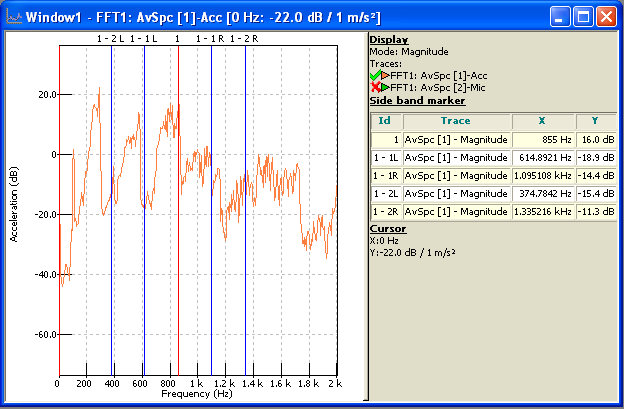
Switch the cursor to add a side band marker at the clicked location. The Sideband marker can be positioned everywhere in a spectra and waterfall X/Y sections
Display values for a central frequency and side frequencies (left and right) defined by a delta value.
The management of side band markers selects the assumed porter and the first side band of modulation. The position of the cursor during the selection of the porter or the first side band is previously interpolated on the frequency axis, taking into account the frequency response of the weighting window used if the Interpolation setting allows this
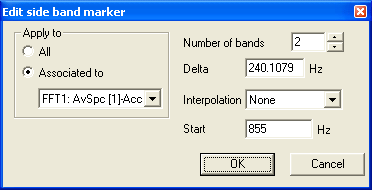
Side band marker properties
- Start: Central value.
- Delta: Range between 2 side frequencies.
- Number of bands: Defines the number of bands (on the left and on the right).
- Interpolation
- None: no interpolation applied.
- X: x interpolation is active.
- X & Y: x and y interpolations are active.
When the interpolation function is active, the interpolated value is preceded by a "i".
Note: the interpolated values of free markers will be available only if the side band marker is placed on a peak.
- Apply to
- All: the marker is associated with all curves of the graph. All Y values will be computed and displayed in the free marker tab.
- Associated with: the marker is associated with only one trace of the graph. If active is selected, the marker is applied to the current active trace of the graph.
Power band marker
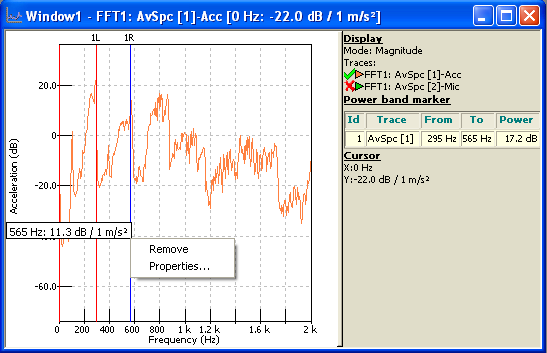
Switch the cursor to add a power band marker at the clicked location. The power-band marker can be positioned everywhere in a spectra and waterfall X/Y sections. It extracts the RMS power in the selected band taking in account the equivalent bandwidth of the weighting window.
Computes and displays power in signal range defined by start position and delta.
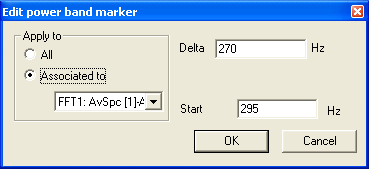
Power band marker properties
- Start: Start value for the power band computation.
- Delta: Bandwidth used for the computation.
- Apply to
- All: the marker is associated with all curves of the graph. All Y values will be computed and displayed in the free marker tab.
- Associated with: the marker is associated to only one trace of the graph. If active is selected, the marker is applied to the current active trace of the graph.
1/n Octave data marker
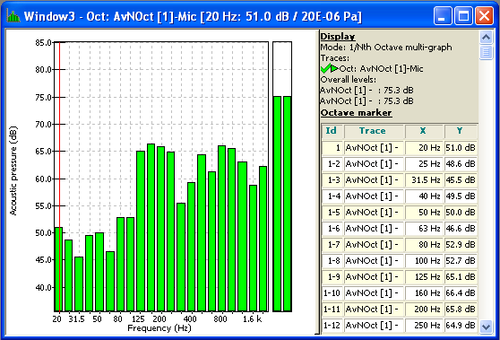
Switch the cursor to add a 1/n octave data marker at the clicked graphs. The 1/n octave data marker can be positioned in CPB spectra and waterfall X/Y sections of the same type. It extracts the list of the band levels in db or linear units into the infotrace.
Display all band values.
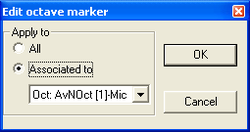
Octave marker properties
- Apply to
- All: the marker is associated with all curves of the graph. All Y values will be computed and displayed in the free marker tab.
- Associated with: the marker is associated with only one trace of the graph. If active is selected, the marker is applied to the current active trace of the graph.
Kinematic markers
Switch the cursor to deposit a set of harmonics in the click location. The harmonic marker can be positioned everywhere in a spectra and waterfall X/Y sections.
The Kinematic marker helps identifying the frequencies (or orders) which match the various rotating speed in machineries. These frequencies are linked with a fundamental one (usually the main shaft rotating frequency) by fixed ratio. These ratios depend on the machinery kinematics.
Kinematic marker fits ideally the diagnostics on bearing, gear train and belt/chain systems by helping the identification of the defects’ source.
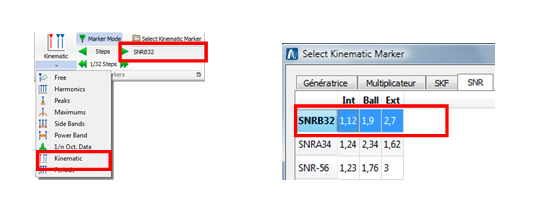
To add a kinematic marker to a window, select Kinematic from the Display/graph/Markers left button.
Then it becomes possible to select one marker from the list. Click Select Kinematic Marker button to open the selection dialog. Select one line from the table of the current tab and close the dialog box. The corresponding marker will be applied double clinking on a spectral graph.
This type of marker may be manipulated from any of the sub-marker lines.
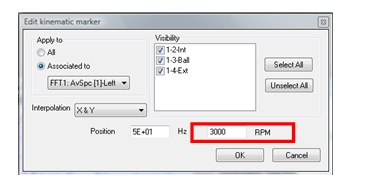
Kinematic marker properties In the kinematic marker properties (Right click on it or through marker manager) the fundamental frequency may be adjusted in Frequency unit or RPM.
'Kinematic marker Description The Kinematic descriptions for these markers are taken from .csv (or Excel™) files.
The files may be modified to adjust the kinematics ratio. The files content are read every time the select kinematic marker is opened. No need to exit the NVGate software for update.
Each file can contain unlimited markers and group of markers. NVGate handle simultaneously multiple kinematic descriptor files. The descriptor files have to be in the following directory (default):C:\OROS\NVGate data\Markers\Kinematic.
The kinematic marker operations are similar to the harmonics one.
Periodic marker
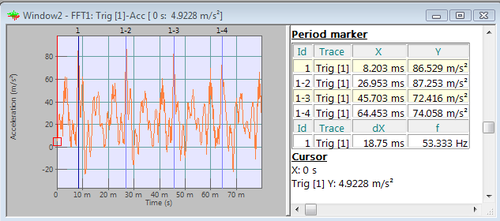
![]() Switch the cursor to add a periodic marks at the clicked location. The period marker can be positioned trigger blocks. Operates like an harmonic marker but in the time domain.
Computes and displays periodic values for the selected trace(s).The periodic allows identifying the periodicity and frequency of repeated phenomena identified into time series graphs
Switch the cursor to add a periodic marks at the clicked location. The period marker can be positioned trigger blocks. Operates like an harmonic marker but in the time domain.
Computes and displays periodic values for the selected trace(s).The periodic allows identifying the periodicity and frequency of repeated phenomena identified into time series graphs
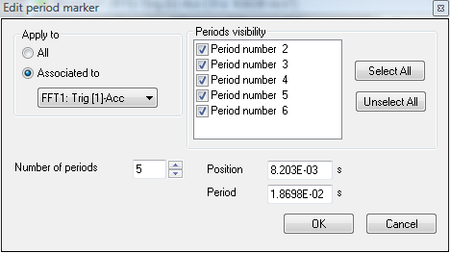
Periodic marker properties
- Period visibility: checklist. Only checked periods will be displayed.
- Apply to
- All: the marker is associated with all curves of the graph. All Y values will be computed and displayed in the free marker tab.
- Associated to: the marker is associated with only one trace of the graph. If active is selected, the marker is applied to the current active trace of the graph.
Record Marker
![]() Record marker (CTRL+M)
Using this shortcut while the analyzer is recording, add record marker to the signal. If there is a recording window, the maker is displayed. During the recording, a comment can be added to the record marker, via the properties dialog box.
Record marker (CTRL+M)
Using this shortcut while the analyzer is recording, add record marker to the signal. If there is a recording window, the maker is displayed. During the recording, a comment can be added to the record marker, via the properties dialog box.
The record marker is available from the Analysis\Record group. See Analysis tab.
Copy marker table
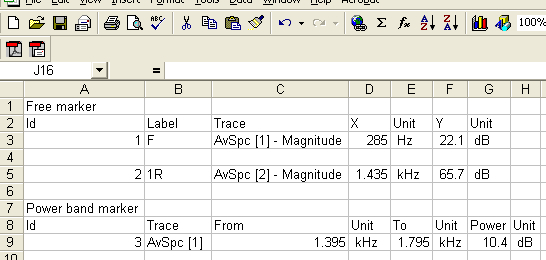
Available in Infotrace area. Used to copy marker data to the clipboard. The data is formatted to be pasted easily in Word® or Excel®.
Example of result with this command:
For Word®:
Free marker
Id Label Trace X Unit Y Unit
1 Marker Sig [1] 0.00141 s 5.453 V
For Excel®:
Marker table in reports
The marker table can be droped in the report template. See NVGate Report for details.
Marker manager
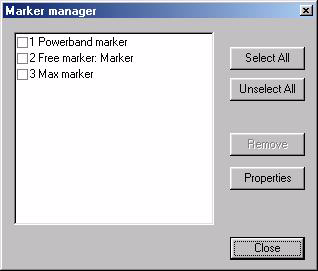
Gives the list of all the markers in the window, except record markers. In this dialog box, any window marker can be removed or modified.
- Select All: Checks all the items of the list
- Unselect All: Uncheck all the items of the list.
- Remove: Removes all checked markers from the window
- Properties: Displays the properties dialog of the active marker of the list.
