Difference between revisions of "NVGate 2022: Release note"
| Line 34: | Line 34: | ||
== New units available == | == New units available == | ||
[[File:unit.PNG | [[File:unit.PNG]] | ||
Angular velocity: Hertz | Angular velocity: Hertz | ||
Revision as of 16:22, 8 December 2021
NVGate 2022
Ergonomics
Tab: new icone disposition
Go to results: new one click icones
RPM buttons create automatic events
New settings by default
The settings by default in NVGate have been update to the one below. With this default seetings, you can do rotating analysis measurement directly.. Be aware than if you load an exiting project , this is NOT affected you previous settings are keep. You can also easily change this settings.
FFT Overlap: 66%
FFT lines: 3200
FFT Overall low freq : 2 Hz
SOA resolution: 1/8
SOA overlap: 5
SOA OVL lower order: 0.2
Event Delta RPM: Delta velocity 10 rpm
Waterfall Depth: 1000
Tachometer/RPM Profiles/ duration: 120 sec
New units available
Pressure: Pascal and Bar
Torsionnal velocity: RPM
NVGate reader
Use NVGate in reader mode : no need usb dongle or hardware.
Fractionnal tach : ration over 100
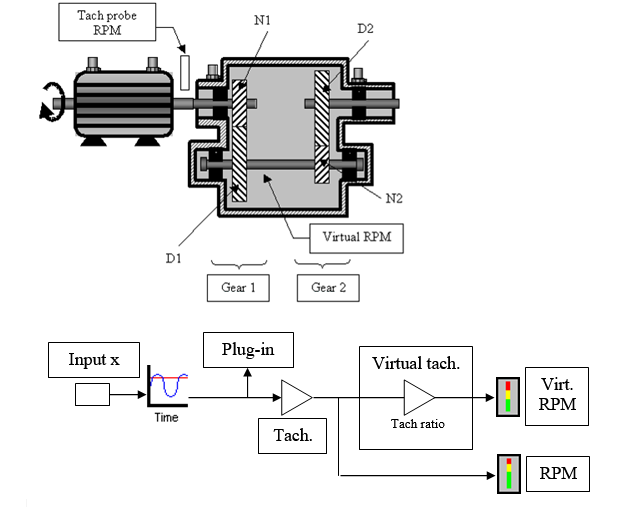
![]() : Fractional tachometer: computes RPM speed for a non accessible shaft by using gear ratio setting. Adapted for gear boxes and transmissions. The ration ca be now set up to 100 ! (previously it was 2)
: Fractional tachometer: computes RPM speed for a non accessible shaft by using gear ratio setting. Adapted for gear boxes and transmissions. The ration ca be now set up to 100 ! (previously it was 2)
Used to define up to 4 fractional tachs using data from the tach or the Ext Tach.
- Tach ratio: this is the ratio between the output angular speed and the input angular speed. This setting is defined by the product of 2 fractions: N1/D1 * N2/D2 where N1, D1, N2 and D2 are integer values. Tach.1 / Tach.2 ratio maximum value can be set up to 100.
Up to 3 real time: plug in SOA
Oros , leader on rotating vibration analysis, is the only one in the world to let you do at the smae time: 3 real time synchronous order analysis (this is also available in post analysis.)
Add on : PV (pressure volume) diagram
How to use :
- Define one (or more) channel as a pressure.
- Add this channel into Sync. order (SOA) plug in.
- On SOA plug in , average, domain, select: "Angular"
- Open PV_Diagram.exe
- Click on refresh (right click) in available results if you do not see anything.
- Select the input.
- Compute once will display the PV diagram base once based the last triggerd block.
- "background computation, will continuously compute the diagram.


