Difference between revisions of "Tutorial ODS modal"
| (3 intermediate revisions by the same user not shown) | |||
| Line 14: | Line 14: | ||
Rename you the .cfg file to your kipper and put them in the previously newly created folder from. Close to the window with "Save": | Rename you the .cfg file to your kipper and put them in the previously newly created folder from. Close to the window with "Save": | ||
[[File:1.png| | |||
[[File:1.png|500px]] | |||
==Create geometry == | ==Create geometry == | ||
| Line 24: | Line 25: | ||
The individual ways can be looked up in detail in the OROS Modal manual. The structure in this example is as follows: | The individual ways can be looked up in detail in the OROS Modal manual. The structure in this example is as follows: | ||
[[File:2.PNG| | [[File:2.PNG|500px]] | ||
==time data in NVGate== | ==time data in NVGate== | ||
| Line 40: | Line 41: | ||
Activate the required channels with the recorder and configure the sensors as usual. In addition , the point to be measured and the measuring direction of the sensor must be specified in the “Channel connection properties”. This must be adjusted after each measurement until all measuring points have been measured. In our example, input 1 always remains in the same place as a reference , the second moves away the other points in the structure. | Activate the required channels with the recorder and configure the sensors as usual. In addition , the point to be measured and the measuring direction of the sensor must be specified in the “Channel connection properties”. This must be adjusted after each measurement until all measuring points have been measured. In our example, input 1 always remains in the same place as a reference , the second moves away the other points in the structure. | ||
[[File:3_ODS.PNG| | [[File:3_ODS.PNG|500px]] | ||
==Recorder settings== | ==Recorder settings== | ||
| Line 52: | Line 53: | ||
The “Start to time” function ensures that all time measurements are exactly the same length at all points. If these are not of the same length, OROS Modal cannot process the data. | The “Start to time” function ensures that all time measurements are exactly the same length at all points. If these are not of the same length, OROS Modal cannot process the data. | ||
[[File:4_ODS.PNG| | [[File:4_ODS.PNG|500px]] | ||
| Line 64: | Line 65: | ||
It is important to adjust the node information (Node) and the measurement direction (Direction) in the "Channels connection properties" after each measurement: | It is important to adjust the node information (Node) and the measurement direction (Direction) in the "Channels connection properties" after each measurement: | ||
[[File:5_ods.PNG| | [[File:5_ods.PNG|500px]] | ||
These functions can also be added to the Control Panel for faster access: | These functions can also be added to the Control Panel for faster access: | ||
[[File: | |||
[[File:6_ODS.PNG|500px]] | |||
You can reach the “Customize Control Panel” menu by right-clicking in the Control Panel. Then create a new layout with the button marked in the middle of the window and then select the desired “Settings” and add them to the window using drag & drop. Then confirm with "OK". | You can reach the “Customize Control Panel” menu by right-clicking in the Control Panel. Then create a new layout with the button marked in the middle of the window and then select the desired “Settings” and add them to the window using drag & drop. Then confirm with "OK". | ||
| Line 75: | Line 78: | ||
Now make the different time measurements: | Now make the different time measurements: | ||
[[File: | [[File:7_ods.PNG|500px]] | ||
| Line 92: | Line 96: | ||
- "Excitation Mark" -> Unit of Y Axis -> m / s² Then select the UFF files using the "..." button | - "Excitation Mark" -> Unit of Y Axis -> m / s² Then select the UFF files using the "..." button | ||
[[File: | |||
[[File:8_ODS.PNG|500px]] | |||
Then select the previously created UFF files and click on "Open": | Then select the previously created UFF files and click on "Open": | ||
[[File: | |||
[[File:9_ods.PNG|500px]] | |||
Then use the "Batch Add" function and confirm with "OK": | |||
[[File: | Then use the "Batch Add" function and confirm with "OK": | ||
[[File:10_ods.PNG|500px]] | |||
The available data will now be displayed. Errors in the excited nodes or directions can be made here, then confirm with "OK": | The available data will now be displayed. Errors in the excited nodes or directions can be made here, then confirm with "OK": | ||
[[File: | [[File:11_ods.PNG|500px]] | ||
==Show result== | ==Show result== | ||
===Time domaion=== | |||
Now click on “Time Domain” in the “ODS Method Selection” menu item in the “Workspace Panel”. The waveform is then displayed: | Now click on “Time Domain” in the “ODS Method Selection” menu item in the “Workspace Panel”. The waveform is then displayed: | ||
[[File:12_ods.PNG|500px]] | |||
===Frequency domain=== | |||
You need to pass by the [[Modal_Signal_Processing|signal processing module]] and compute the PSD on the time signal, then Frequency ODS will be available. | |||
Revision as of 09:56, 4 February 2021
Instructions for using MODAL ODS (time signals) with NVGate
Create a project in OROS Modal
Start OROS Modal with your corresponding dongle. After starting, go to "File" -> "New ..." Select any folder on the hard drive for your OROS Modal projects.
ATTENTION: OROS Modal does not automatically create new folders for every project . This need to manually perform and is strongly recomme choose.
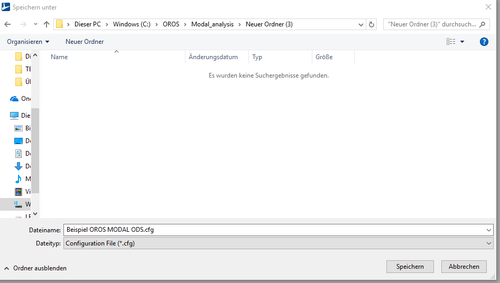
Rename you the .cfg file to your kipper and put them in the previously newly created folder from. Close to the window with "Save":
Create geometry
The geometry can be created in several ways. Import an existing geometry, create it with the help of OROS Modal or copy a table with the coordinate data of the individual points in OROS Modal (e.g. previously created in Excel).
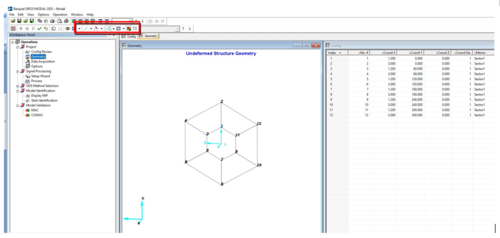
The individual ways can be looked up in detail in the OROS Modal manual. The structure in this example is as follows:
time data in NVGate
Create Project
Create a new project in NVGate.
For the ODS deflection shape are at least two sensors needed. In this case, accelerometers. A brake disc serves as the test object . This is made to vibrate with a pulse and the time data are recorded. The structure to be examined is normally in a stable working condition.
Activate the required channels with the recorder and configure the sensors as usual. In addition , the point to be measured and the measuring direction of the sensor must be specified in the “Channel connection properties”. This must be adjusted after each measurement until all measuring points have been measured. In our example, input 1 always remains in the same place as a reference , the second moves away the other points in the structure.
Recorder settings
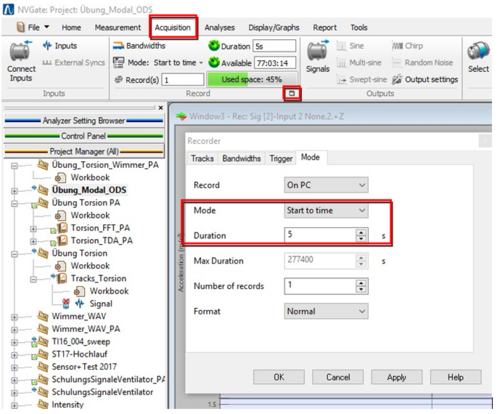
In the recorder settings in the "Acquisition" tab, the recorder mode must be switched to "Start to time". The desired recording duration can then be selected as desired.
The “Start to time” function ensures that all time measurements are exactly the same length at all points. If these are not of the same length, OROS Modal cannot process the data.
Recording of the time signals
Time signal recording can either be started manually or triggered by certain events (see manual).
It is important to adjust the node information (Node) and the measurement direction (Direction) in the "Channels connection properties" after each measurement:
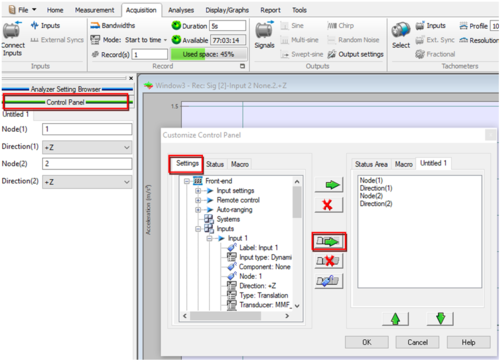
These functions can also be added to the Control Panel for faster access:
You can reach the “Customize Control Panel” menu by right-clicking in the Control Panel. Then create a new layout with the button marked in the middle of the window and then select the desired “Settings” and add them to the window using drag & drop. Then confirm with "OK".
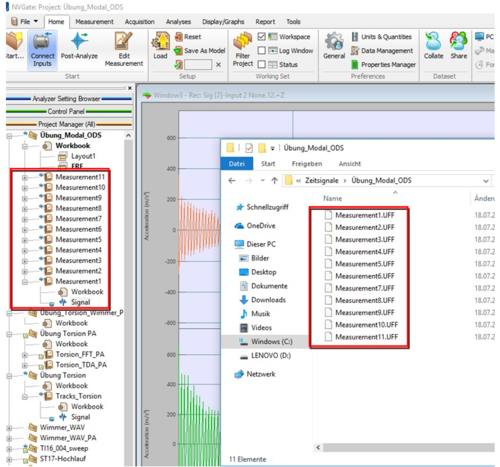
Now make the different time measurements:
Signal acquisition in NVGate is now complete.
Import into OROS Modal
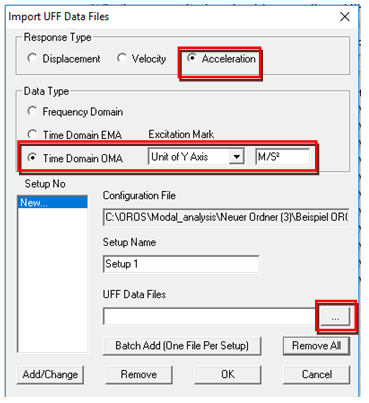
Now go to “File” -> “Import” -> “Data Files (UFF)”. Choose the following:
- "Response Type" Acceleration
- "Data Type" Time Domain OMA
- "Excitation Mark" -> Unit of Y Axis -> m / s² Then select the UFF files using the "..." button
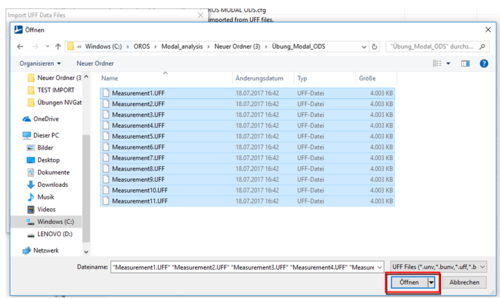
Then select the previously created UFF files and click on "Open":
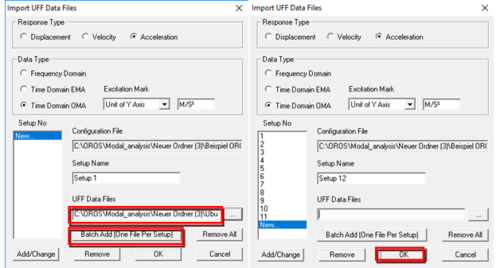
Then use the "Batch Add" function and confirm with "OK":
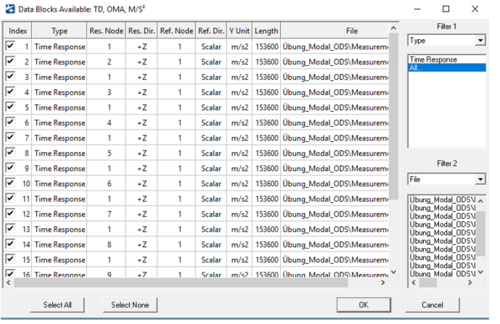
The available data will now be displayed. Errors in the excited nodes or directions can be made here, then confirm with "OK":
Show result
Time domaion
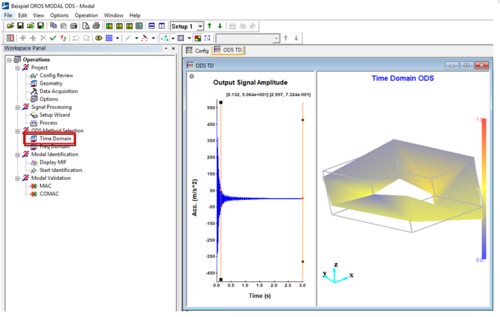
Now click on “Time Domain” in the “ODS Method Selection” menu item in the “Workspace Panel”. The waveform is then displayed:
Frequency domain
You need to pass by the signal processing module and compute the PSD on the time signal, then Frequency ODS will be available.
