Difference between revisions of "Sound Intensity Manual"
| Line 1: | Line 1: | ||
Introduction Video | |||
<youtube>https://youtu.be/4FbRuttvxOM</youtube> | |||
==Installation Guide== | ==Installation Guide== | ||
====Equipment required for the installation==== | ====Equipment required for the installation==== | ||
Revision as of 11:51, 8 December 2020
Introduction Video
Installation Guide
Equipment required for the installation
Software CD containing OROS Sound Intensity.
One OROS Sound Intensity dongle and NVGate installed and authorized.
Installation
Installation of the NVGate software
-->In a first step, if it was not done before, NVGate Software should be installed:
To achieve this installation, please refer to the relevant installation guide delivered with your analyzer.
OROS Sound Intensity installation
-->In a second step, the OROS SOUND INTENSITY software can be installed:
1. Run the "setup.exe" file from the "software" directory of your installation CD.
2. Run the protection dongle driver installation by starting the "hldrv32.exe" file from the
"Hardlock Driver" directory of your installation CD.
3. Install the Acrobat Reader application from the "Acrobat reader" directory if it is not done yet.
4. Insert the USB dongle on the USB Port of your PC.
You are now ready to use the Sound Intensity Solution software.
The Online Help will give you further detailed information on the software use.
Update the keys
-Download Haloren and Halorid here.
-Plug your dongle
-Launch Haloren.exe
-Search the .duf (provide by your local support)
-click on "code".
The dongle is updated.
Known issue. : If this is not working, launch Halorid.exe, clik on "read data" and send a print screen to your local support.
SOUND INTENSITY User's manual
Measuring Sound Power using Sound Intensity:
The basics
The sound power radiated by a noise source equals the sum of the scalar products of the sound intensity vectors by the elementary area vectors over a surface enclosing the sound source.
The OROS Sound Intensity package has 2 main objectives:
1. Calculate the sound power of a source from intensity measurements;
2. Allow a 3D representation of the sound emission distribution on the measurement grid.
The procedure followed by the software complies with the prescriptions of the International Standard ISO 9614. Such a tool is particularly helpful when one of the field indicators specified in the standard does not satisfy the necessary requirements. As a matter of fact, in some cases, the measurements must be repeated by successive refinements of the measurement grid. It's plain that this procedure could be rather time consuming.
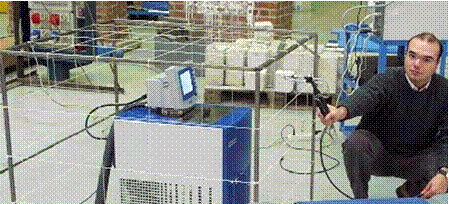
The standard requires the definition of a measurement surface which encloses completely the noise source under test. Typically, the measurement area is a parallelepiped composed of five faces. Each of these faces is decomposed into discrete areas where measurement points will be positioned.
Typical Sound Intensity measurement
Each of these areas is called measurement segment or segment. In ISO 9614 Part I, each segment is associated with a measurement position whereas ISO 9614 Part II prescribes to scan the faces. The data stored during the measurement are the pressure and sound intensity levels in 1/1 or 1/3 octave bands.
According to the standard requirements the following information are also necessary have to be entered by the operator or calculated by the software:
- Description of the test source (Dimensions, etc. …)
- Description of the test environment (Air temperature, Static pressure, etc. …)
- Place and date of the measurements
- Expected grade of accuracy
- Test Equipment (Sound Intensity Probe type and S/N, Microphone pair etc …)
- Calibration set-up and procedure
- Pressure Residual Intensity index (also known as PRI Index)
- Geometric parameters of the measurement surfaces and segments
During the measurement, the sound pressure spectrum and sound intensity spectrum have to be monitored and are usually displayed in real time (1/1 or 1/3 octave spectra or even narrow band FFT spectra). The real time performances of the OROS PC Pack enable the program to show and import directly any pressure and intensity data from the analyzer, allowing thus a real time control of the measurement. It is possible to set up the acquisition procedure (measurement sequence or random access to the data structure) to decide in which way to fill up the segments or how to complete the measurements. A three dimensional visualization both of pressure and intensity fields on the measurement surfaces is displayed using color contour plots.
The calculation of the indexes defined by the standard giving information about the quality of the determination and hence its grade of accuracy is calculated repeatedly:
- Temporal variability indicator
- Pressure - Intensity indicator
- Negative partial power indicator
- Non uniformity indicator
If one of the indexes does not meet the requirements, the test procedure should be modified.
The Sound Power Level is calculated for each surface and each frequency complying with the ISO 9614-1 flowchart showing directly the steps the user must take in order to comply with the Standard requirements. A table gives a comprehensive insight of the field indicators computed for each surface taken into account in the sound power computation. The acquisition and calculation procedures include the treatment of one-octave and one-third-octave band data as well as FFT data. The Sound Power levels are calculated for each surface and can be displayed also for the overall measurement surface with or without "A" weighting. Finally the following parameters are displayed:
- Sound power level spectrum
- Sound Power Report
Operating Modes
The software is organized around two main modes that correspond to two steps of the measurement procedure:
- Measurement surface and environment design using the Surface Editor Mode
- Measurement set-up, data acquisition and analysis using the Main Mode
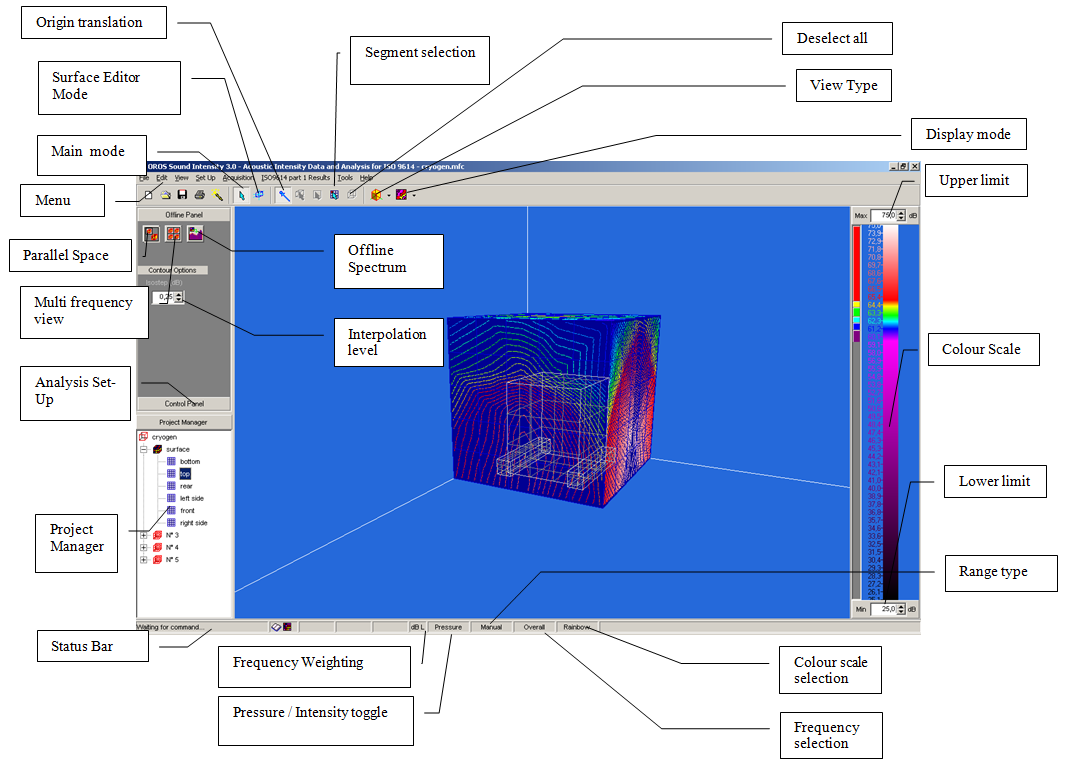
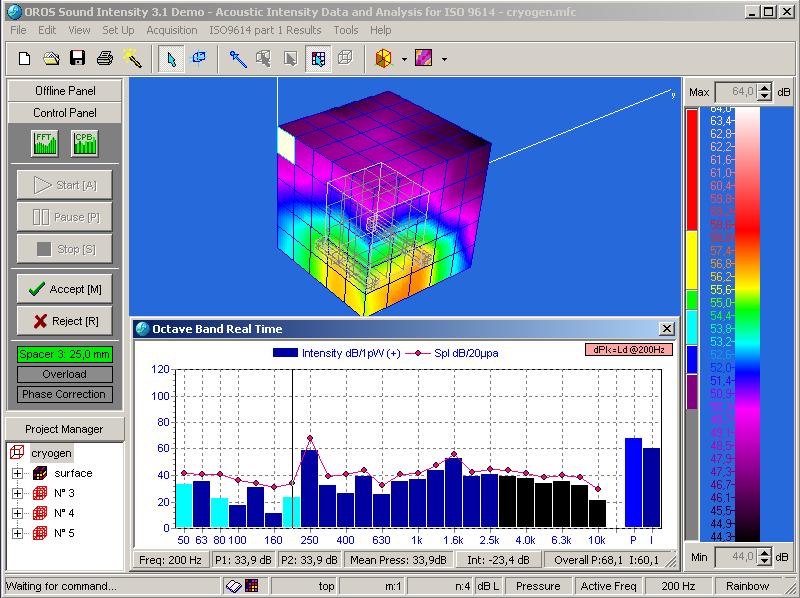
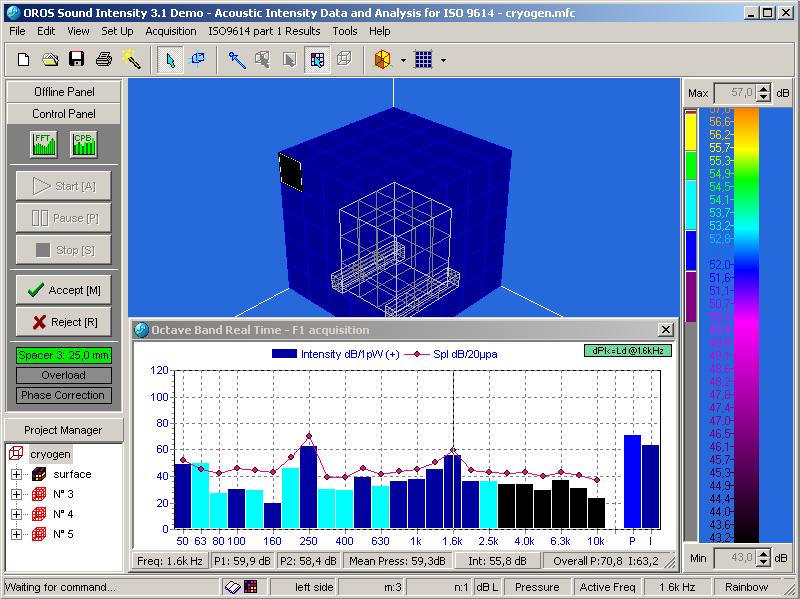
The following figure shows the main user interface during the Main mode:
Main operation mode screenshot
These 2 modes have different objectives and consequently different functionalities will be active according to the active mode. One mode or the other is selected by pressing the corresponding icon in the task bar.
Wizard
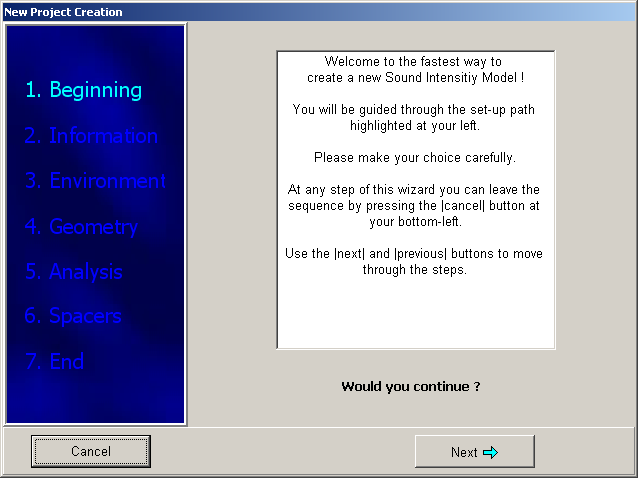
The wizard is the fastest way to start with a new model. To start the wizard, select the wizard command from the file menu. The windows shown in the following figure will start guiding you through the next steps.
Start of the wizard
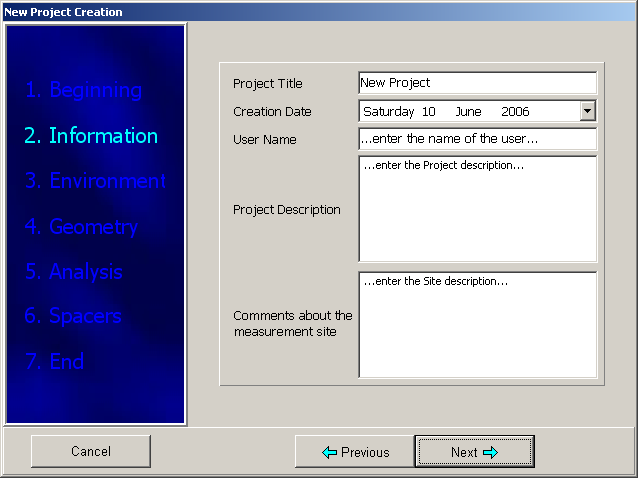
Clicking the Next button, the software will display the subsequently window, concerning the Project Name, the Creation Date, the User Name, the Project Description and the Comments.
Information section of the Wizard
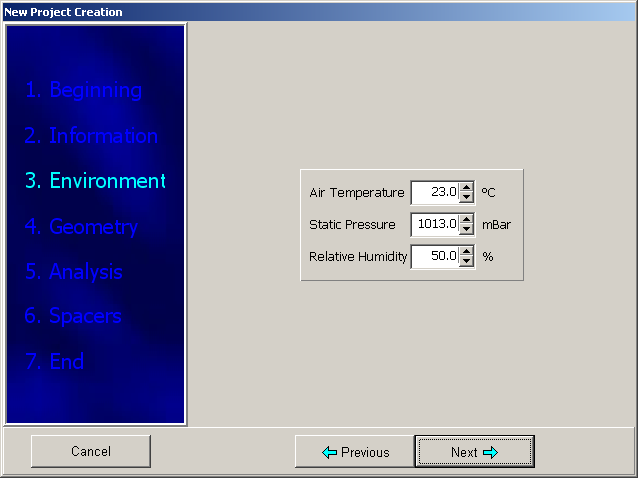
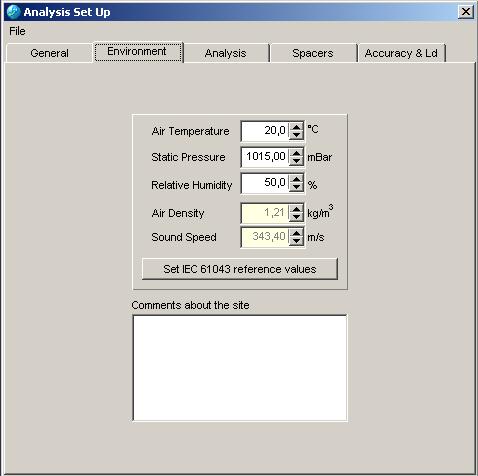
The next step is to enter the environmental data, such as Temperature, Static Pressure and Relative Humidity.
Environmental data
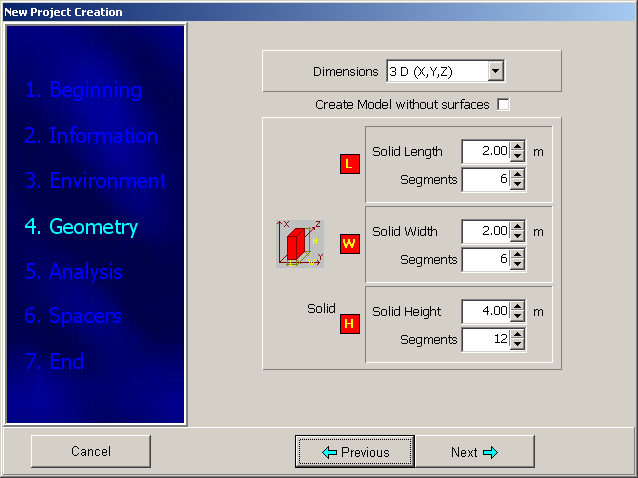
Then the user has to choose the type of project (2D or 3D), the dimensions of the control surface enveloping the sound source and the number of segments for each dimension.
Geometry of the control surface.
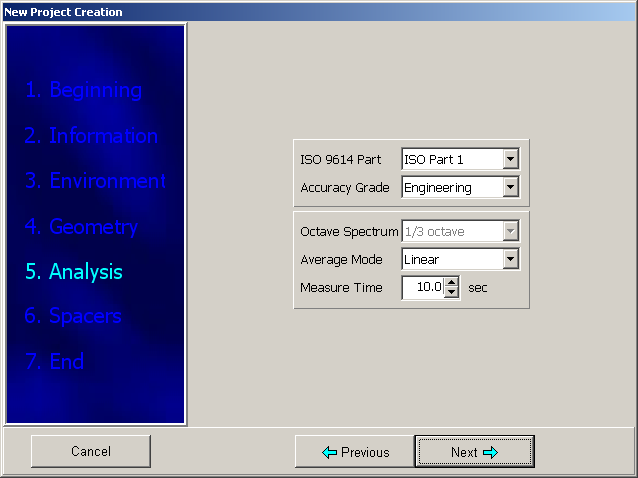
The 5th section concerns with the selection of the analysis parameters. The user has to choose the Standard to use for the determination, the Grade of Accuracy, the Averaging Mode and the Averaging Time.
Set up of the analysis parameters.
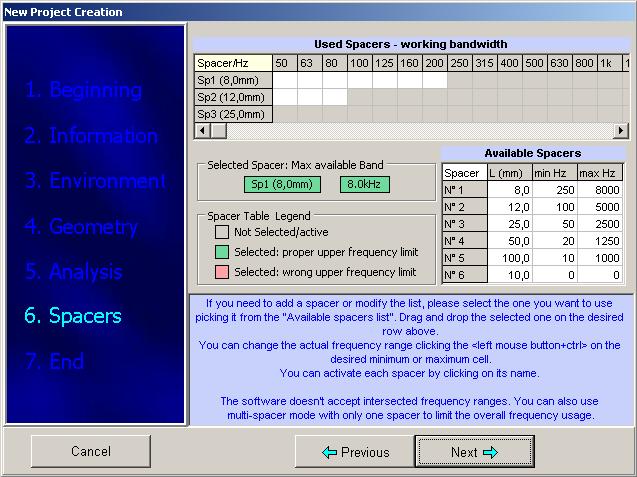
In the next window, the user has to select the spacers used to cover the frequency span of interest.
Spacer selection.
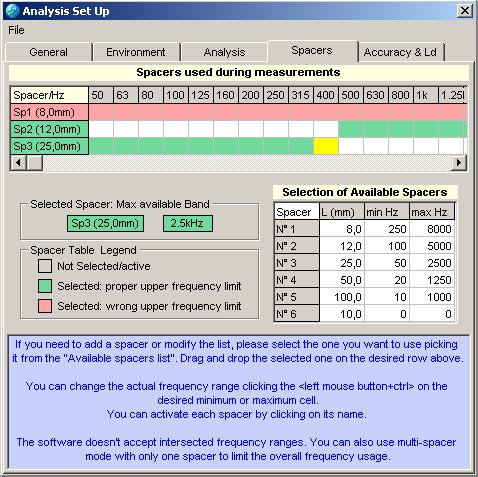
Select from the available spacers list the spacers you want to use during the measurement. Drag and drop the selected spacer on the desired row. To change the frequency range, click with the left mouse button on the frequency cell related to the desired spacer. The relevant frequency span lights up in green. To change the frequencies, the user has to click with the left mouse button on the lower or the highest frequency of interest while pushing the ctrl button on the desired minimum and maximum cells. You can activate each spacer by clicking on its name. The software rejects intersected frequency spans. You can also use multi-spacer mode selecting only one spacer to limit the overall frequency usage. Finally click on the Next button to reach the end of the wizard.
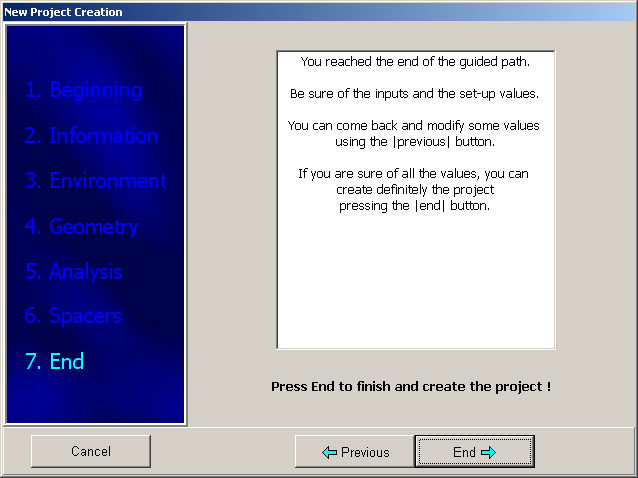
End of the wizard procedure.
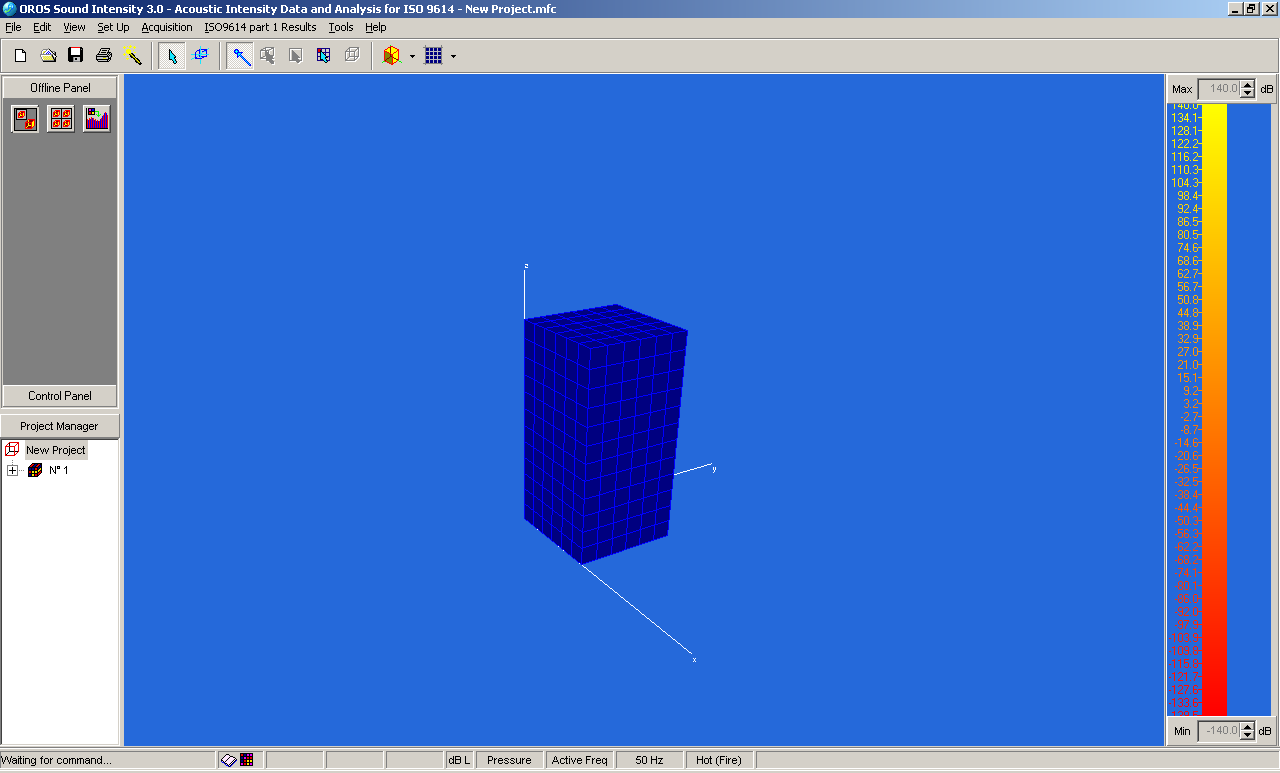
Then the measurement surface will be displayed and the user will be able to start the sound power determination according to the Set-up edited in the previous sections.
Begin of the determination after the Wizard Setup.
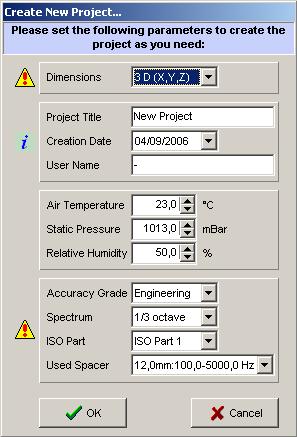
| It is also possible to start with the short Wizard by pressing the "New Project" button in the Main Menu: it offers to the users to input the main project properties: |
|
| Create a new project |
Surface Editor Mode
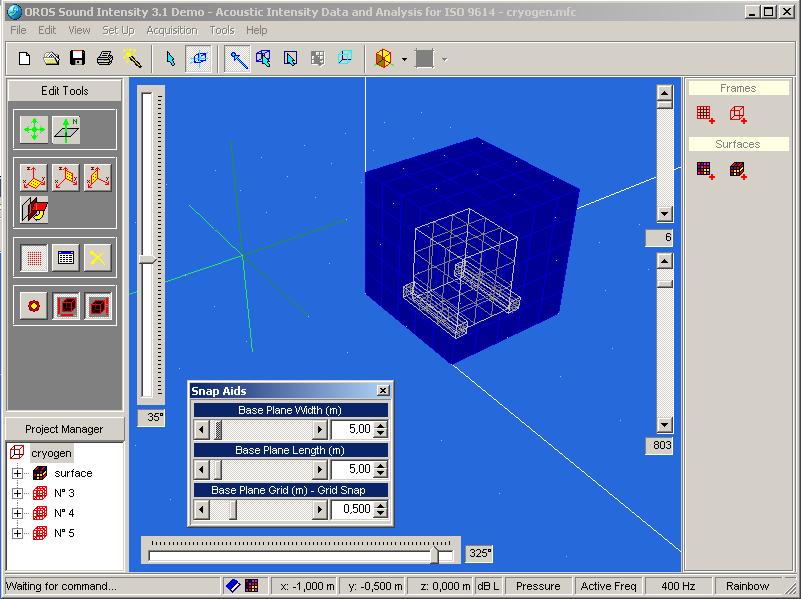
The first thing to do when starting a new project is to define the geometry of the measurement surface and the structure of the contained objects. In the Surface editor mode, the screen changes as shown:
Graphic editor mode
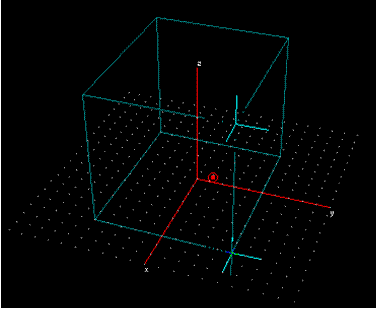
It's noteworthy the presence of a reference plane (dotted plane) functional to the generation of the surfaces. In fact each operation starts placing the first point of the object on this building plane.
Notice that there are two kinds of editable objects in this operation mode:
- Frames
- Surfaces
Frames are parallepipedic elements used to represent the source and its environment Surfaces are parallepipedic elements used to represent the measurement surfaces. They can be divided into segments, each one defining a measurement position. Measurement data can only be acquired or saved on a surface and not on a frame. Objects (Surfaces or Frames) are composed of one or several faces decomposed into segments. The above displayed figure shows the surface editor interface. In addition, the user can modify created object. In particular objects faces can be translated horizontally or vertically.
D display tools
The 3D display tools described in this section are available when the corresponding option was purchased.
Using the mouse left button and specific keyboard keys (Ctrl and Alt) the 3D displays can be handled for:
- Translating the display origin: Drag with left mouse click. The Origin translation icon must be toggled on (for further details see Section 2).
- Rotate the display: Ctrl key + Drag with left mouse click
- Zoom the display: Alt key + Drag with left mouse click
Base Plane
While carrying out all the editing operations the snap function can be used in order to make the cursor move stepwise on the base plane.
All the editing commands are referred to the Base Plane that is the dotted surface on which the cursor can move.
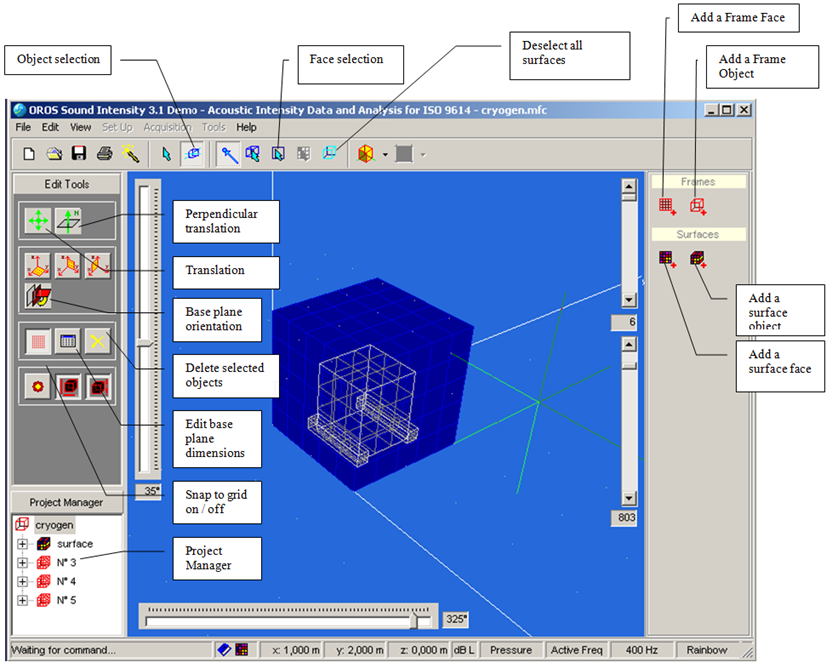
The length of the step and the base plane extension can be set up by activating the button "Edit base plane dimensions" and dragging the bars to reach the required extension and the distance between two consecutive points.
The window and the relevant commands are shown in the following figure.
Graphic editor mode and Aids toolbar
Adding Objects & Faces (Surface or Frames)
To build a new frame or measurement surface, select the corresponding object on the tool bar shown in the right part of the screen when you are in the graphic editor mode and click with the left mouse button on the point you want to start from. Then drag the cursor on the dotted plane until you have reached the length required for the first side. Click left again and drag the cursor to build the base rectangle. At this stage you can "extrude" the third dimension and finish to build the surface by clicking the left mouse button in the place you want to put the third point.
Surface generation
Element Selection
In the Surface Editor mode several objects modification can be achieved if the element is previously selected. The element can be selected by using the selection icons placed on the task bar. Selection can be made on a segment, a face on an entire object or even several objects (It is always possible to select more than one object at a time). To unselect the selected element, one additional click on it or the use of the "unselect" icon will do the job. Selected elements are highlighted with a specific color.
Main tool bar
Element type Filtering
Before performing any modifications to the geometry, the user must decide if the actions have to be undertaken over frames or over measurement surfaces. To do this he has to select the object type using the appropriate command under the Edit / Selection Menu.
Element Translation
In order to be able to make geometric modifications (horizontal and vertical translation) an element (object or face) to perform the operation on should be selected (as described in section 3.4).
The Snap to grid function can be used to help objects be translated stepwise.
Translation
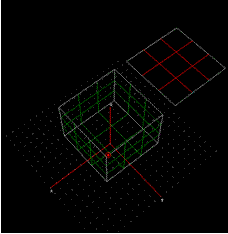
With this command it is possible to move a selected element (object or face) in the graphic editor interface by keeping it parallel to the base plane. In this case, click with the left mouse button and drag the cursor in the desired direction.
Horizontal translation
Perpendicular Translation
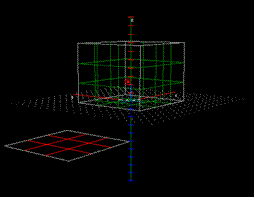
This command is useful for moving the selected plane orthogonally to the dotted reference plane. You have to click the left mouse button also in this case and drag the cursor in the desired direction. Click the right mouse button or press the Esc button to quit the command.
Vertical translation
Project Manager
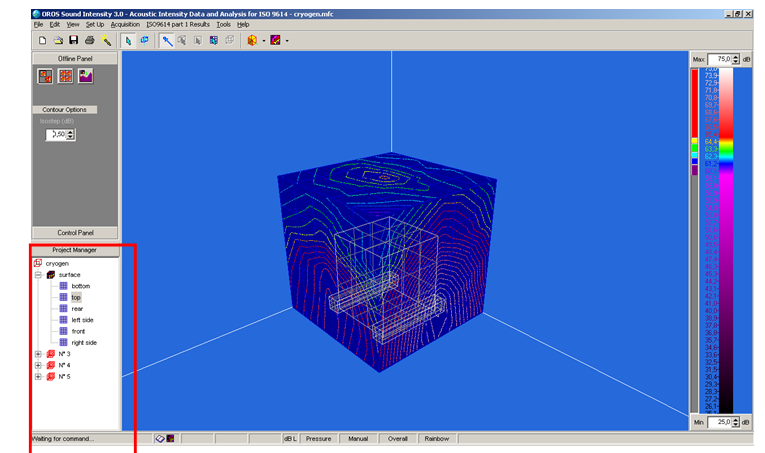
The Project Manager is always visible in the lower left part of the main window, as shown in the following figure. The tree structure shows the objects introduced in the projects by means of an icon. Each frame or surface can be decomposed in the single faces expanding the structure.
Project manager location
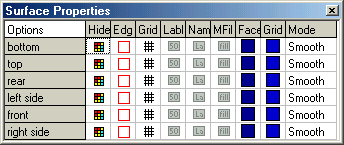
The user can see the properties of each item of the tree structure by selecting it and clicking with the right mouse button on the relevant icon. The properties change according to the item the user select from the project manager. Choosing "Properties" from the pop-up menu obtained for the whole surface, the user activates the window shown below:
Graphic properties window for a surface
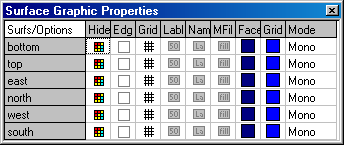
The first column enables – disables the drawing of a surface, the edge column enables – disables the drawing of the edges of the surfaces, the Grid column enables to show the grid subdivision for the surfaces.
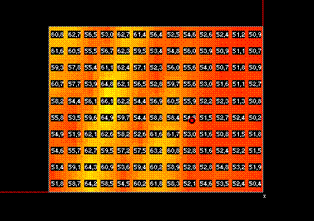
The Label column switches on – off the figures associated with each segment (pressure or intensity data).
Pressure values distribution over a measurement surface
The Name column enables to show – hide the name of each surface.
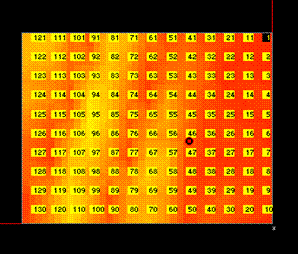
The Mfill column enables to show the filling sequence for each surface: it switches on – off the figures associated with the filling sequence adopted for a surface.
Filling order of a measurement surface
The black cell in the upper right corner is the starting point for the filling up which has to be set up with the project structure menu (see Project structure Section).
The last three columns are useful to set-up colors for the face and the grid of each face.
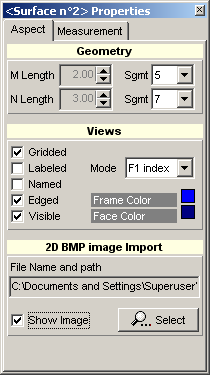
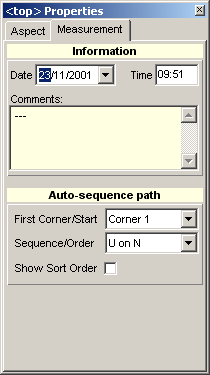
If the user selects the Surface Properties for a sub-surface, the program will open the following windows.
Properties window for a sub-surface
This window enables the user to set up and configure several surface properties:
Aspect Tab
- Number of horizontal and vertical subdivision of the surfaces;
- Drawing properties;
- Frame color;
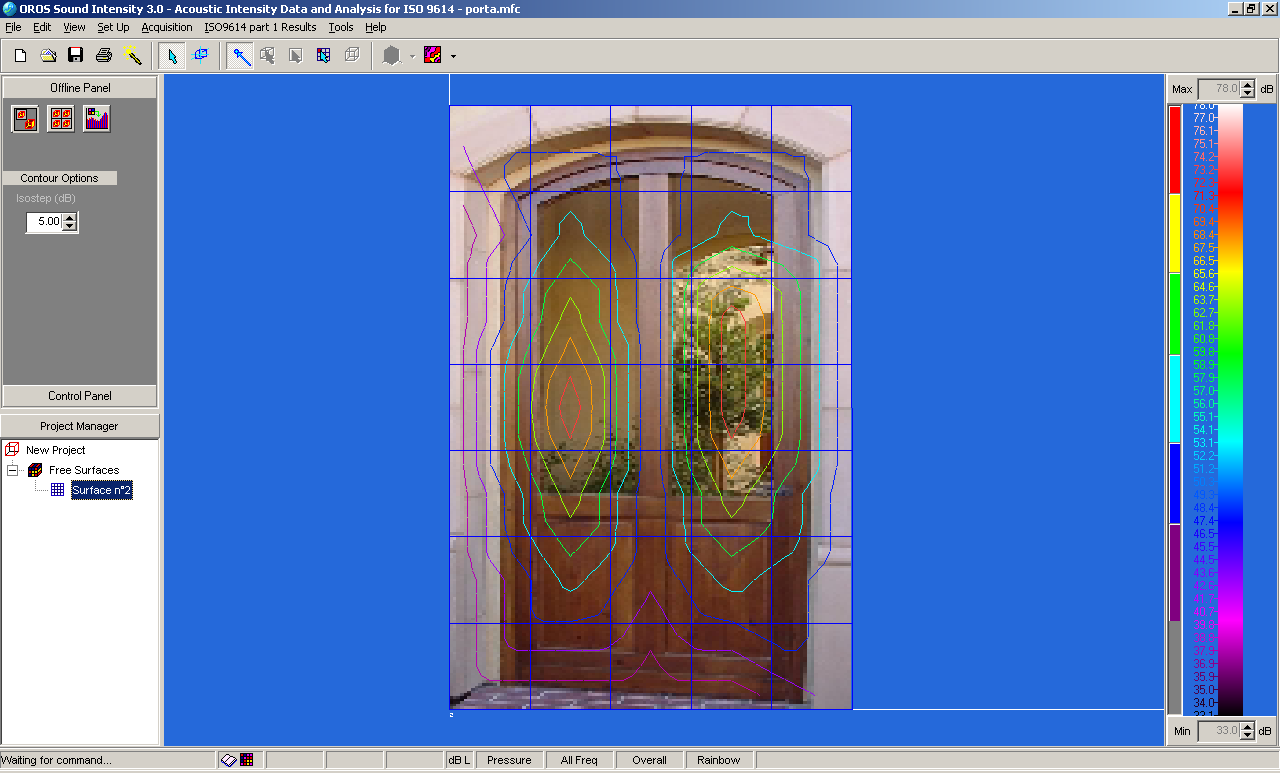
- Overlay image (for 2D projects).
Overlay image.
Measurement Tab
- Date and time of edition for the properties,
- Filling procedure.
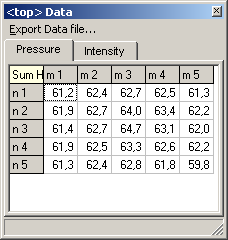
The Surface Data command shows a window containing Pressure and Intensity tabs, and enable the editing of the data loaded for the relevant surfaces.
Data can be exported in .txt files clicking on the relevant menu.
Project structure and Pressure tab
It is very important to distinguish the measurement surface from the frames. For this reason the measurements surfaces are described by coloured parallelepipeds and the frames by red gridded parallelepipeds.
Surfaces
Concerning the properties for the Surfaces, the user can set up:
- the number of subdivisions for each surface,
- the starting point to begin to fill the cells,
- The filling order.
In this way the user has to select, at first, the corner of the rectangle from which he begins to import and store the data.
The sort mode order can be chosen between two types:
- Z: the filling procedure goes on until it reaches the end of a row or a column, then it starts to fill the next row or column in the same direction of the first one.
- U: the filling procedure goes on until it reaches the end of a row or a column, then it starts to fill the next row or column in the opposite direction used for the first one.
The same window can be used also to select the surfaces for editing the geometry and to delete them. To select a surface the user has to double click on the frame or surface icon describing the item. The corresponding icon will light up. Then the user can enter the editing mode and choose if he wants to perform a geometry editing command (see the relevant section) or delete it. To delete the selected surface(s), click on the remove button.
The properties command activates a window. The first column enables to hide the frame corresponding to the selected cell. The second column hides the borders for the selected frame and the third activates/deactivates the grid. The name column enables to show the name linked to a surface. Finally the face and the grid columns can be used to change the color of these items for the selected frame.
Test Set-Up
The Analysis set-up is achieved with the Main Mode on.
Equipment Set-Up
In this window the user can choose the analyser Type and Model, select the microphone pair, the spacer length, and set up the remote control button functions.
Before starting a new real time acquisition session the user has to set up the analysis parameter. To do this, select the equipment group from the Set Up menu.
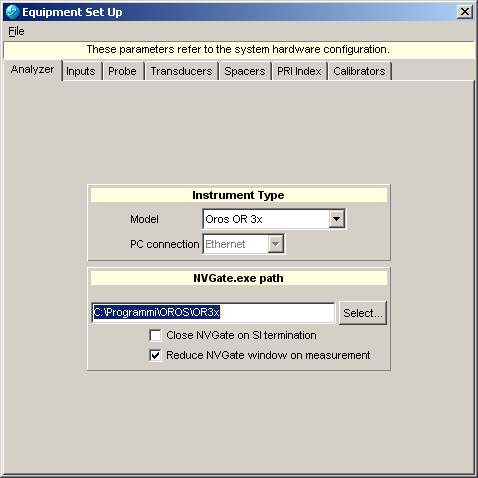
In the Analyzer tab the user can choose the Model of the analyzer used for the application. This task can be performed by clicking the relevant box and choosing the right item from the drop down menu. Another option is the selection of the NVGat.exe file. That can be done browsing the content of the Programs folder and selecting the relevant file.
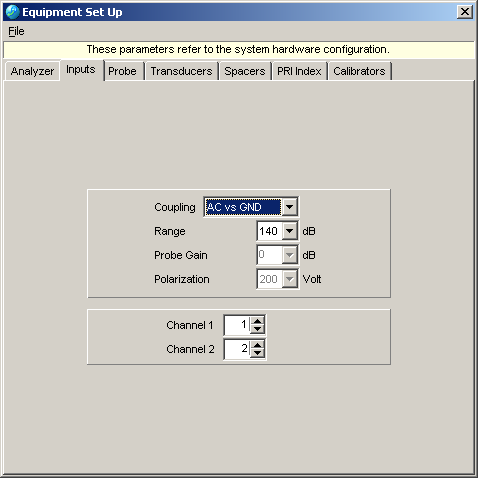
In the Inputs tab it is possible to set up the channels coupling, the channel gain (the same for both channels), the probe gain (as info) and the polarisation voltage for the microphones (as info). In the case the user is employing an OR 3X analyser, it is possible also to select the physical channels attached to the intensity probe.
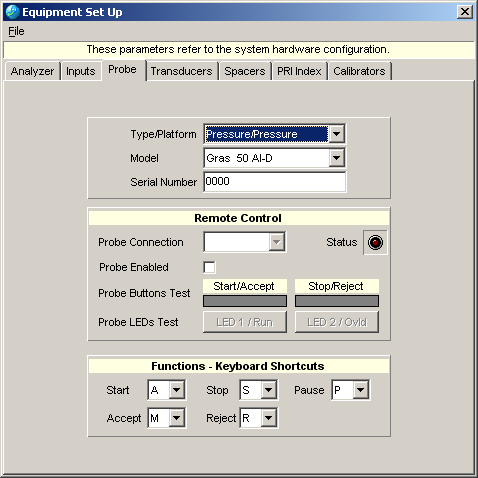
The Probe tab allows the user to select the probe type, the model, to enter the serial number, to set up the probe serial remote control and the keyboard shortcuts.
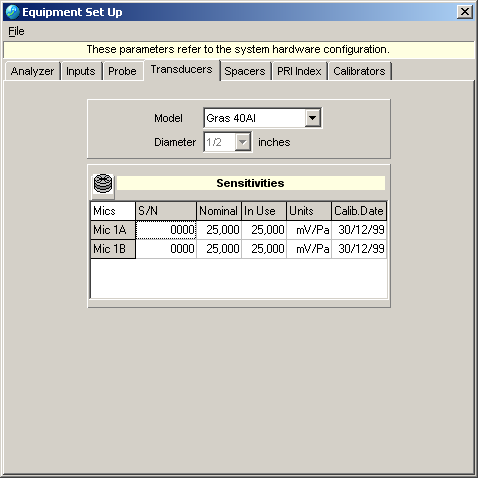
The Transducers tab enables the user to select the microphone pair by means of a drop down menu linked to a transducer database. The value for the sensitivity will be loaded in the relevant fields of the table at the bottom of the window. All these values can be edited by clicking the table fields.
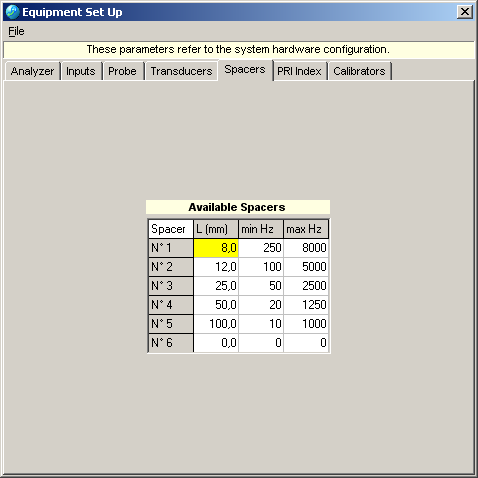
The table shown in the Spacer tab must be used to set-up the spacer length and the measurement frequency span for each one. The spacers defined in this tab are the only ones visible and selectable during the editing and arrangement of the spacers in the Analysis Set-up.
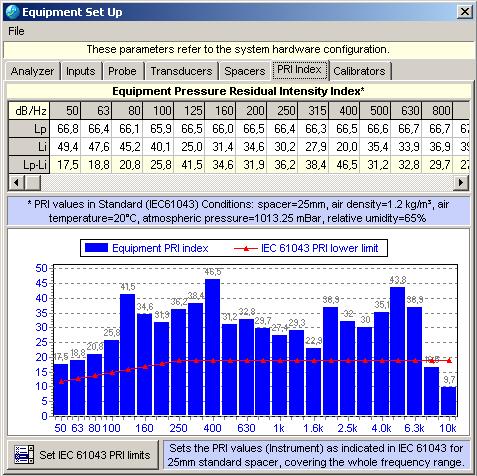
The PRI index Tab shows the Pressure Residual Intensity Index for the measurement chain in use (both numerically and graphically) and the comparison with the IEC 61043 Standard Limits. Using the Load and Save buttons, the user can retrieve from or write to the disk several PRI profiles. Pushing the Set IEC 61043 PRI limits button, the default limits specified in the standard are loaded. The PRI here used is referred to the actual measurement chain and it follows the advices of the standards: the PRI is the one for the 25mm spacer. During the measurement the software automatically computes, depending on the spacer in use and its frequency range, the corrected values for each active frequency band. The values of the PRI spectrum can be edited typing in the Lp and Li cells (useful if the user has the probe/system calibration chart from the producer or the Calibration Laboratory).
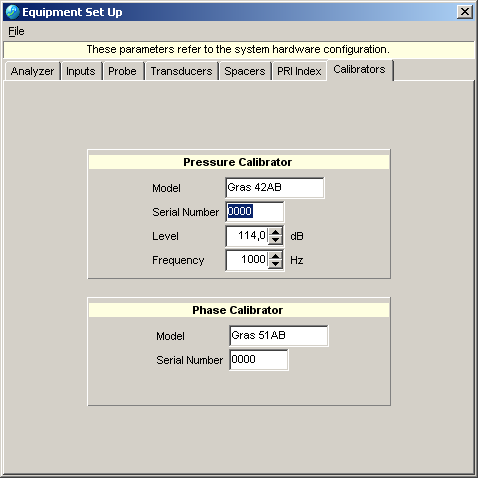
In the Calibrators tab the user has to enter the data of the calibrators that can be used both for pressure and phase calibration (Manufacturer - model, Serial Number, Calibration level and frequency).
The user has to pay particular attention to the parameters edited in these fields because they can heavily affect the sound power determination.
|
|
Tabs for the equipment set-up
Analysis Set-Up
In the Analysis Set Up the user can enter and modify several settings referred to:
- The project data;
- The environmental settings;
- The FFT Analysis parameters;
- The spacers set up to cover the whole frequency span of interest;
- The grade of accuracy for the power determination.
Also in this case the user has to pay particular attention to the parameters edited in these fields because they can heavily affect the sound power determination.
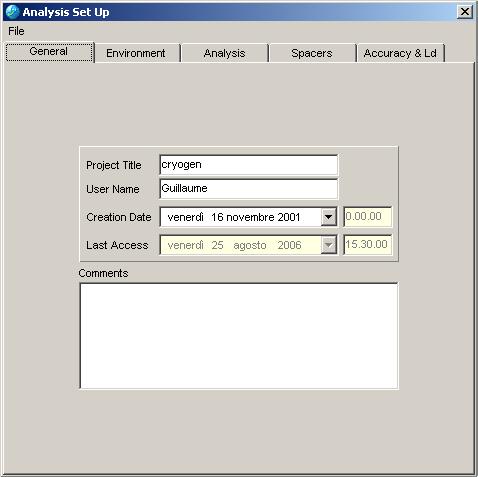
Tabs for the analysis set-up properties
In the General tab the user can set up the project title and the user's name by entering the data in the relevant fields. To select the creation date click in the area and select the right one from the calendar.
The Environment tab can be used to enter the air temperature and the static pressure data. The air density will be computed according to the above entries. The user can also specify the information about the relative Humidity.
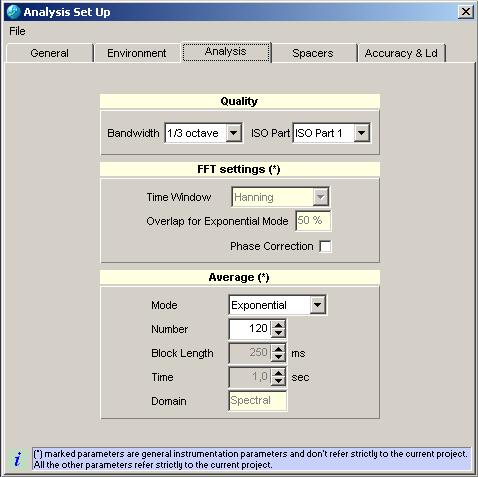
Through the Analysis tab the user can set up the averaging mode (linear or exponential) and the averaging time or the number of averages. The averaging time will be computed accordingly to the selected number of averages.
In the Spacers tab the user can select the spacers to use during the sound power determination and set up the frequency span for each one of them (and to cover the entire frequency span of interest).
If the user need to add a spacer or modify the list, he has to select the one he wants to use picking it from the Available spacers list (it is possible to modify this list only in the Equipment Set Up area).
The user has to Drag and drop the selected spacer on the desired row from the list.
Dragging and dropping the selected spacer in the desired row of the list placed in the upper part of the window, the user will be able to edit the frequency span covered by each one of them (modifying what is suggested in the table of the Equipment Set Up area).
To change the actual frequency range the user has to click the <ctrl> + "left mouse button" on the desired minimum or maximum frequency cell.
The software checks:
- if the spacers used are coherent with the actual spacer list set in the Equipment Set Up area
- if the higher frequency limit of the spacer if compatible (finite approximation criteria) with its physical length
and warns the user by both the coloured label and the message box confirmation closing this area.
Each spacer can be activated by clicking on its name. The relevant frequency span lights up in green. Please note that the software:
- doesn't accept intersected frequency ranges coming from more than one spacer
- requires that at least one spacer is selected
- warns if the range is not compatible
Please pay great attention about the PRI because Field indicators depend strictly on used spacers.
Summarizing the PRI usage:
- There is one Equipment PRI spectrum that refers to the measurement chain in the Equipment Set-Up area, and it represent the characteristic of the instrumentation used for the nominal spacer established by the standard at the 25mm length.
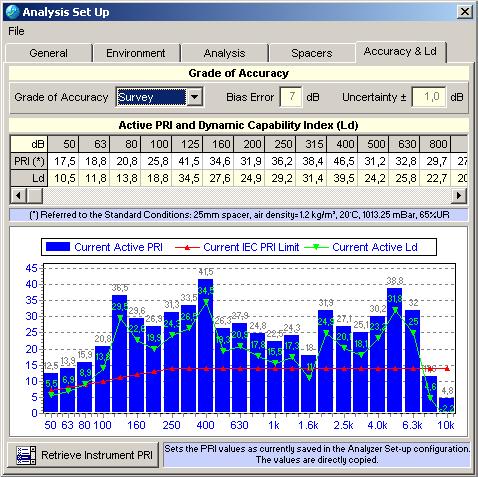
- There is the Active PRI spectrum used in the actual measurement and it is in the Analysis Set-Up area; it is affected by the spacer lengths finally used, dynamically computed upon the frequency bands associated to the spacer itself. Choosing different spacers combination with different frequency ranges, it is possible to see the effect directly in the following Accuracy and Ld. tab.
Control Panel
In the Accuracy and Ld tab the user can:
- set up the desired grade of accuracy among the types defined in the ISO 9614 Standard;
- find out or edit the pressure/residual intensity index stored for the apparatus;
- see the graph of the dynamic capability index of the selected measurement chain;
- Manually retrieve the values of the dynamic capability index from the file saved in the Analyzer set up configuration.
- It is also possible, pressing the lower button, to get (reset) the default PRI spectrum saved in the Equipment Set-Up Area.
Acquiring Sound Intensity & Sound Pressure
Data acquisition is achieved with the Main Mode. The functions described hereafter can be accessed in two ways:
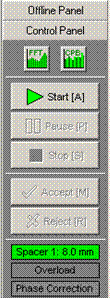
- The Control panel for the real time acquisition, placed in the left part of the screen
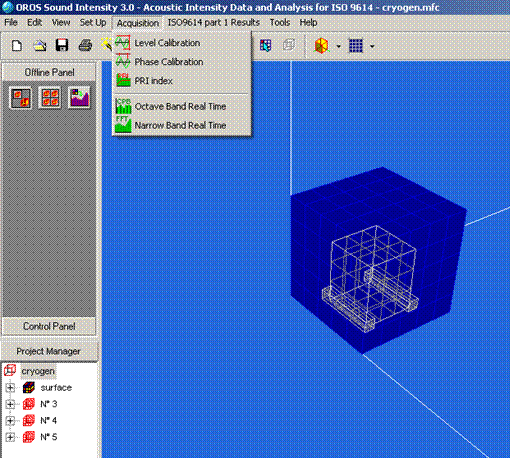
- The Acquisition menu, functional to various real time measurements:
- Level calibration
- Phase calibration
- PRI Index
- Octave Band Real Time
- Narrow Band Real Time
Acquisition menu and control panel
So, data acquisition can be performed for two kinds of operations:
- System calibration
- Real time acquisition and analysis
The display mode and the commands are shared between the two applications.
Calibration
The calibration procedure can be divided into three parts:
- Pressure;
- Phase;
- Pressure residual intensity (PRI) index.
Pressure Calibration
The first and most common procedure is the one for pressure calibration.
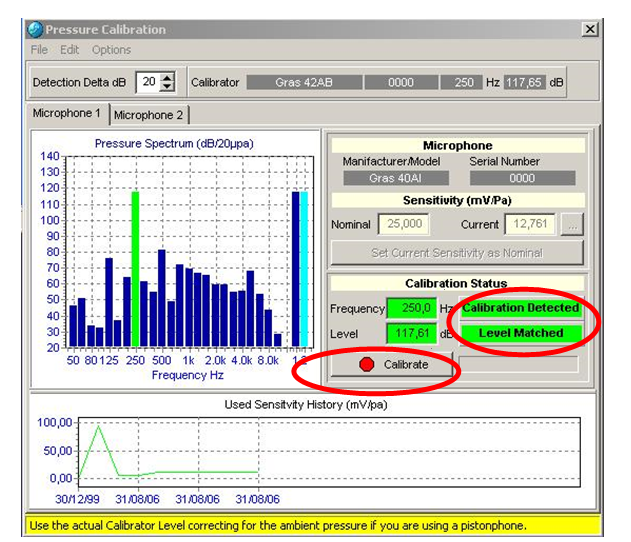
The first step is to configure the calibrator type and the measurement chain from the Equipment Set Up menu. The procedure has to be adopted both for the microphones and the calibrator clicking the relevant fields and selecting the items from the database table. The transducer sensitivity will be updated according to the information stored for the equipment set-up.
Then the user has to fit the calibrator on one of the two microphones and activate it. Pressing the Start button the program will activate the procedure. If the analyser has not been activated yet, the program will ask if the user wants to perform the operation at this time. Once the analyser has been initialised, the application will try to detect the signal and begins the automatic calibration procedure. If the Calibration detected and the Level Matched box lights up in red, pressing the Calibrate button the software performs the stability check and the new sensitivity is suggested in a message box.
Pressure calibration
The user could accept the measurement results and this way transfer to the internal database the new value that will be used for the following measurement. It is convenient to verify the last accepted value starting again the acquisition, verifying that the Level Matched box lights up in green. Fitting the calibrator on the other transducer it is possible to perform the calibration on the second channel.
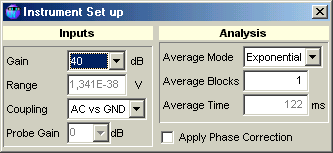
The lower part of the window shows the corrected sensitivity history for each transducer. It is always possible, during the measurement, to recall the Instrument Set up window clicking with the left mouse button on and change the instrument set-up varying the Range, the Average Mode (linear or exponential) and the Average Time.
Instrument set-up during calibration
Phase Correction
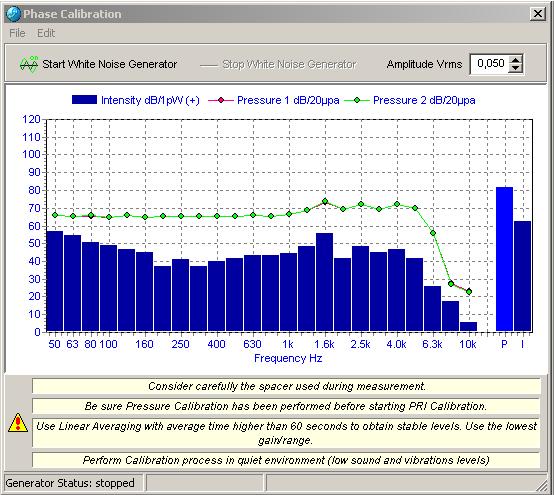
This calibration type has to be performed using a white noise generator and a coupler to set the microphones in such a way as to put them in the same conditions with regards of the sound pressure waves. First of all fit the microphones in the calibrator coupler and plug in the cable connecting the analyzer to the generator. Then press the Start button in the "Built in white noise generator" section. The analyzer generator will then begin to reproduce a white noise at the level specified by the Built in white noise generator Gain.
Phase calibration screen shot
Press the Start White Noise Generator button to proceed with the calibration procedure. Then use the control panel to start the measure. Be sure pressure calibration has been performed before starting the procedure. Use linear averaging to obtain stable level. The time needed to perform the whole calibration process is about three minutes.
When the acquisition stops, it is possible to show the corrected intensity values by selecting the "Apply correction" tick in the instrument Set-Up window.
PRI Index determination
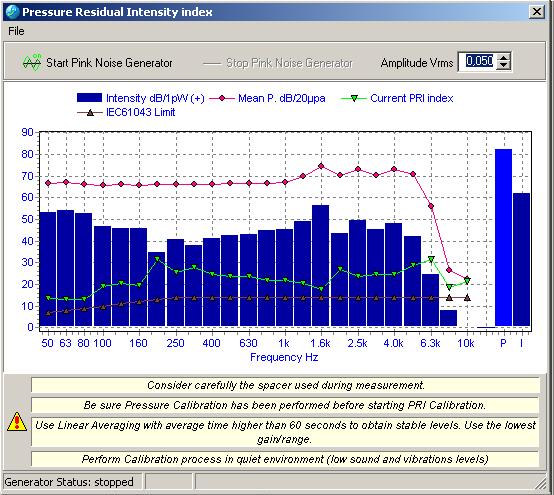
This procedure is very similar to the Phase correction process, but concerns with the setting up of the equipment and the data input for the pressure residual intensity index, related to the grade of accuracy the user wants to achieve.
In the case of real time procedure, fit the probe in the coupler of the calibrator, turn the pink noise generator on, set up the instrument in the Set up / Equipment menu (see next sections) and select the "Start" button in the Control Panel to start the acquisition. At this stage the software asks the user to select only one spacer with the full frequency span activated. This expedient has to be used only to perform this measurement the right way: a single spacer with a full frequency range in the actual environmental conditions is the conditions in which the calibration has to be done. After this step the user can go back to their desired configuration of the spacers and frequency ranges.
Pressure - residual intensity index calibration
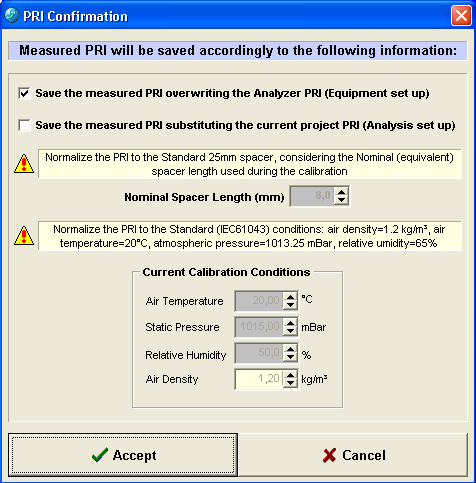
The user should select a linear average of, at least, 60 – 120 seconds in order to obtain a meaningful PRI index. Pressing the "Accept" button, the data will be transferred to the internal database. The program will take these values into account during the sound power level determination. When the user accepts the measurement, the software proposes the following window:
PRI confirmation area
The application gives information about the status of the environmental conditions, just to make the user is notified that the spectrum of the acquired data will be adjusted to normalize it to the standard condition and to the spectrum length required by the standard (25 mm). The spectrum will be saved, according to the check box selection, in the Analyzer Set-Up area and/or in the Analysis Set-Up Area. Please read chapters 5.1 and 5.2 to delve into application PRI management.
Sound Pressure & Sound Intensity Acquisition
Data acquisition is achieved with the Main Mode on (Cf. Section 2)
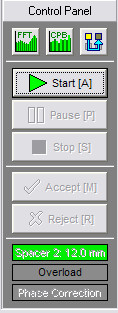
Acquisition control panel
Actions to operate the acquisition are achieved through the control panel interface.
Auto progress:
When it is pressed, the selection of the cells during the acquisition is done as defined in the sequencing path of the measured surfaces.
Octave band real time acquisition
Real Time Octave
The user can start the real time acquisition procedure by pressing the relevant button in the main interface window. This action will open the window shown.
Press the segment selection tool and choose a position on the measurement grid to import the data into it.
Press the Start button to begin the acquisition.
Press the Save button to store the data in the project structure.
Octave band real time acquisition
Measurement Steps
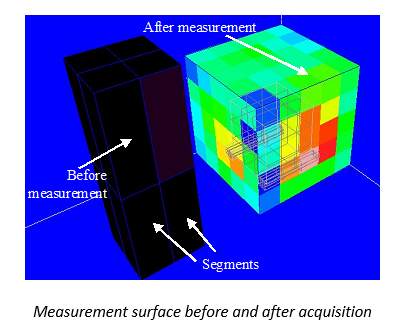
Before acquiring any data, the measurement surface is represented with a default colour. As soon as data is stored on a segment, a color is associated with it, showing immediately what segments have been measured and what segments have not.
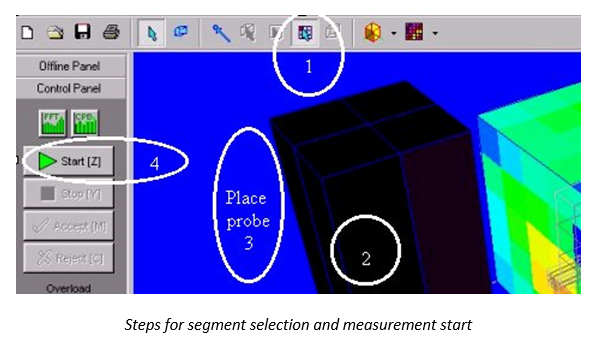
Measurement procedure
1. Click on « Segment selection » for selecting a segment
2. Select a segment where the measurement will be carried out (the segment should become white).
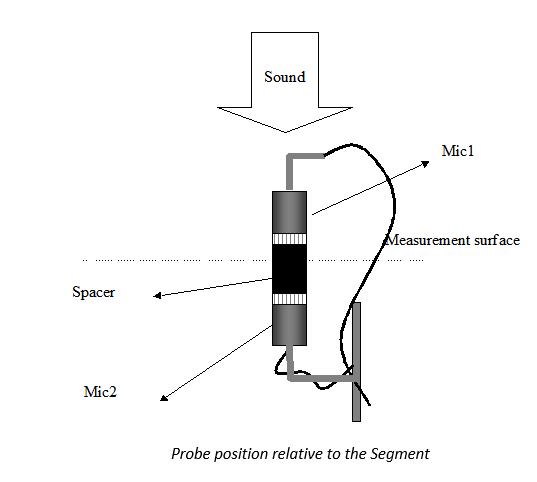
3. Place the probe with the p-p axis perpendicular to the measurement surface as shown by the following figure.
4. Press Start (the selected segment should blink during the measurement). Please note that the analysis set-up should be done using a « linear average » so that the measurement stops automatically after a defined averaging time.
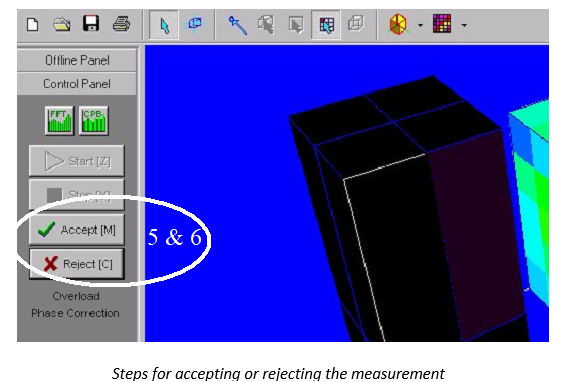
5. Press Accept to save the segment measurement
6. Press Reject if the measurement was not satisfying
7. If the measurement is satisfying go to next segment
8. If the measurement is not satisfying start the measurement again on the same segment
Shortcut keys as displayed on the above picture may be used in order to operate the software from the keyboard.
Auto progress & Set-Up Shortcut
By right clicking on the real time graph:
* You can activate the « Auto progress » function: If selected, pressing « accept » after a measurement will make the segment selection progress a step forward.
* You can also activate the «Instrument Set-Up» shortcut to change measurement parameters.
Auto progress and Instrument Set-Up shortcut
Remote control operation
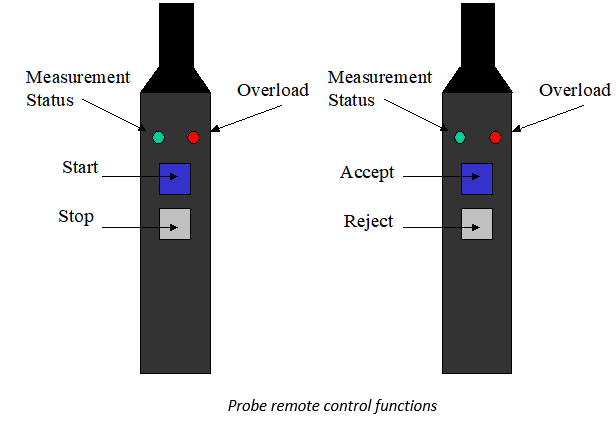
As often in Sound Intensity measurements, the system should be operated remotely from the PC. For this purpose, the GRAS and the Microtech Geffel remote control are configured to allow this. Two buttons operate in the same way as the Start/Stop and Accept/Reject as described above in the previous section and as represented by the following picture. In addition, 2 LEDS assists the operator. The first LED of the probe shows the measurement status: measurement running, waiting for accept/reject or stopped. The second LED shows if any overload has occurred: this information may help the operator in his decision to accept or reject the measurement.
Narrow band Analysis
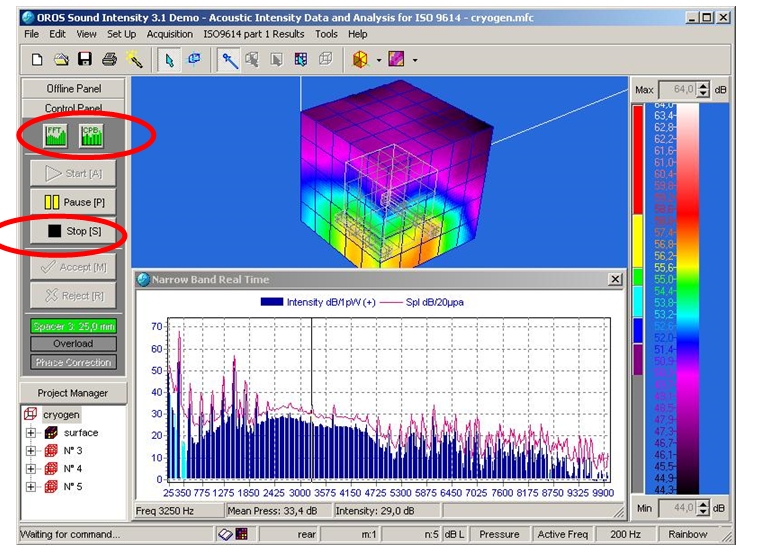
In several cases it is very important to perform narrow band analysis to better understand noise causes. In this occurrence, an FFT analysis can be performed directly using the real time performances of the OR 25 PC Pack.
First, the user must click on the Real Time FFT Analysis button, placed in the upper part of the Control Panel. Then a new window opens, and the analysis starts as soon as the user clicks on the Start button.
To stop the acquisition, click on the Stop button.
It's noteworthy that data acquired with this procedure can't be stored in the project and then are not taken into account during sound power determination according to the ISO Standard.
Narrow band real time acquisition
Overview grid
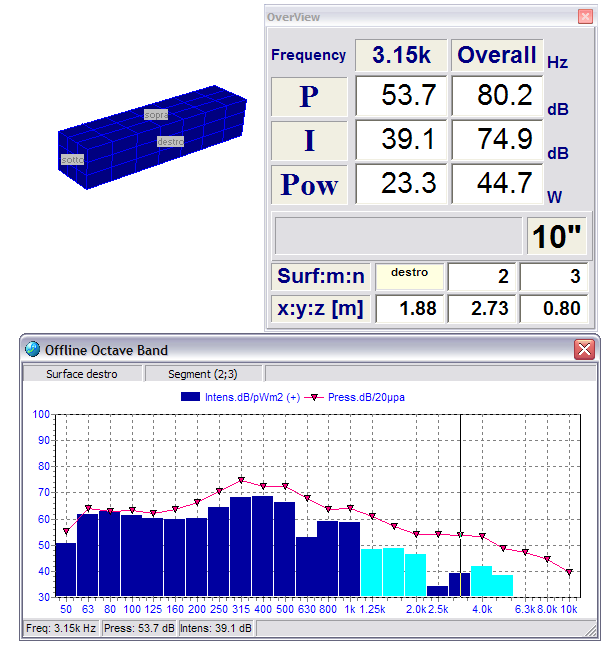
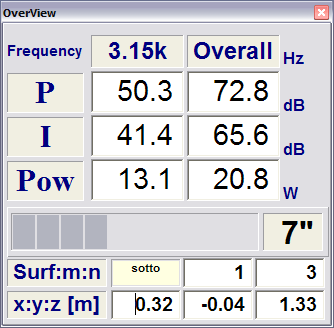
The overview grid has been designed to enhance a number of points. In particular, the main one is to make the important information very visible from a distance. The overview grid benefits to the acquisition as well as the analysis.
It let the user:
- Improve greatly the visibility of the measured values such as the sound pressure, the intensity level or the power level through the surface of the selected cell. It is given either for a defined frequency or for the overall level.
Overview grid
- Shows clearly the geographic position of the measured point in "Meters". It is particularly useful for positioning the altitude of the measurement points.
- Clearly displays the coordinate position of the measured cell in the surface.
- Large progress bar in order to make the evolution and status of the linear averaging very visible.
Overview grid during acquisition
The overview grid is activated by clicking on the following icon as shown by the red arrow on the next figure
Showing the overview grid
Results & Noise Distribution Analysis
The Analysis set-up is achieved with the Main Mode on.
There are four ways to display the results:
- Color display;
- Multi frequency view;
- Parallel Space;
- Off line Octave Spectrum.
Color Display of pressure and intensity fields
The display tools described in this section are available when the corresponding option was purchased.
Using the mouse left button and specific keyboard keys (Ctrl and Alt) the 3D displays can be handled as:
- Translating the display origin: Drag with left mouse click. The Origin translation icon must be toggled on (Cf. section 2).
- Rotate the display: Ctrl key + Drag with left mouse click
- Zoom the display: Alt key + Drag with left mouse click
Visualization set up
Display modes
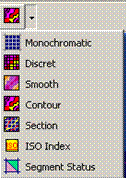
There are seven display modes available to represent pressure and intensity fields:
Display modes.
1. Monochromatic: useful to depict the measurement surface with the active measurement segment on (blinking);
2. Discrete: can be used during acquisition to differentiate measured segments from not yet considered segments;
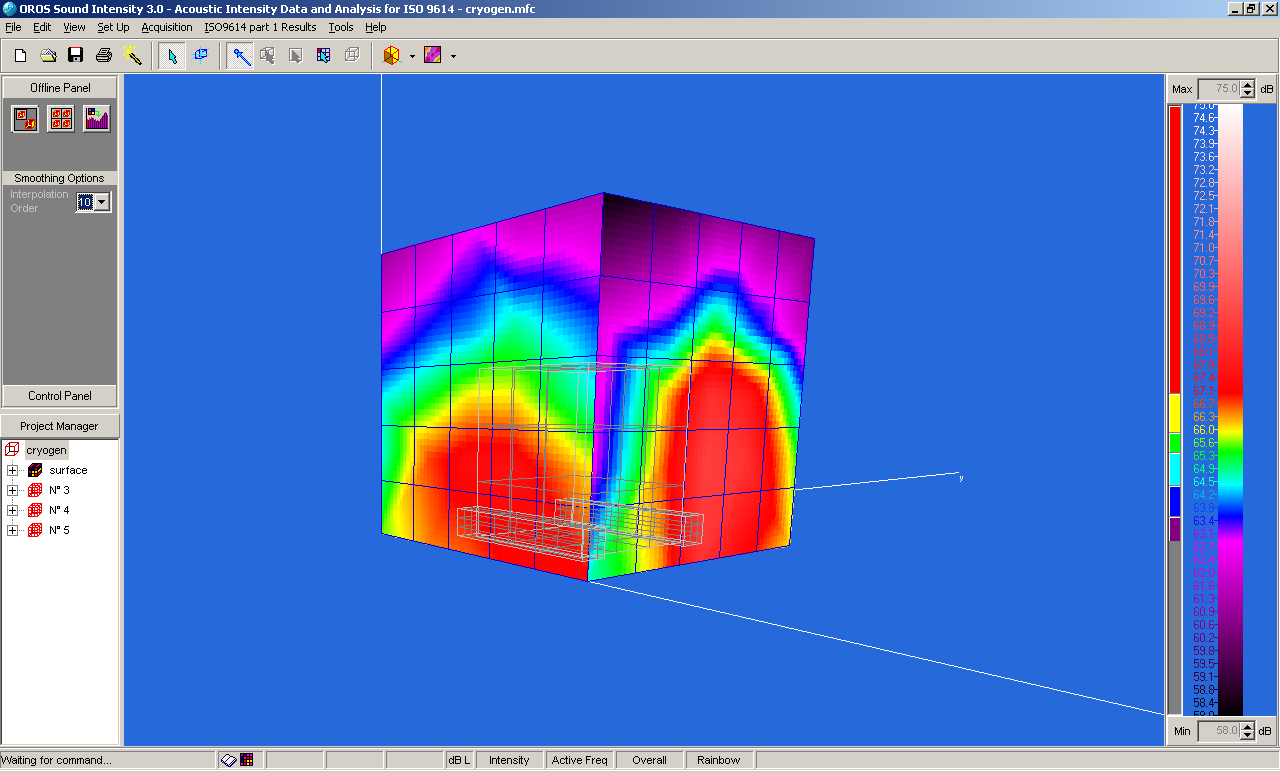
3. Smooth: the easiest way to portray a continuous distribution of pressure and intensity fields over the geometry of the device under test. A linear interpolation order for the smoothing of the contours can be selected in the range 1-10;
Smooth contour plot of the intensity field.
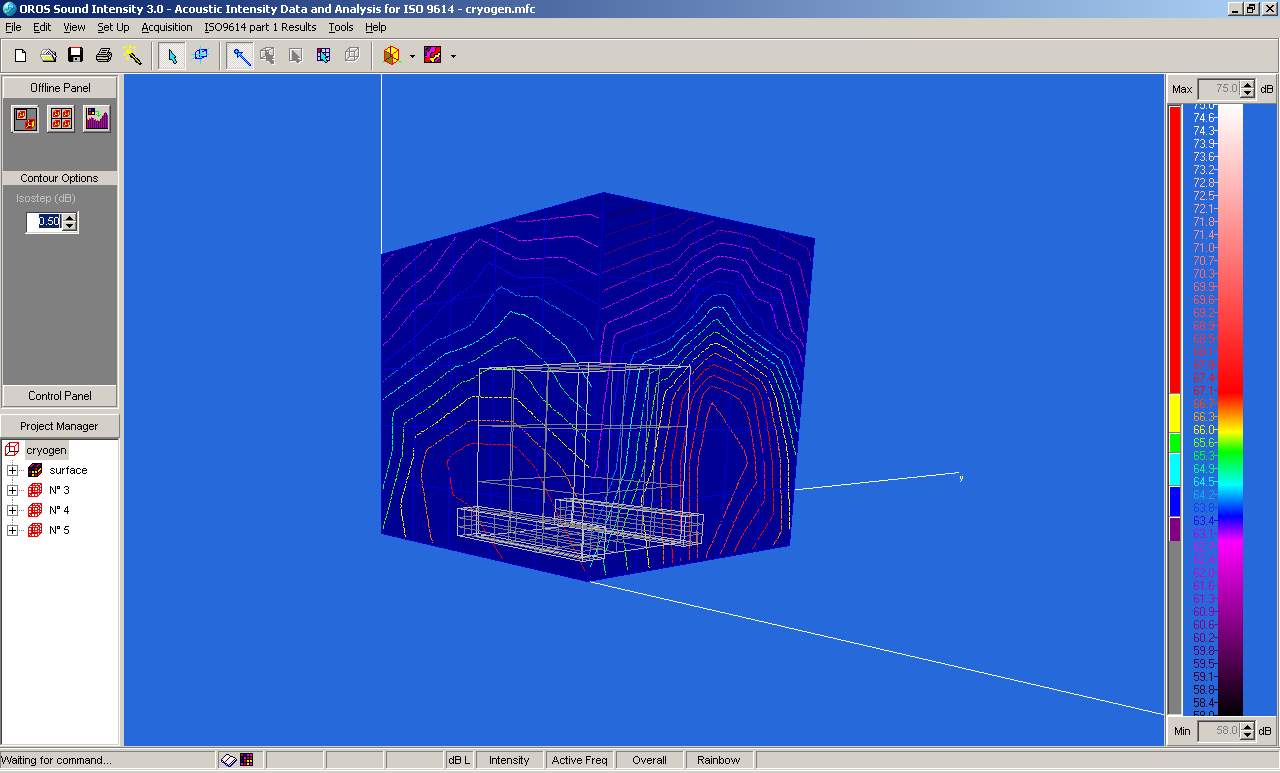
4. Contour: with this option the user can plot equal-pressure and equal-intensity lines over the measurement surface. It's also possible to select the step difference for two consecutive curves to increase the number of lines within the representation.
Contour representation of the intensity field.
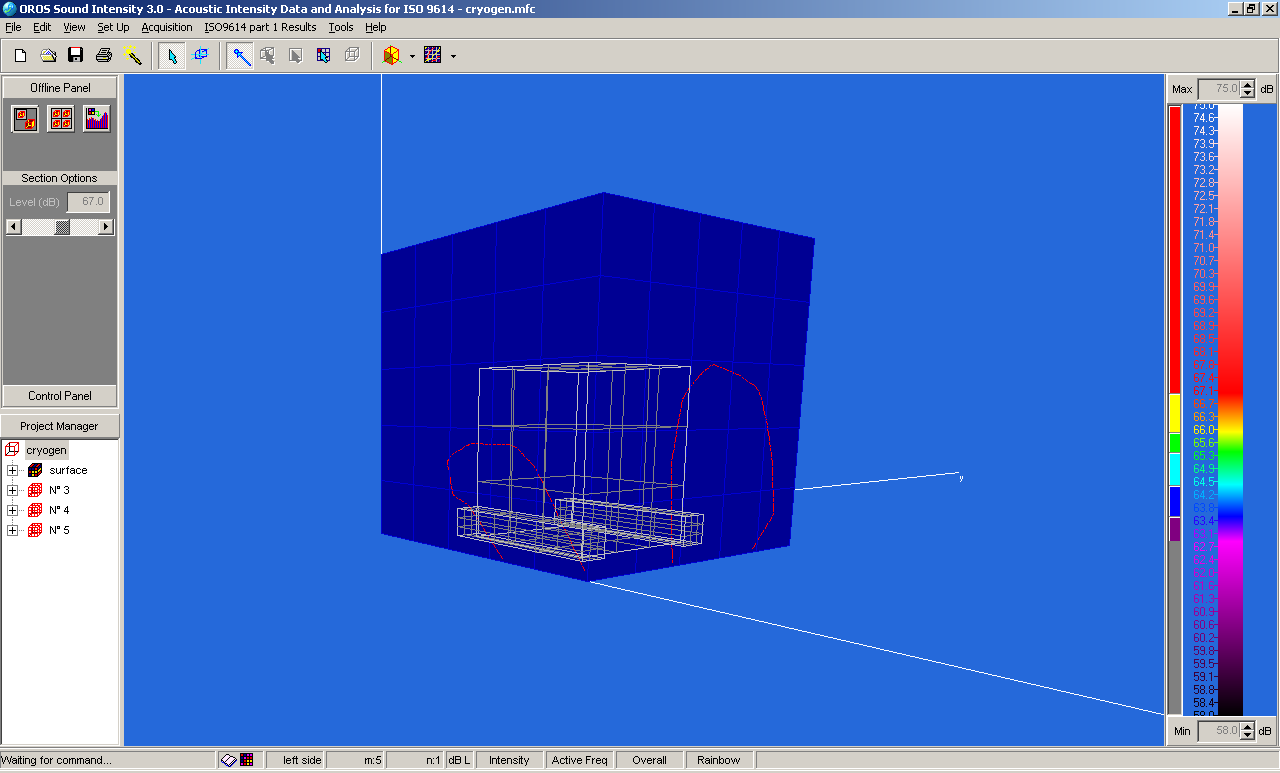
5. Section: useful to display a single line pertinent to a specific pressure or intensity level. For example, in the following figure is represented the contour plot for an intensity level of 67 dB re 1pW/m2.
Section representation of the intensity field.
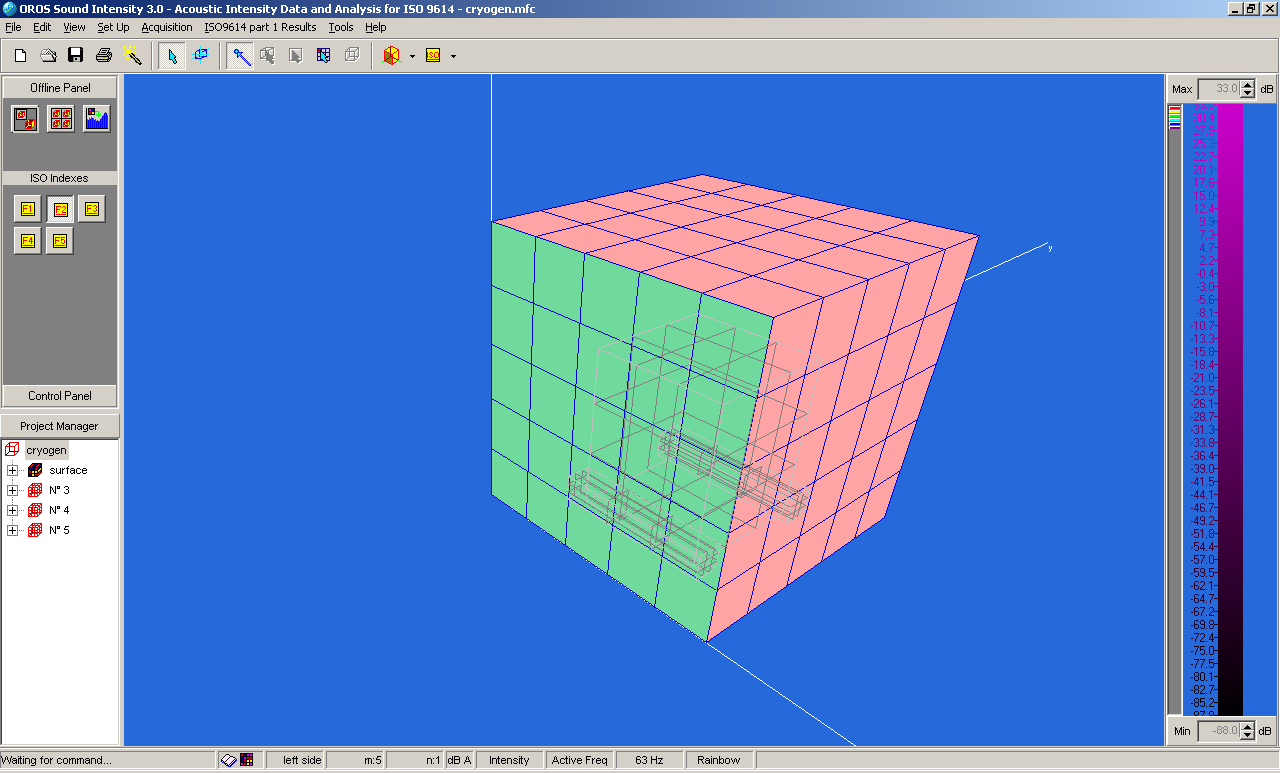
6. ISO Index: this mode is useful to represent the measurement surfaces complying or not complying the Standard requirements according to the selected accuracy of the determination. Complying faces are light up with green, not complying are light up with red.
ISO Index view.
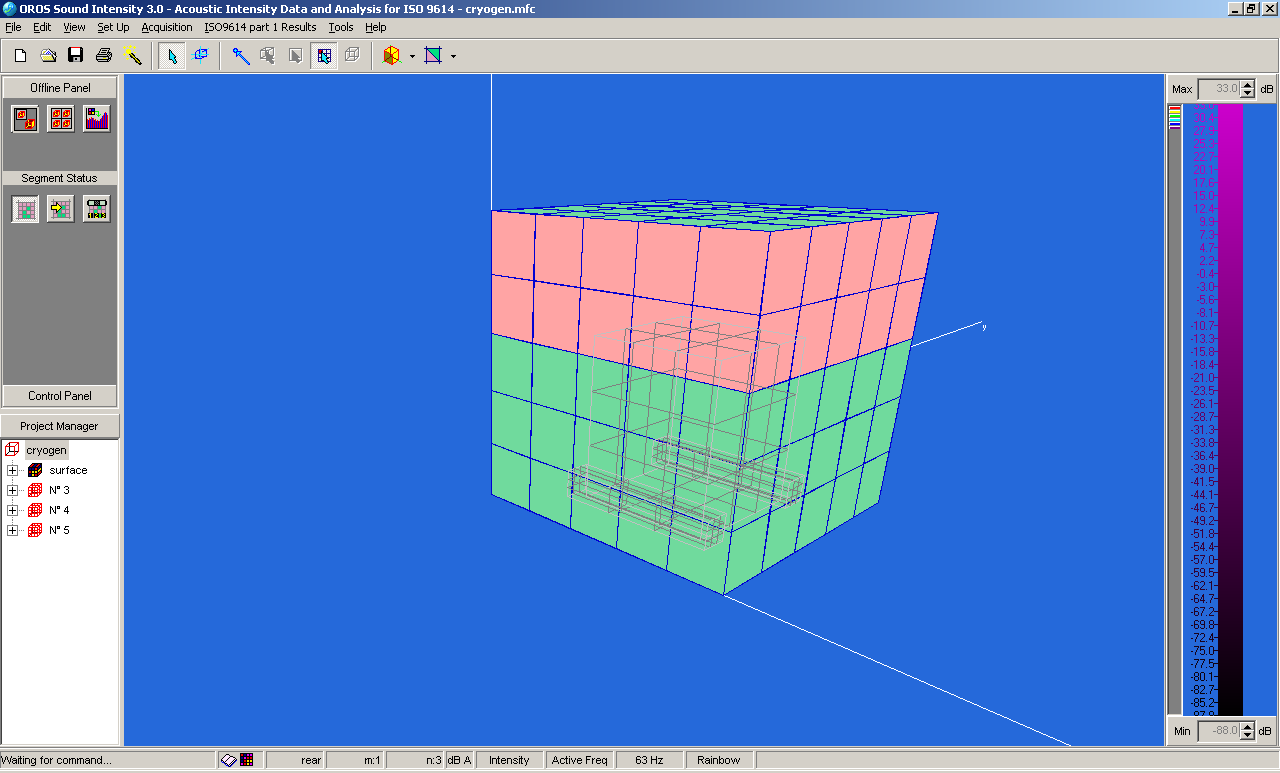
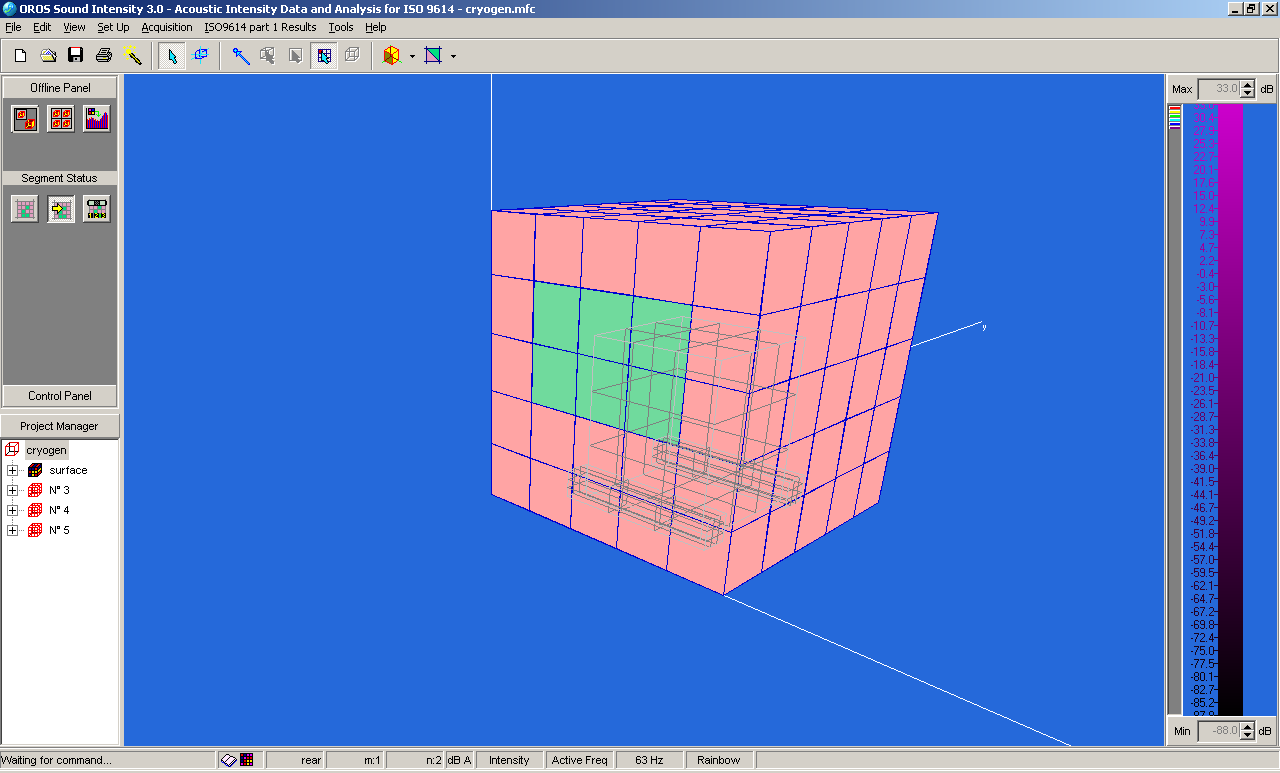
7. Segment Status: the segment status view type has three functions:
- Segment status visualization and activation/deactivation: The segments can be activated for the use in sound power determination (green) or deactivated (red) in the case the user doesn't want to use them during the sound power determination. The software will compute the Sound Power according to the selected choices.
Segment Status
- Segments in which data were imported: the user can see at a glance the segments where data were imported (green cells).
Segments in which data were imported
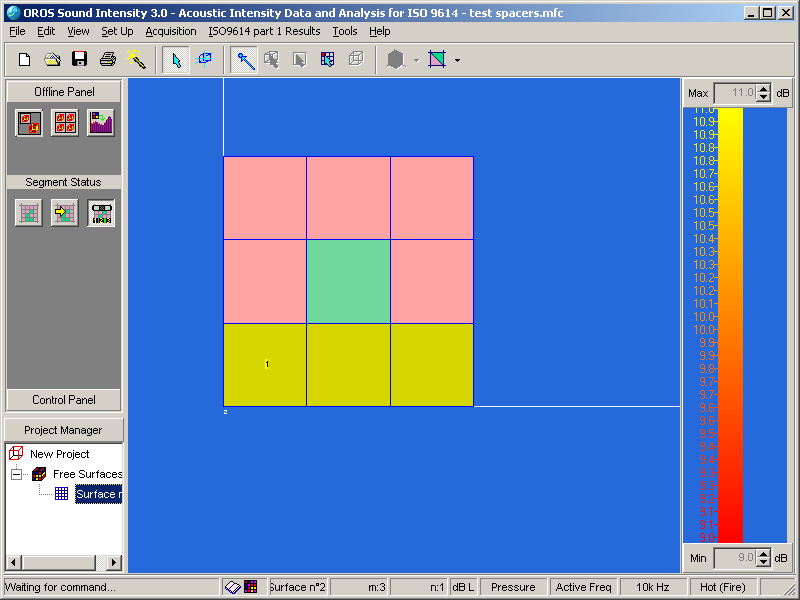
- Spacer used for the measured face: this mode allows the user to display the spacers used for a measurement surface. Red segments have not been measured yet with any spacer, green segments have been measured with all the spacers defined for the project, and yellow segments have been measured with some of the available spacers. Scrolling the frequencies, the user can see the spacers used in the various frequency ranges with a specific spacer.
Spacers used for the measurement surface
Display settings
There are several display configurations the user can activate by clicking on the display area with the right mouse button. Basically there are three types of set up:
- dB scale: if the user clicks on the dB (A) – linear selector, the graphs will display the chosen weighting.
- Frequency selection: use this command to choose among the frequency bands the one you want to display. It is also possible to show the overall (frequency sum) values for each segment.
- Pressure – intensity layer: the user can display the relevant data related to the chosen frequency on the contour maps by selecting the pressure or the intensity layer.
Color Scales
By clicking right on the color scale the user activates the pop-up menu he can employ to select the different available types of color scale:
- Hot (fire)
- Cold (water)
- Absolute
- Rainbow (editable)
- Black and white
- Mono red
- Mono green
- Mono blue
The Rainbow scale is editable. To edit this scale click with the left mouse button on the color you want to extend. By dragging the cursor you will be able to increase or decrease the range of this color on the scale.
When you have finished editing your new scale the display will be automatically updated with the new color scale settings.
Multi Frequency
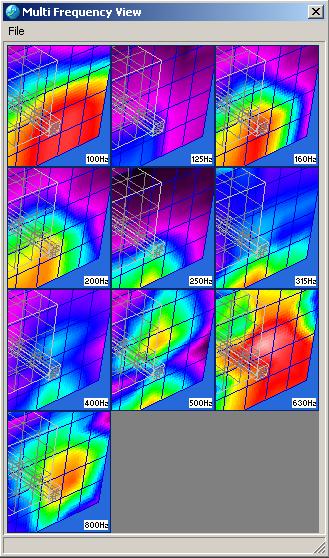
The Multi frequency spectrum view has been developed to show simultaneously several frequency plots in one shot.
Multi frequency view
To activate this command click on the relevant button and select the frequencies you want to show. Then click on the Next button and select the area you want to see in the multi spectrum view window. Click at first the top right point of the selection window and then the bottom right one. The program will open a new window showing the surfaces for the selected frequencies.
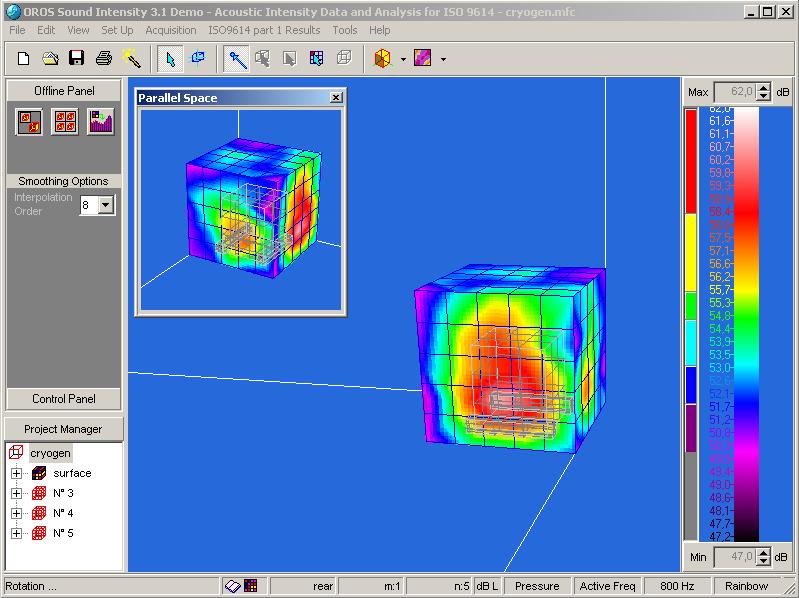
Parallel Space
Using the Parallel space outlook it is possible to show the same surface from different points of view. Select the command by pressing the relevant button. This action will open the new parallel space window.
Parallel space sight
Rotate and zoom the object in the parallel space window until you reach the desired point of view.
When the represented object is in the required position press the right mouse button to show the pop up menu and fix a parallel space.
From now on the usual representation and parallel space will be linked during pan, zoom and rotation operations.
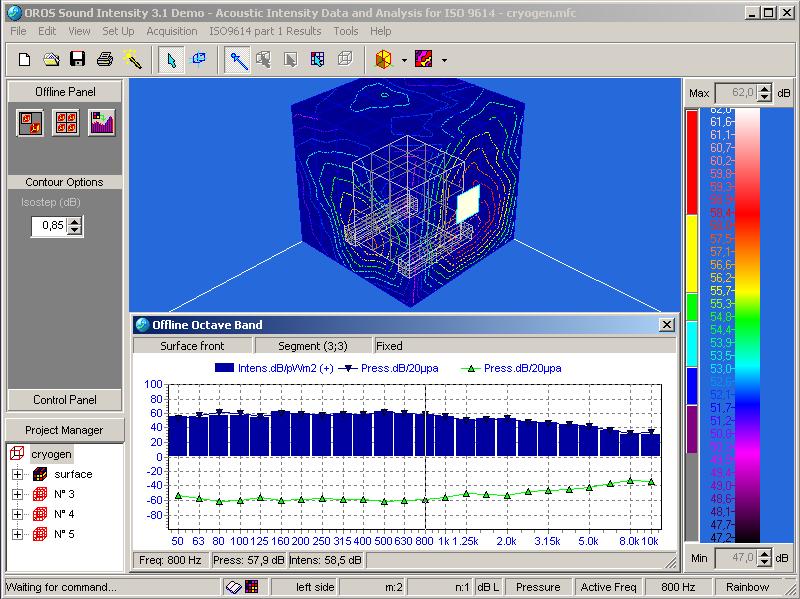
Off-line octave spectrum
The Cell selection cursor has been developed to activate functions for a single cell:
- Displays data for:
- Pressure
- Intensity
- P-I Index
This second command must be used with the dynamic cell spectrum button in the left part of the main window.
In any case the user has to point the cursor to the cell he wants to highlight and the spectrum will be updated according to the data stored for that particular segment.
To fix a particular segment just click on it. The segment lightens and the user will be able to move the cursor around the screen without changing the spectrum shown in the window.
To switch from a kind of representation to another (for example from pressure to intensity graphs) click on the window title with the right mouse button.
Off-line spectrum mode
Clicking with the right mouse button, it's possible to have options for the Offline spectrum. For example, the options are:
- Bipolar intensity;
- Y-axis: Autorange, fixed unzoom;
- Label: intensity, pressure;
- Export image file (as bmp or metafile);
- Export data (as txt file).
Sound Power using ISO 9614 Part 1
Sound Power is calculated with the Main Mode on (Cf. Section 2)
To access the Result analysis, click on the ISO part 1 Results and select the correct item among (see Fig. 56):
- Time variability Index F1
- ISO Flowchart
- Sound Power computation
ISO part 1 Results
F1 Index
Before starting the sound power determination, according to the ISO 9614-1 Standard, you will have to determine the temporal variability of the sound emitted by the sound source. In this case you should prepare at first a set of measures and import them into the program.
The first step is to select a surface in the tree structures placed on the left part of the window.
The best choice is to use the real time acquisition. In this case, select a column to import data into it. Then pick the Octave band real time command from the acquisition menu.
Real time F1 Acquisition
Pressing the Start button the acquisition goes on until the analyzer reaches the total average time. Then you can store the measurements by pressing the Save button. Repeat the procedure until the total number of samples is reached.
To set up the acquisition parameters click with the right mouse button on the real time acquisition window and select from the pop-up menu the Instrument set-up item.
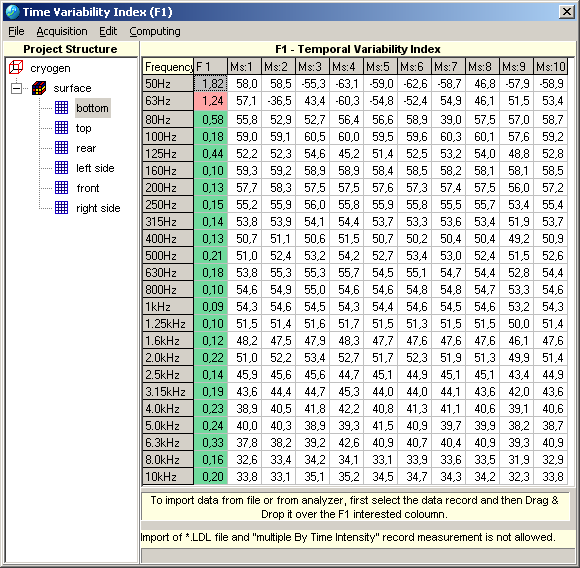
F1 index table for bottom surface
When you have finished the acquisition you can come back again in the ISO Part 1 Results menu and select from the Computing menu "Verify all F1 indexes". The program will compute this index for all the surfaces and will show the index value at each frequency for all the surfaces. If the Standard requirements are not met for some frequencies, then the program will show the correspondent F1 value in a red cell. Otherwise the cell will be marked in green.
ISO 9614-1 Flowchart
The field indicators described in the ISO 9614-1 Standard, compulsory for the accuracy determination process, can be accessed by the Analysis menu once the user has imported all the data related to the model. To make the program perform the calculations required, the user has to access the menu "Computing" and run the command "Verify ISO Indexes".
- It shows the criteria for both each surface and also for the whole measurement surface
- One can also modify the choice of the accuracy grade after the measurement and see its effect on the criteria requirements of the ISO 9614 standards.
- One can also see directly the (N-CF42) result and see how close it comes to 0.
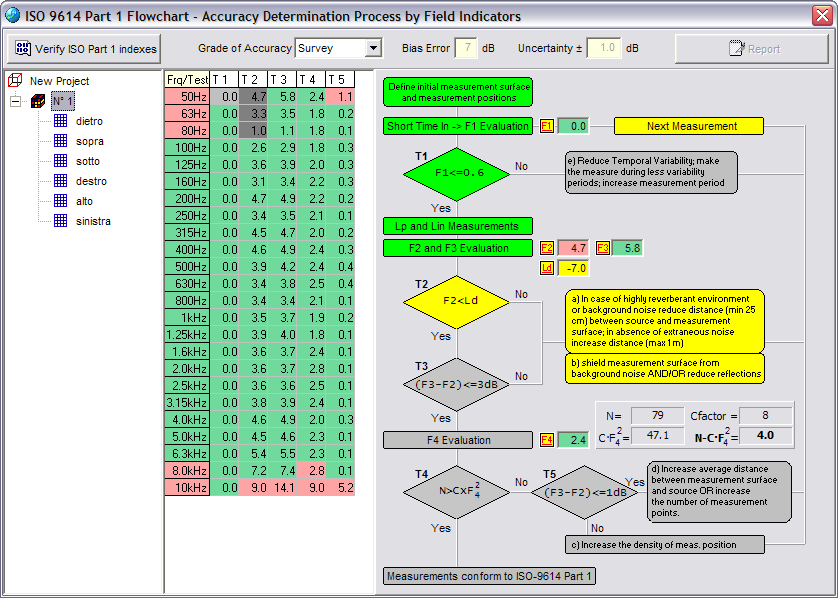
By selecting a surface contained in the tree structure on the upper left part of the window, the user can show the related flowchart and the values for the four indexes F1, F2, F3 and F4. In case of non-conformity with the accuracy determination process described in the ISO standard, the frequency and the index which are not up to the Standard requirements, lights up in red and the flowchart shows the action the user has to undertake to reach the grade of accuracy he wants (see Fig. 59).
Flowchart for the accuracy determination process
Please, remember that the field indicators automatically take into account the different spacers used during the determination for the different frequency ranges.
In the particular case in which the Ld value at the considered frequency is less than zero (this situation may arise if the PRI combined with the accuracy grade, the selected spacer and the environment conditions ), the software highlights the F2 cells with the yellow color (and if the user select the segment, the software highlights the field "Ld." under the "F2" field in yellow also): this fact warns the user to check the consistency and correctness of the Capability Index (in relation to the PRI).
Capability index check
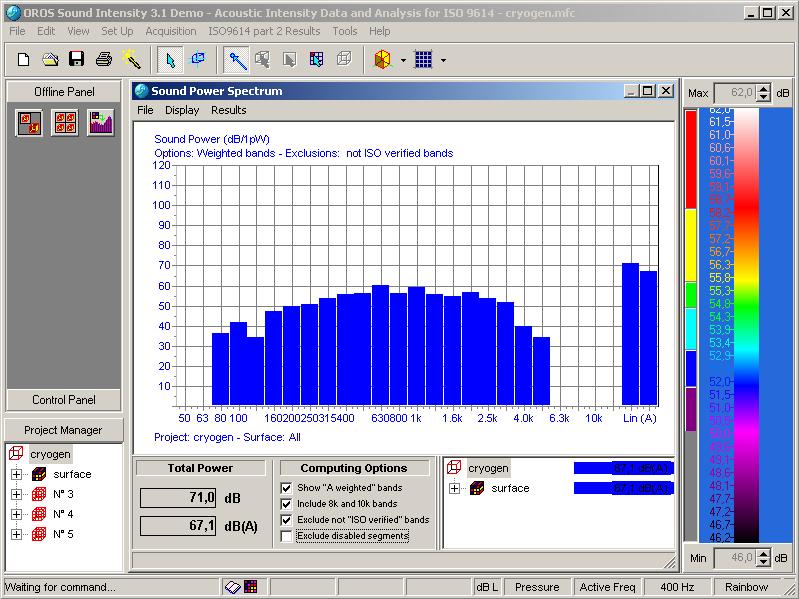
Sound Power
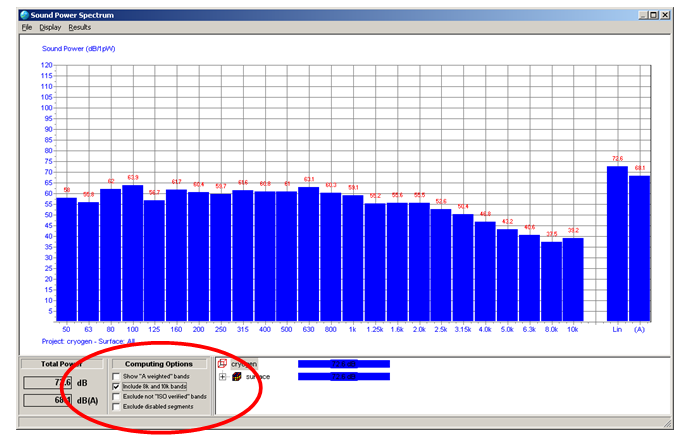
The Analysis menu contains also the command to enter the sound power result section. This part of the program gives the user a complete insight of the sound power radiated from the source and a ranking of the measurement surfaces. The tree structure can be browsed to show the emission spectrum of the overall measurement surface or the sound power spectra of the other surfaces enveloping the sound source.
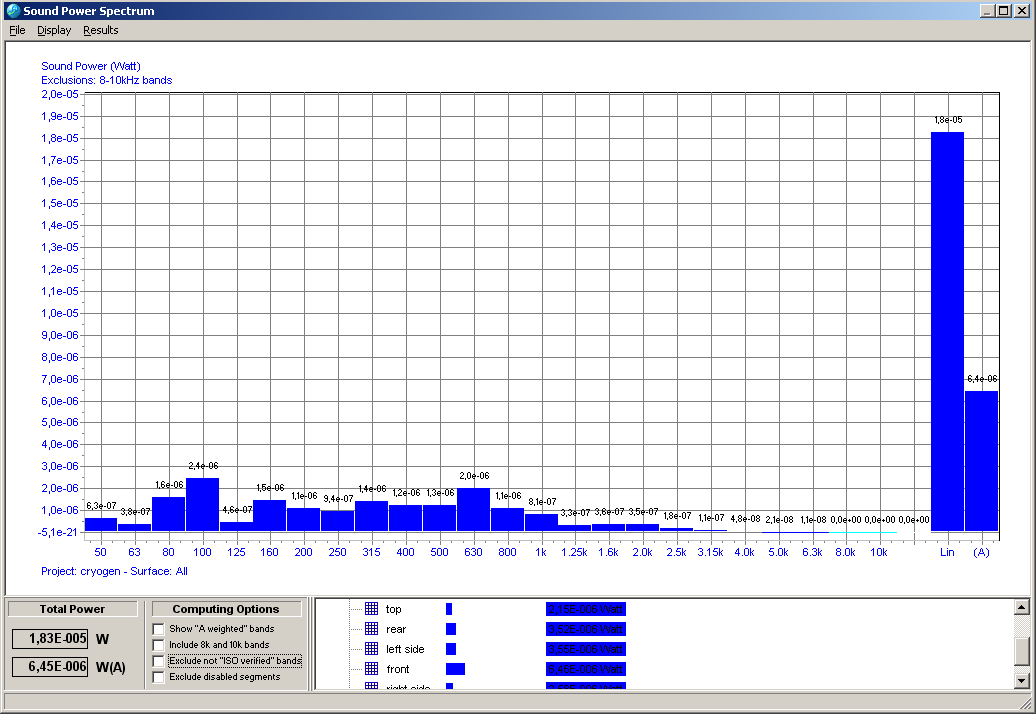
The bars and the relevant values shown in the right lower part give a more practical insight of the power levels associated to the surfaces and express also the numerical value for each of them. A tick in the lower part of the window enables the user to choose if he wants to keep into account also the frequency bands not in accordance with the standard requirements or to discard them from the computation and the visualization. In the lower left part of the window the user can choose if he prefers to
- Show the overall power values expressed in terms of Linear or "A" weighted sound power levels [dB (L) or dB (A)].
- Include or not the 8k Hz and 10 kHz bands in the power computation (the standard limits the power computation at 6.3 kHz)
- Exclude or not, in the power computation, the bands not verified by the indicators
- Exclude or not, in the power computation, the segments previously disabled manually (graphical selection).
Sound power level determined for a measurement surface [dB]
There are three menus in the main bar allowing the user to perform several actions:
- The File / Print report menu creates a standard report containing the relevant data of the project and the power results for the overall surface enveloping the sound source.
- The File / Export File and Copy to clipboard options enable the user to make a copy of the graph and to export it in a report.
In the Display menu the user can set-up the histogram in such a way to show the spectrum as power levels expressed in Watt or in dB. To switch from one kind of representation to the other select the right option from the Display / Units menu. With the Display / Label command the user can visualise the labels showing the numerical values for each bar of the spectrum.
You can zoom the diagram by clicking with the left mouse button on the desired position and dragging a window from the upper left side to the lower right side of the portion you want to enlarge. To unzoom just drag a window from the lower right to the upper left side.
Labels and linear power spectrum [Watts(A)]
Sound Power using ISO 9614 Part II
The tools described in this section are available when the corresponding option was purchased.
Settings
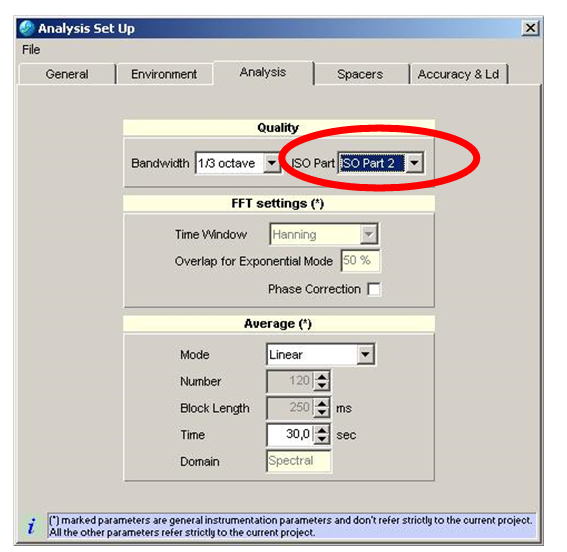
Before starting a new project using the ISO part 2 option, the user has to organize the application trough the SET UP menu. As shown in the following window, (bottom part of Analysis Tab) the user has to set the ISO Part field to "ISO Part 2". According to ISO 9614-2 standard, only Engineering and survey methods are available.
The program functionalities are the same as illustrated in the previous chapters, but the flowchart, the measurement mode and measurement implementation follow the specifications of the ISO 9614-2 standard.
Analysis set up for ISO Part 2 determination
In particular, the ISO part 2 Result menu is available. Using this menu, the user can access the Flowchart and the Sound Power determination sub-menus.
Menu for ISO part 2 Results
ISO 9614-2 Flowchart
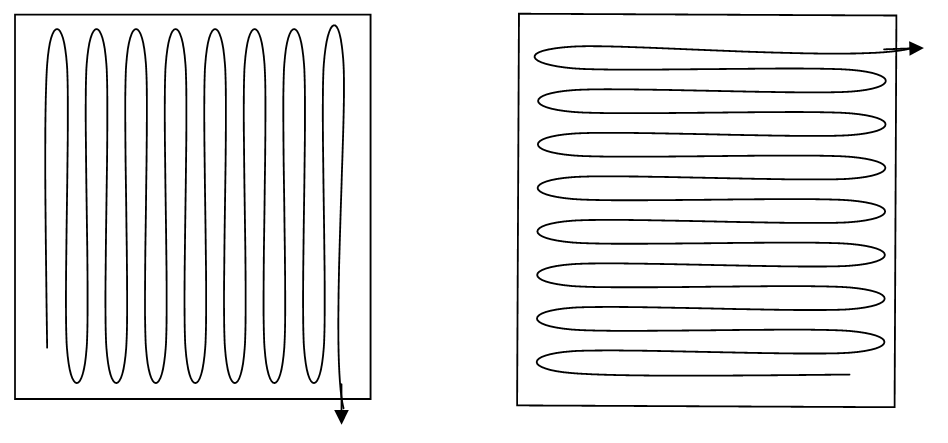
According to the above Standard, the user has to perform two sound power level measurements for each surface, scanning each area or segment by means of two orthogonal paths.
For this purpose the user has to apply the real time acquisition procedure.
Orthogonal scanning paths
Once performed the first sound power level measurement (first scanning direction), the user has to:
- Verify the Flowchart.
- Set up the Reference Sound Power data, using the relevant command in the Computing menu.
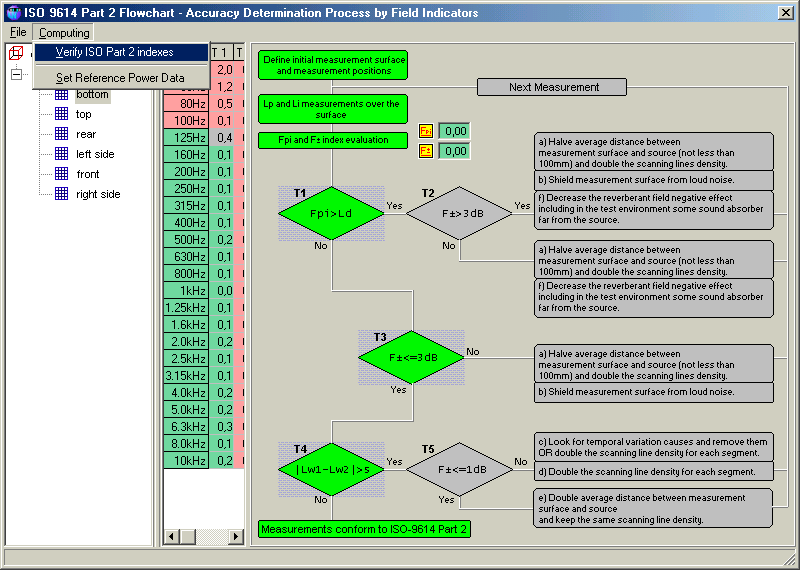
For each sub – surface and for each frequency band, the flowchart shows the indexes values and, in case of failure, the actions the user has to undertake in order to fulfill the standard requirements.
In this way the data acquired during the first scan are transferred in a buffer, ready to be used for the second part of the determination process.
At this time the user has to perform the second power level measurement and then test again the determination process using the Verify ISO Part 2 indexes command.
If the ISO indexes meet the standard requirements and the flowchart is light up in green, the user can close the Flowchart window and access the Sound Power calculation menu to compute the Sound Power Level Values. Otherwise it should be necessary to repeat the procedure by carrying out a second scan.
For this purpose, under the File menu it is possible also to save and load reference files for further analysis.
Flowchart for ISO Part 2 determination process
Sound Power level calculation
Once verifying the flowchart, the user can access the sound power determination area of the application trough the ISO Part 2 / Sound Power menu.
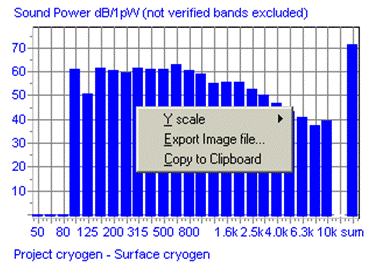
1/3 octave sound power level calculation
In the left part of the window the user can easily see the sound power level value obtained for each measurement surface and for the overall surface. In the right part a graph is shown of the 1/3 octave sound power spectrum referred to the surface selected in the left part.
The user can choose to show Linear or "A weighted" data and to exclude or include not ISO verified bands selecting the relevant option in the lower part of the window. The graph will update accordingly.
Clicking on the graph area with the right mouse button, several options become available:
- Y scale (Auto zoom, Fixed, De-zoom),
- Export Image File… (to export the window image in bitmap or metafile format),
- Copy to Clipboard (to copy to clipboard the window image).
Note that it is always possible to zoom the graph by clicking with the left mouse button and dragging the cursor from the left to the right side.
To pan the view click the right mouse button and drag the cursor. To de-zoom use the relevant command or drag the cursor from the right side to the left side holding the left mouse button down.
Visualization options for the sound power spectrum
Concerning the menus, several alternatives are available:
File:
- Print Report: to print a standard report concerning the sound power determination data;
- Export image file: to export the window image in bitmap or metafile format;
- Copy to clipboard: to copy into clipboard an image of the graph;
- Exit: close the window.
Display:
- Units: to switch between
| dB scale | ||
| Watt scale |
Label (toggle on – off power values on the graph)
Tree Bar length
- 1
- 1.5
Results:
- Compute Sound Power: Useful to compute again the overall sound power level and verify the determination process.
Reference Manual: Menus Organization
The menu bar is placed in the upper part of the screen which contains the following menus:
Menus Organization
- File
- Edit
- View
- Set Up
- Acquisition
- ISO Part 1 Results
- Tools
- Help
The meaning of these menus is explained in the following sections.
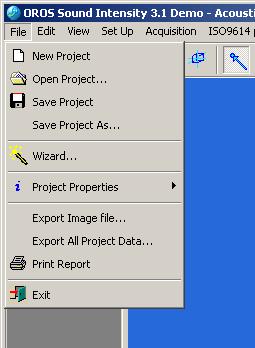
File Menu
This menu contains the following commands:
- New project: open a new project,
- Open project: open an existing project,
- Save Project: save the current project,
- Save Project as…: save the project in the position and with the name specified by the browser,
- Export Image File: you can export an image in BMP or JPG format,
- Print Report,
- A list of the latest opened projects,
- Exit: quit the program.
File Menu Organization
Edit Menu
It enables the user to show and set up several parameters:
- Properties
Edit – Properties Menu
- Frames: by using the table shown below the user can set up the frames properties.
Frame graphic properties
In this case it is possible to decide to hide or show a frame, his edge and grid. The user can also show the frame name on the display or decide to change the frame color.
- Surfaces: as stated above, but it is also possible to show the numeric value together with the pressure level measured for the segment (Label), to change the face or the grid color and show the sequence the program will use to import acoustic data on the selected surface (Mfill).
Surface graphic properties
- Selection: this command can be used when it is necessary to choose on what the user wants to perform a command.
Edit – Selection Menu
- Surface only
- Frames only
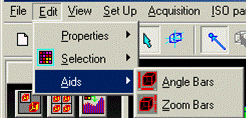
- Aids: this is an advanced set up for the user who wants to edit the display in a different way from the standard one.
Edit – Aids Menu
- Angle bars: useful to rotate the objects along the Z axis and the build plane;
- Zoom bars: can be used to change the observer's point of view.
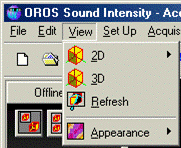
View Menu
This menu enables the user to choose between several different kinds of view:
View Menu
- 2D: Left, right, up, down, front, back surfaces,
- 3D isometric: it puts the objects in a standard three dimensional point of view,
- Refresh: the objects on the screen are refreshed with the new setting,
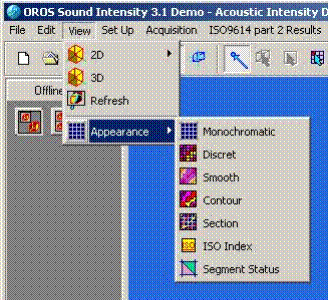
- Appearance: the user can show the surfaces using four different kinds of representation.
View – Appearance Menu
- Monochromatic;
- Measure: each segment has an associated color depending on the measured pressure level;
- Smooth: linear interpolation of the color scale between two adjacent segments;
- ISO 9614 Index: green: OK, red: index failure.
Set UP Menu
This menu enables the user to choose between two different set up:
Set-Up Menu
- Equipment
- Analysis
The meaning of these menus has just been explained in the previous sections.
The user has to set up:
- The general data about the title, the project engineer and the date of issuing of the file (as info);
- The required grade of accuracy, the bandwidth and the frequency range of interest (compulsory);
- The environmental data during the measurements (as info).
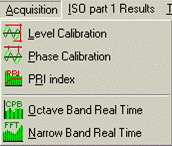
Acquisition
In the acquisition menu, the user can find the commands to:
- Perform a level calibration
- Perform a phase calibration
- Perform a PRI Index Acquisition for the instrumentation
- Start the real time Octave Band Acquisition
- Start the real time Narrow band Acquisition
Acquisition Menu
ISO Part 1 Results
The meaning of the command explained in this subsection has been explained in earlier chapters. Please refer to the relevant sections.
ISO Part 1 Results Menu
- F1 Time Variability
- ISO Flowchart
- Sound Power
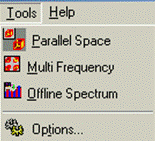
Tools Menu
In this menu, you'll find out the commands to:
Tools Menu
- Parallel Space
- Multi-frequency
- Off-line spectrum
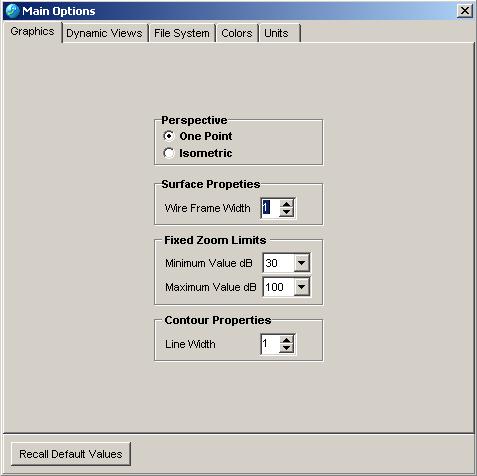
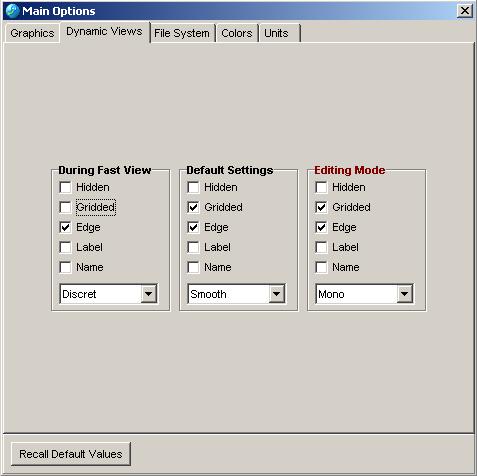
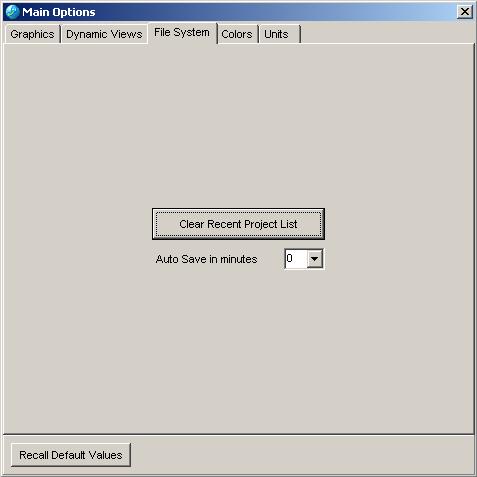
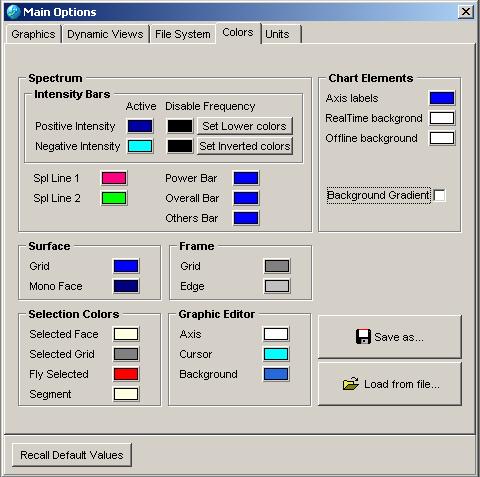
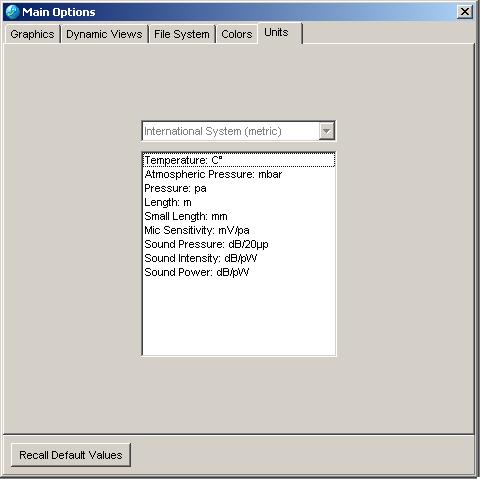
- Options: The options are represented in the following tables
In the Graphics tab is possible to set-up the perspective type, the wire frame width and the limits for the fixed zoom of the windows used during real time acquisition.
The Dynamic view tab is functional to the representation type during Fast view, Editing and Default mode.
In the File system tab the user can set-up the number of last edited projects visible in the File Menu and reset recent files.
The Colors tab can be used to change the layouts of the windows for:
- the spectrum representation,
- the surface representation,
- the frame representation,
- the colors for the active selection,
- the colors used during the Graphic Editor Mode,
Finally, in the Units tab, is provided a collection of the Physic Units used by default during program operation.
