Difference between revisions of "NVGate Monitor Plug In"
| (12 intermediate revisions by 2 users not shown) | |||
| Line 1: | Line 1: | ||
[[category:NVGate]] | |||
The Monitor plug-in offers simple and powerful ways to monitor the measured signals. This 4 channels plug-in runs independently from the general analyzer status (running/Paused/stopped) with the capability of swapping connected channels at any time. | The Monitor plug-in offers simple and powerful ways to monitor the measured signals. This 4 channels plug-in runs independently from the general analyzer status (running/Paused/stopped) with the capability of swapping connected channels at any time. | ||
[[Image:Reports_Tools_Ribbons_378.png|framed|right]] | |||
[[Image:Reports_Tools_Ribbons_378.png|framed| | The second capability of the monitor is to extract statistical components of the signal in a specific bandwidth. Extracted levels can be used for triggering and waterfall references. | ||
The second capability of the monitor is to extract statistical | |||
The monitor runs its analyses on a specific processor (DSP) allowing a totally independent computation for the regular analyses. | The monitor runs its analyses on a specific processor (DSP) allowing a totally independent computation for the regular analyses. | ||
| Line 9: | Line 8: | ||
Note: Clicking on the bottom right icon ([[Image:Reports_Tools_Ribbons_379.png]]) opens the monitor plug-in properties dialog allowing a full access to all the settings. | Note: Clicking on the bottom right icon ([[Image:Reports_Tools_Ribbons_379.png]]) opens the monitor plug-in properties dialog allowing a full access to all the settings. | ||
==Monitor== | |||
The Monitor input can be connected and hot swapped independently of any plug-in analysis. It is used to monitor one or several signals. | |||
[[Image:Waterfall_monitor_01.png|framed|none]] | |||
==Connect tutorial== | |||
*Click on tab: Acquisition, connect Input, then drag and drop the channels on monitor. | |||
[[File:monitor.png|framed|none]] | |||
* note that you can have a scalar profile by putting the scalar into the waterfall. | |||
[[File:monitor3.png|500px|none]] | |||
==Display and Available results== | |||
You can display the results using add/remove windows. | |||
[[File:monitor2.png|700px|none]] | |||
* '''Triggered block''': This displays the time domain signal''.'' | * '''Triggered block''': This displays the time domain signal''.'' | ||
* '''Inst. spectrum''': | * '''Inst. spectrum''': This displays the FFT processing results. | ||
* '''Avg. spectrum''': | * '''Avg. spectrum''': This displays the average spectrum. | ||
* '''DC, Max, Min, RMS, Kurtosis''' on a specified band | * '''DC, Max, Min, RMS, Kurtosis''' on a specified band | ||
===== | ==Settings== | ||
===Channel=== | |||
[[File:Monitor5.png|framed]] | |||
* [[Image:Reports_Tools_Ribbons_380.png]]'''Inputs:''' Opens the channels sources selection. Allows choosing which input or track is monitored. Up to 4 ch at a time. The channel sources can be swapped at any time sis, record, play-back) of the instrument. | * [[Image:Reports_Tools_Ribbons_380.png]]'''Inputs:''' Opens the channels sources selection. Allows choosing which input or track is monitored. Up to 4 ch at a time. The channel sources can be swapped at any time sis, record, play-back) of the instrument. | ||
Contains the source of the signal to be monitored. | Contains the source of the signal to be monitored. | ||
| Line 30: | Line 38: | ||
* '''Source<ref>Using input 5 to input 8 as source with an OR35 analyzer will cause Non-real-time analysis. This way may lose some trigger event samples.</ref>''': input source to be analyzed. It may come from the Front-end input or from the Player in post analysis mode (see the post analysis chapter). In post analysis mode, tracks with a signal bandwidth lower than the range of the Monitor cannot be plugged. | * '''Source<ref>Using input 5 to input 8 as source with an OR35 analyzer will cause Non-real-time analysis. This way may lose some trigger event samples.</ref>''': input source to be analyzed. It may come from the Front-end input or from the Player in post analysis mode (see the post analysis chapter). In post analysis mode, tracks with a signal bandwidth lower than the range of the Monitor cannot be plugged. | ||
===FFT analysis=== | |||
Contains the settings related to the FFT analysis of the signals to be monitored. | Contains the settings related to the FFT analysis of the signals to be monitored. | ||
| Line 45: | Line 53: | ||
===Overall analysis=== | |||
[[Image:Waterfall_monitor_02.png|framed|none]] | [[Image:Waterfall_monitor_02.png|framed|none]] | ||
| Line 52: | Line 60: | ||
* '''Avg duration''': Each scalar is computed for each block of signal (length of the block is 256/ (''Front-end / Input Sampling''), and then average during the value of the setting. | * '''Avg duration''': Each scalar is computed for each block of signal (length of the block is 256/ (''Front-end / Input Sampling''), and then average during the value of the setting. | ||
* '''Filter order''': the order of the filter: 2, 4, 6, 8 or 10. | * '''Filter order''': the order of the filter: 2, 4, 6, 8 or 10. | ||
Revision as of 14:01, 24 November 2020
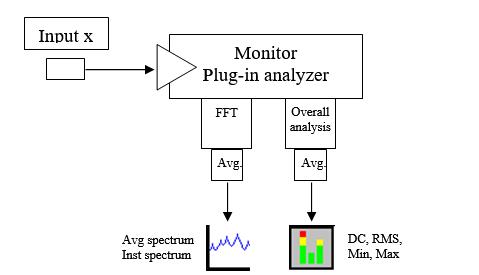
The Monitor plug-in offers simple and powerful ways to monitor the measured signals. This 4 channels plug-in runs independently from the general analyzer status (running/Paused/stopped) with the capability of swapping connected channels at any time.
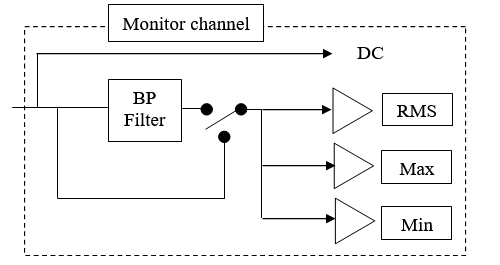
The second capability of the monitor is to extract statistical components of the signal in a specific bandwidth. Extracted levels can be used for triggering and waterfall references.
The monitor runs its analyses on a specific processor (DSP) allowing a totally independent computation for the regular analyses.
Note: Clicking on the bottom right icon (![]() ) opens the monitor plug-in properties dialog allowing a full access to all the settings.
) opens the monitor plug-in properties dialog allowing a full access to all the settings.
Monitor
The Monitor input can be connected and hot swapped independently of any plug-in analysis. It is used to monitor one or several signals.
Connect tutorial
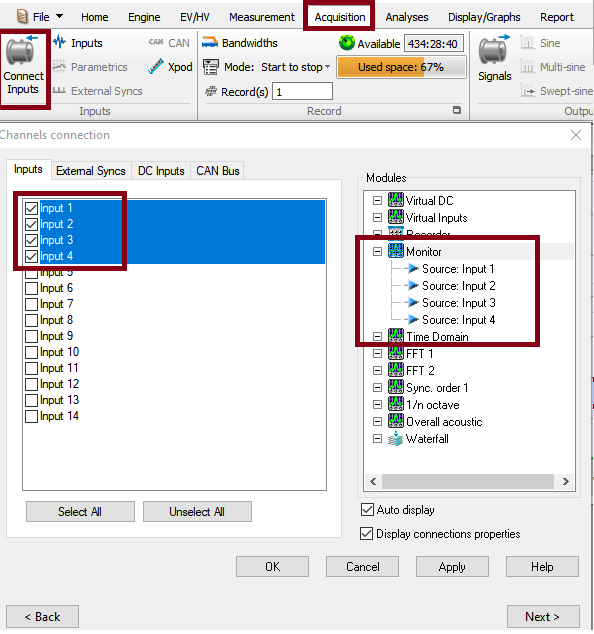
- Click on tab: Acquisition, connect Input, then drag and drop the channels on monitor.
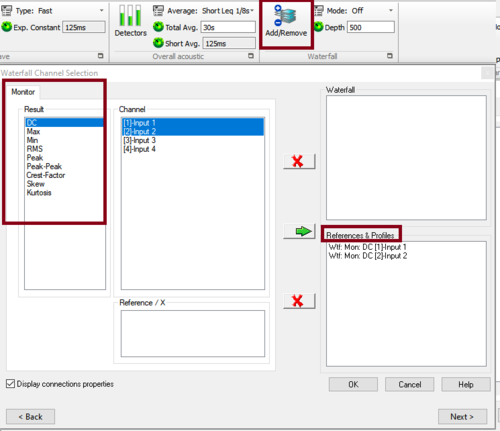
- note that you can have a scalar profile by putting the scalar into the waterfall.
Display and Available results
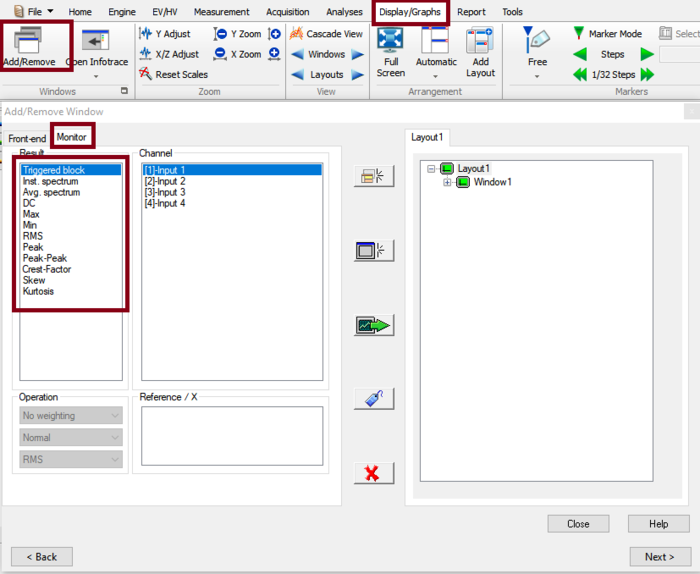
You can display the results using add/remove windows.
- Triggered block: This displays the time domain signal.
- Inst. spectrum: This displays the FFT processing results.
- Avg. spectrum: This displays the average spectrum.
- DC, Max, Min, RMS, Kurtosis on a specified band
Settings
Channel
 Inputs: Opens the channels sources selection. Allows choosing which input or track is monitored. Up to 4 ch at a time. The channel sources can be swapped at any time sis, record, play-back) of the instrument.
Contains the source of the signal to be monitored.
- Source<ref>Using input 5 to input 8 as source with an OR35 analyzer will cause Non-real-time analysis. This way may lose some trigger event samples.</ref>: input source to be analyzed. It may come from the Front-end input or from the Player in post analysis mode (see the post analysis chapter). In post analysis mode, tracks with a signal bandwidth lower than the range of the Monitor cannot be plugged.
FFT analysis
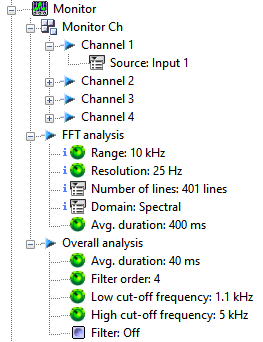
Contains the settings related to the FFT analysis of the signals to be monitored.
- Range: the frequency range of the Monitor plug in.
Hidden/fixed: The monitor range is fixed by the input frequency range (in connected mode on-line) and by the max bandwidth of the player (in post analysis mode).
- Frequency Span: This is a fixed setting, for information only. It displays the frequency span between two points of a spectral result. The FFT frequency span is obtained by dividing the frequency range of the FFT by the resolution minus 1. For example if the FFT Range is 20kHz and the resolution is 401 lines, then the frequency span is: 20000 / (401 - 1) = 20000 / 400 = 50Hz.
- Resolution: the resolution of the FFT. The FFT frequency span is obtained by dividing the FFT frequency range by the resolution minus 1. For example, if the FFT Range is 20kHz and the resolution is 401 lines, then the frequency span is: 20000 / (401 - 1) = 20000 / 400 = 50Hz.
Hidden/fixed: fixed to 401 lines
- Domain: The averaging domain: spectral domain averaging computes the average after FFT processing.
Hidden/fixed: fixed to spectral
Overall analysis
 Overall analysis: Opens the statistical extraction setting. This dialog set up the filter characteristics and the averaging of the extracted values (DC, RMS, Min/Max, Kurtosis)
- Avg duration: Each scalar is computed for each block of signal (length of the block is 256/ (Front-end / Input Sampling), and then average during the value of the setting.
- Filter order: the order of the filter: 2, 4, 6, 8 or 10.
- Low cut-off frequency: the low cut-off frequency of the filter. Its minimum value is 0.055 * FR, where FR is the input frequency range. However, the following conditions must also be fulfilled:
0.0075 * FR <= B <= 0.5 FR,
Where B is the bandwidth between Low and high cut-off frequency
and FR is the input frequency range.
- High cut-off frequency: the high cut-off frequency of the filter. Its maximum value is the input frequency range. However, the following conditions must also be fulfilled: see Low cut-off frequency.
 Filter: Allows applying the filter (Tick on) or bypassing it (No Tick). The Bypass is immediate without delay.

