Difference between revisions of "Monitoring Solution"
m (English edits) |
|||
| Line 1: | Line 1: | ||
== | ==IntroductionHeader== | ||
The OROS Monitoring solution is a tool dedicated to advanced triggering based on analysis results | The OROS Monitoring solution is a tool dedicated to advanced triggering based on analysis results. It includes a "watch dog" feature to keep NVGate and analyzer running over a long period of time. | ||
It can manage the automatic recovery of the Monitoring module, restart the analysis, NVGate, as well as the analyzer (using the additional USB/RJ11 autonomy box). | It can manage the automatic recovery of the Monitoring module, restart the analysis, NVGate, as well as the analyzer (using the additional USB/RJ11 autonomy box). | ||
| Line 6: | Line 6: | ||
This module routinely identifies and evaluates user selected parameters and provides a panel of conditional actions to complete. The main features are: | This module routinely identifies and evaluates user selected parameters and provides a panel of conditional actions to complete. The main features are: | ||
* Ensure the analyzer is running. | * Ensure that the analyzer is running. | ||
* Ensure NVGate is running. | * Ensure that NVGate is running. | ||
* Trigger actions (macro, exe | * Trigger actions (macro, exe, etc.) depending on conditional measured scalar values. | ||
This module is dedicated for mid to long term monitoring in order to have an autonomous recording and analysis. | This module is dedicated for mid to long term monitoring in order to have an autonomous recording and analysis. | ||
<font color="#FFFFFF"> | <font color="#FFFFFF"> | ||
[[Image: | [[Image:Monitoring_OROS_02.png|framed|none]] | ||
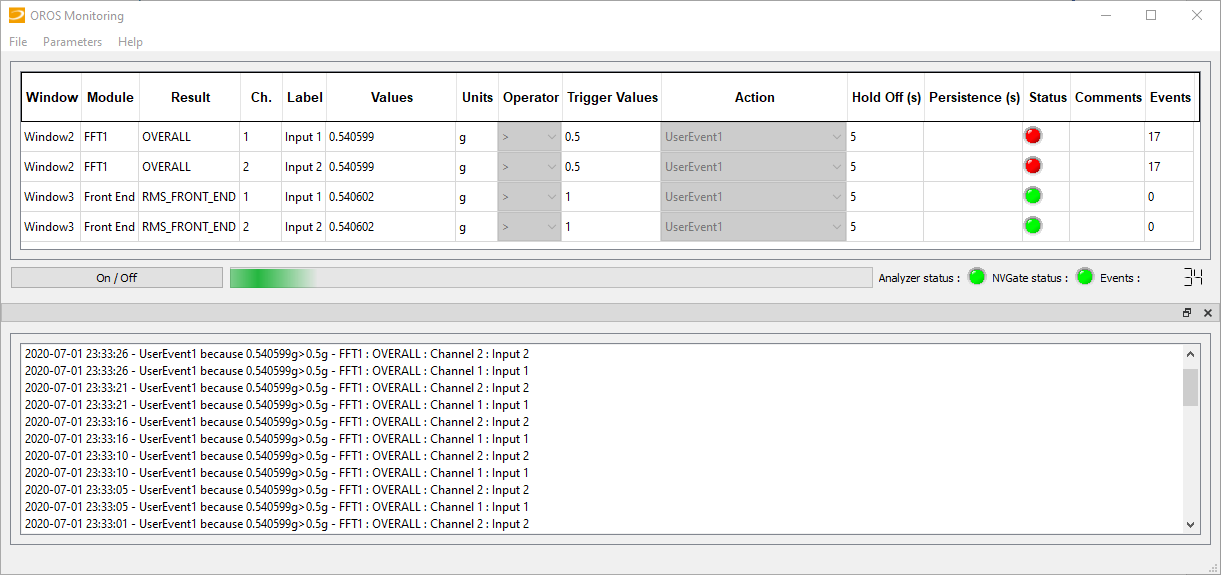
</font>''Figure 1 - Monitoring | </font>''Figure 1 - Monitoring application interface'' | ||
---- | ---- | ||
== | ==Installation== | ||
=== | ===Software installation=== | ||
When the setup is ready, launch the setup.exe contained in the installation and follow the installation wizard. It is recommended to keep the default installation path. It will create a shortcut on your desktop but also to NVGate "Links" folder in order to have a direct access from NVGate via the link section. | |||
The drivers for the Autonomy Box are installed during the default installation. | |||
In order to ensure an autonomous monitoring, it is necessary that both the PC and Monitoring Application are able to be automatically restarted. To allow that: create a shortcut of the Monitoring application into the windows startup directory (C:\Users\USERNAME\AppData\Roaming\Microsoft\Windows\Start Menu\Programs\Startup). The monitoring application will take care of restarting NVGate if it is not already running. | |||
===Autonomy kit installation=== | |||
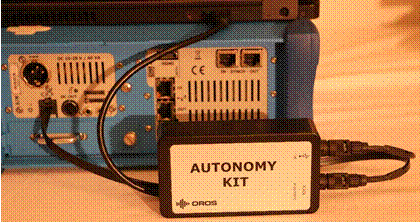
The autonomy kit must be plugged on the RJ11 analyzer<nowiki>'</nowiki>s port and to the USB slot of the computer, and drivers should be installed. Drivers are provided in the installation and can also be installed manually in case troubleshooting is necessary. | |||
This autonomy kit is dedicated to OROS analyzers. Do not use with any other device. | |||
Only use original components furnished. | |||
[[Image:Monitoring_OROS_03.gif|framed|none]] | |||
<font color="#1F497D"> | |||
[[Image:Monitoring_OROS_01.png|framed|none]] | |||
''Figure 2 – Autonomy kit installation in case of OR36''</font> | |||
This '''Autonomy Kit''' contains electronic equipment. It should not be mixed with general household waste. For proper treatment, return this product to OROS or to any local company authorized to recycle waste electrical and electronic equipment. | |||
This '''Autonomy Kit''' complies with following European Standards: | |||
* 2014/35/EU low voltage directive | |||
* 2011/65/EU and 2015/863 ROHS directive | |||
* 2012/19/EU WEEE directive | |||
---- | |||
===PC and Windows configuration=== | |||
In order to guarantee a full autonomy, the computer must be configured to reboot in case of any power failure. The following PC parameters are advised: | |||
<u>'''PC automatic restart due to power failure:'''</u> | |||
To account for any potential power failure at the analyzers location the following settings should be programmed on the PC to automatically switch on the PC once the power is restored. | |||
Access the PC<nowiki>'</nowiki>s BIOS: | |||
* Restart PC, press F12 (on most PC<nowiki>'</nowiki>s) to access the PC<nowiki>'</nowiki>s Bios. | |||
* Check the Bios parameters. | |||
* On power management check the option "power on AC". | |||
Specific settings should be chosen in the computer | |||
* PC | |||
{|border="2" cellspacing="0" cellpadding="4" width="1%" | |||
| | |||
| | |||
|} | |||
Contact you IT manager to properly configure the computer : disable low-power sleep mode, no password to automatically restart windows, no low-energy or powering-off option …). In addition, installation of Teamviewer is recommended in order to monitor from a remote access. | |||
If you plan to monitor your application for more than a couple of hours, it is advised to power both the computer and the OROS analyzer by mains (not on battery). | |||
Consider installing a remote access software. | |||
It could be useful to control the computer when an alert is trigged for example. | |||
---- | |||
First | ==Operating the Monitoring solution== | ||
===First steps in NVGate=== | |||
One should go first through the basic settings of the acquisition of NVGate. From NVGate, setup a project dedicated to monitoring and display the scalar values which should be monitored on the current layout. | |||
<font color="#4DA836">'''Create a new project'''</font> | |||
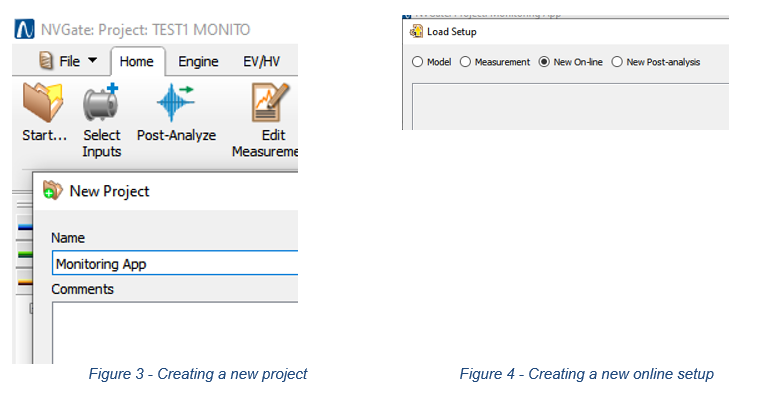
A new project, with the name "Monitoring App", should be created as below when first starting. | |||
Then a new setup configuration should be started | |||
[[Image:Monitoring_OROS_04.png|framed|none]] | |||
<font color="#4DA836">'''Setting up the inputs and analysis'''</font> | |||
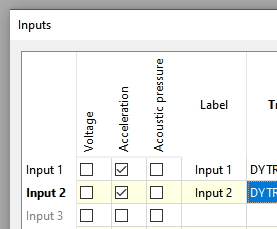
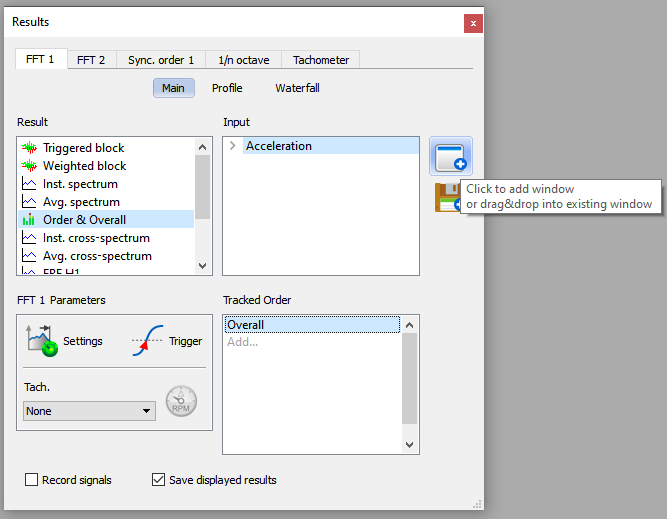
Then one should go through inputs, analysis and display setups using for example ''Gotoresult'' | |||
[[Image:Monitoring_OROS_05.png|framed|none]] | |||
Figure 5 - <font color="#1F497D">''Inputs setup'' | |||
</font> | |||
[[Image:Monitoring_OROS_06.png|framed|none]] | |||
= | Figure 6 - <font color="#1F497D">''Adding displays of Scalar values''</font> | ||
It is necessary to display scalar values: those will be the ones to be monitored and trigger actions | |||
<font color="# | <font color="#4DA836">'''Adding/naming a layout:'''</font> | ||
This current layout must be named "Monitoring". Here below is shown one way to rename the current layout: right click on "Layout1" and the rename possibility is shown | |||
[[Image: | [[Image:Monitoring_OROS_07.png|framed|none]] | ||
<font color="#1F497D">''Figure | <font color="#1F497D">''Figure 7 - Renaming the layout''</font> | ||
---- | |||
<font color="#4DA836">'''Saving the project and the model'''</font> | |||
[[Image:Monitoring_OROS_08.png|framed|none]] | |||
Then the project should be saved | |||
===First steps in the Monitoring Application=== | |||
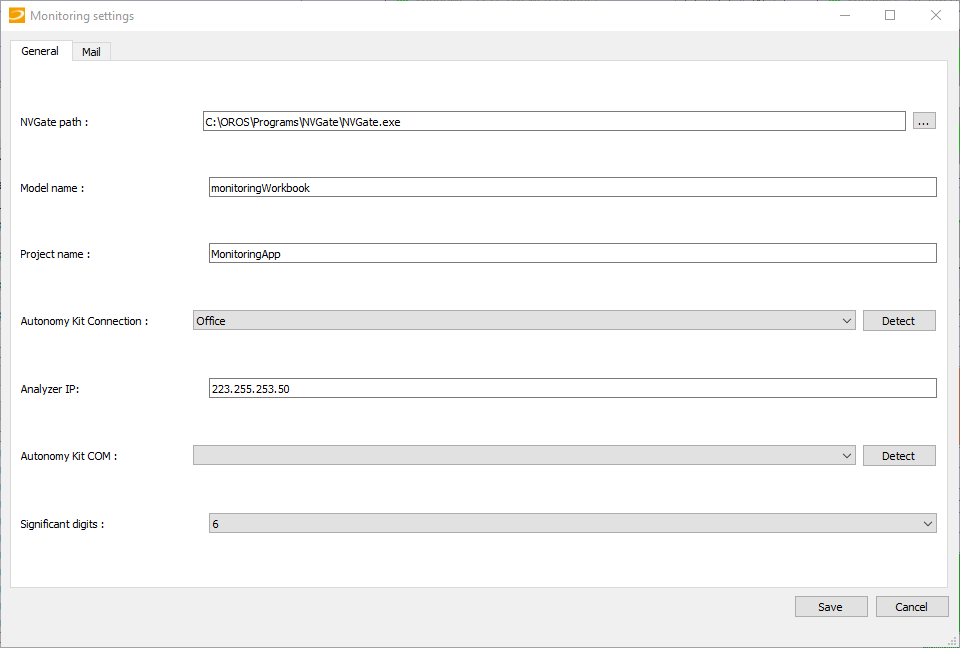
Launch "Monitoring_Settings.exe" which is located into Monitoring folder. You will be able to fill some values which are necessary to monitor and operate the watchdog. Those are: | |||
* '''NVGate location''': NVGate folder location (containing NVGate.exe). | |||
* '''Workbook name''': Name of the monitoring model. | |||
* '''Project name''': Name of the monitoring project. | |||
* '''Autonomy kit connection''': Analyzer type should be detected automatically. This is necessary to ensure the Monitoring Box functions properly. It supports V2 and V3s instruments (for OR36 and OR38) as well as OR35TW | |||
* '''Analyzer IP''': If the IP is not defined correctly, the application will not be able to check if the unit is on and therefore will also not be able to boot or shutdown the Analyzer. | |||
* '''RebootBox COM:''' Select the Monitoring Box COM Port. This is required to boot/shutdown the analyzer. If the Monitoring Box is not connected, or the correct drivers are not installed the list will be empty. If more than one COM port are listed, please ensure you are selecting the rebootbox one. | |||
* '''Significant digits:''' Set significant digits to display. | |||
As shown in the dialog window as below | |||
[[Image:Monitoring_OROS_09.png|framed|none]] | |||
'' | <font color="#1F497D">''Figure 10 - Monitoring and Autonomy box parameters settings''</font> | ||
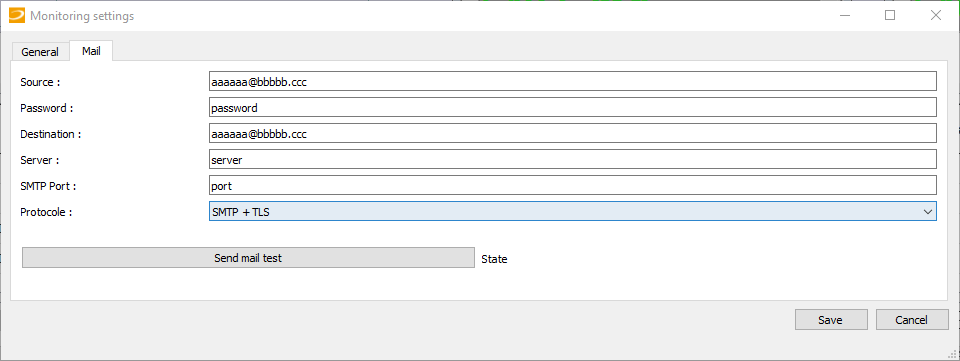
In the following window, settings can be entered in order to let the system use the email Action | |||
[[Image:Monitoring_OROS_10.png|framed|none]] | |||
<font color="#1F497D">''Figure 11 – Setup of the email''</font> | |||
===First start of the Monitoring Application=== | |||
After parameters set-up, launch the Monitoring application, press "Refresh", It will recognize some parameters and display your scalars in the current layout. | |||
Then, configure the condition you want for each scalar and linked actions. To do that, select an operator to compare the measured value with the target value (which must also be defined). For example, if you select "<nowiki>></nowiki>" and "2" for an acceleration scalar, when this value is larger than 2 the selected action will be triggered. | |||
Finally, close the Monitoring Application, close NVGate, shutdown your analyzer, and then launch the Monitoring Application. If everything starts by itself, Monitoring was setup properly and monitoring has initiated. | |||
=== | ===User interface=== | ||
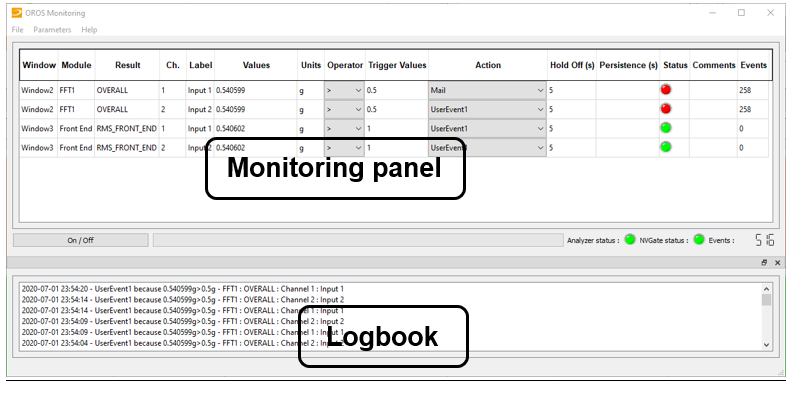
The user interface main window is as below. It is built with 3 main sections: Parameters (as described previously), Monitoring panel, and the Logbook. | |||
[[Image:Monitoring_OROS_11.png|framed|none]] | |||
<font color="#1F497D">''Figure 12 - Main user interface window''</font> | |||
<u>----</u> | |||
[[Image: | [[Image:Monitoring_OROS_12.png|framed|none]] | ||
<font color="#1F497D">''Figure | <font color="#1F497D">''Figure 13 - Main user interface window''</font> | ||
=== | ===Monitoring panel=== | ||
[[Image:Monitoring_OROS_13.png|framed|none]] | |||
<font color="#1F497D">''Figure 14 - The Monitoring panel window''</font> | |||
The columns have the following content: | |||
* | * Information retrieved from NVGate running project: | ||
* | * '''Window: '''Selected scalar window<nowiki>'</nowiki>s name. | ||
* '''Module: '''Selected scalar module<nowiki>'</nowiki>s name. | |||
* '''Result: '''Selected scalar process<nowiki>'</nowiki>s name. | |||
* '''Channel: '''Selected scalar channel<nowiki>'</nowiki>s number. | |||
* '''Label: '''Selected scalar input<nowiki>'</nowiki>s name. | |||
* '''Values: '''Selected scalar values (SI). | |||
* '''Units: '''Selected scalar units. | |||
* Information specified by the user: | |||
* '''Operator: '''Condition to be satisfied for actions: | |||
* '''<nowiki>></nowiki>: '''If the measured value is greater than the target value, then action. | |||
* '''<nowiki><</nowiki>: '''If the measured value is less than the target value, then action. | |||
* '''Cross: '''If the measured value crosses the target value, then action. | |||
* '''Trigger Values: '''Condition to be satisfied for actions. | |||
* '''Action: '''What do you want to do when the condition is satisfied: | |||
* Activate / Deactivate outputs. | |||
* Run / Stop analyzer. | |||
* Trigger a User Event. | |||
* Launch a macro (coming from NVGate). | |||
* Email | |||
* '''Hold off (s): '''Time holdoff is the delay between each action coming from this scalar (e.g.: 10s means the action cannot be triggered during the 10s following a triggered action.). Default value is 5 seconds and must be higher than 1 second. | |||
* '''Persistence (s): '''Time persistence is the time necessary to trig the action (e.g.: 2s means the action will be triggered only if the condition is respected during 2s). | |||
* '''Comments: '''Comments, it will be used for measurement name. | |||
* Information computed by the monitoring application: | |||
* '''Status: '''Green if the condition is not satisfied (no action). Red if the condition is satisfied (action). | |||
* '''Events: '''How many times it has been triggered. | |||
Revision as of 14:51, 2 July 2020
IntroductionHeader
The OROS Monitoring solution is a tool dedicated to advanced triggering based on analysis results. It includes a "watch dog" feature to keep NVGate and analyzer running over a long period of time.
It can manage the automatic recovery of the Monitoring module, restart the analysis, NVGate, as well as the analyzer (using the additional USB/RJ11 autonomy box).
This module routinely identifies and evaluates user selected parameters and provides a panel of conditional actions to complete. The main features are:
- Ensure that the analyzer is running.
- Ensure that NVGate is running.
- Trigger actions (macro, exe, etc.) depending on conditional measured scalar values.
This module is dedicated for mid to long term monitoring in order to have an autonomous recording and analysis.
Figure 1 - Monitoring application interface
Installation
Software installation
When the setup is ready, launch the setup.exe contained in the installation and follow the installation wizard. It is recommended to keep the default installation path. It will create a shortcut on your desktop but also to NVGate "Links" folder in order to have a direct access from NVGate via the link section.
The drivers for the Autonomy Box are installed during the default installation.
In order to ensure an autonomous monitoring, it is necessary that both the PC and Monitoring Application are able to be automatically restarted. To allow that: create a shortcut of the Monitoring application into the windows startup directory (C:\Users\USERNAME\AppData\Roaming\Microsoft\Windows\Start Menu\Programs\Startup). The monitoring application will take care of restarting NVGate if it is not already running.
Autonomy kit installation
The autonomy kit must be plugged on the RJ11 analyzer's port and to the USB slot of the computer, and drivers should be installed. Drivers are provided in the installation and can also be installed manually in case troubleshooting is necessary.
This autonomy kit is dedicated to OROS analyzers. Do not use with any other device.
Only use original components furnished.
Figure 2 – Autonomy kit installation in case of OR36
This Autonomy Kit contains electronic equipment. It should not be mixed with general household waste. For proper treatment, return this product to OROS or to any local company authorized to recycle waste electrical and electronic equipment.
This Autonomy Kit complies with following European Standards:
- 2014/35/EU low voltage directive
- 2011/65/EU and 2015/863 ROHS directive
- 2012/19/EU WEEE directive
PC and Windows configuration
In order to guarantee a full autonomy, the computer must be configured to reboot in case of any power failure. The following PC parameters are advised:
PC automatic restart due to power failure:
To account for any potential power failure at the analyzers location the following settings should be programmed on the PC to automatically switch on the PC once the power is restored.
Access the PC's BIOS:
- Restart PC, press F12 (on most PC's) to access the PC's Bios.
- Check the Bios parameters.
- On power management check the option "power on AC".
Specific settings should be chosen in the computer
- PC
Contact you IT manager to properly configure the computer : disable low-power sleep mode, no password to automatically restart windows, no low-energy or powering-off option …). In addition, installation of Teamviewer is recommended in order to monitor from a remote access.
If you plan to monitor your application for more than a couple of hours, it is advised to power both the computer and the OROS analyzer by mains (not on battery).
Consider installing a remote access software.
It could be useful to control the computer when an alert is trigged for example.
Operating the Monitoring solution
First steps in NVGate
One should go first through the basic settings of the acquisition of NVGate. From NVGate, setup a project dedicated to monitoring and display the scalar values which should be monitored on the current layout.
Create a new project
A new project, with the name "Monitoring App", should be created as below when first starting.
Then a new setup configuration should be started
Setting up the inputs and analysis
Then one should go through inputs, analysis and display setups using for example Gotoresult
Figure 5 - Inputs setup
Figure 6 - Adding displays of Scalar values
It is necessary to display scalar values: those will be the ones to be monitored and trigger actions
Adding/naming a layout:
This current layout must be named "Monitoring". Here below is shown one way to rename the current layout: right click on "Layout1" and the rename possibility is shown
Figure 7 - Renaming the layout
Saving the project and the model
Then the project should be saved
First steps in the Monitoring Application
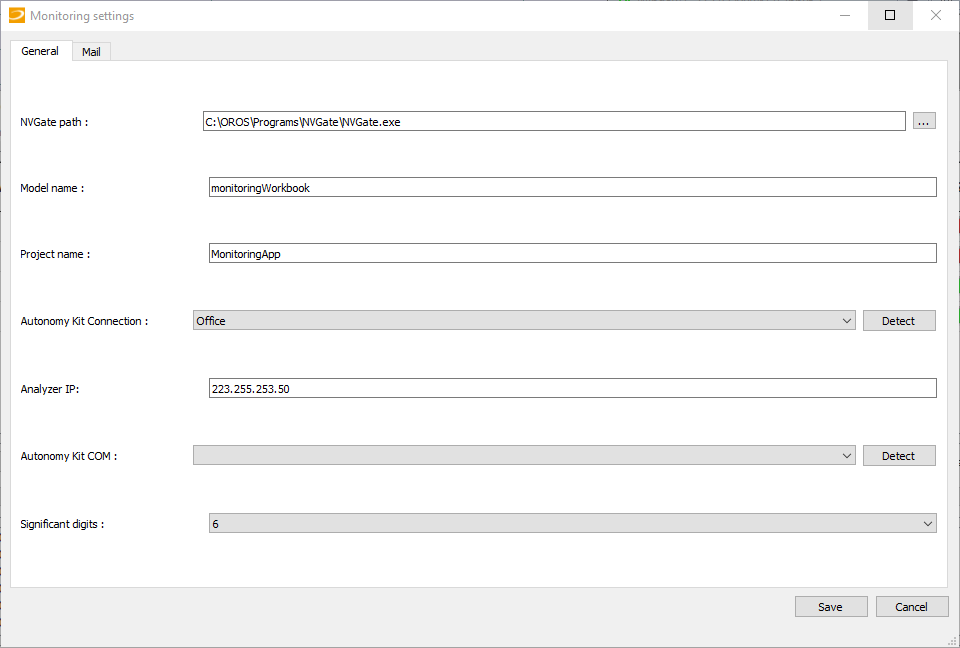
Launch "Monitoring_Settings.exe" which is located into Monitoring folder. You will be able to fill some values which are necessary to monitor and operate the watchdog. Those are:
- NVGate location: NVGate folder location (containing NVGate.exe).
- Workbook name: Name of the monitoring model.
- Project name: Name of the monitoring project.
- Autonomy kit connection: Analyzer type should be detected automatically. This is necessary to ensure the Monitoring Box functions properly. It supports V2 and V3s instruments (for OR36 and OR38) as well as OR35TW
- Analyzer IP: If the IP is not defined correctly, the application will not be able to check if the unit is on and therefore will also not be able to boot or shutdown the Analyzer.
- RebootBox COM: Select the Monitoring Box COM Port. This is required to boot/shutdown the analyzer. If the Monitoring Box is not connected, or the correct drivers are not installed the list will be empty. If more than one COM port are listed, please ensure you are selecting the rebootbox one.
- Significant digits: Set significant digits to display.
As shown in the dialog window as below
Figure 10 - Monitoring and Autonomy box parameters settings
In the following window, settings can be entered in order to let the system use the email Action
Figure 11 – Setup of the email
First start of the Monitoring Application
After parameters set-up, launch the Monitoring application, press "Refresh", It will recognize some parameters and display your scalars in the current layout.
Then, configure the condition you want for each scalar and linked actions. To do that, select an operator to compare the measured value with the target value (which must also be defined). For example, if you select ">" and "2" for an acceleration scalar, when this value is larger than 2 the selected action will be triggered.
Finally, close the Monitoring Application, close NVGate, shutdown your analyzer, and then launch the Monitoring Application. If everything starts by itself, Monitoring was setup properly and monitoring has initiated.
User interface
The user interface main window is as below. It is built with 3 main sections: Parameters (as described previously), Monitoring panel, and the Logbook.
Figure 12 - Main user interface window
----
Figure 13 - Main user interface window
Monitoring panel
Figure 14 - The Monitoring panel window
The columns have the following content:
- Information retrieved from NVGate running project:
- Window: Selected scalar window's name.
- Module: Selected scalar module's name.
- Result: Selected scalar process's name.
- Channel: Selected scalar channel's number.
- Label: Selected scalar input's name.
- Values: Selected scalar values (SI).
- Units: Selected scalar units.
- Information specified by the user:
- Operator: Condition to be satisfied for actions:
- >: If the measured value is greater than the target value, then action.
- <: If the measured value is less than the target value, then action.
- Cross: If the measured value crosses the target value, then action.
- Trigger Values: Condition to be satisfied for actions.
- Action: What do you want to do when the condition is satisfied:
- Activate / Deactivate outputs.
- Run / Stop analyzer.
- Trigger a User Event.
- Launch a macro (coming from NVGate).
- Hold off (s): Time holdoff is the delay between each action coming from this scalar (e.g.: 10s means the action cannot be triggered during the 10s following a triggered action.). Default value is 5 seconds and must be higher than 1 second.
- Persistence (s): Time persistence is the time necessary to trig the action (e.g.: 2s means the action will be triggered only if the condition is respected during 2s).
- Comments: Comments, it will be used for measurement name.
- Information computed by the monitoring application:
- Status: Green if the condition is not satisfied (no action). Red if the condition is satisfied (action).
- Events: How many times it has been triggered.
