Difference between revisions of "NVGate Envelope analysis"
(Created page with "==SUBJET: Using the envelope analysis for roller bearing defect detection<br>== '''Objective:''' Abnormal vibrations were detected on a speed reducing gear box. We proceed t...") |
m (English edits) |
||
| (2 intermediate revisions by one other user not shown) | |||
| Line 1: | Line 1: | ||
Using the envelope analysis for roller bearing defect detection. | |||
===Objective:=== | |||
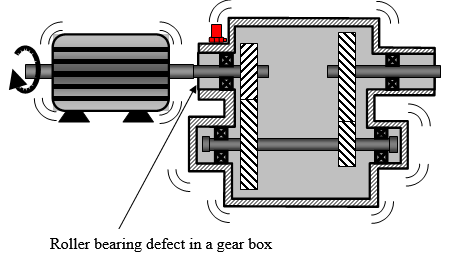
Abnormal vibrations were detected on a speed reducing gear box. We | Abnormal vibrations were detected on a speed reducing gear box. We proceeded to diagnose the machine. A default in the roller bearing is suspected. An accelerometer is positioned close to the bearing and connected to the OR3X analyzer. | ||
[[Image:Envelope_01.png|framed|none]] | [[Image:Envelope_01.png|framed|none]] | ||
===Necessary equipment:=== | |||
OROS analyzer | OROS analyzer with NVgate Software | ||
In this example, we are analyzing the time signal file recorded with the analyzer. Office mode of NVGate is used. | |||
===Description:=== | |||
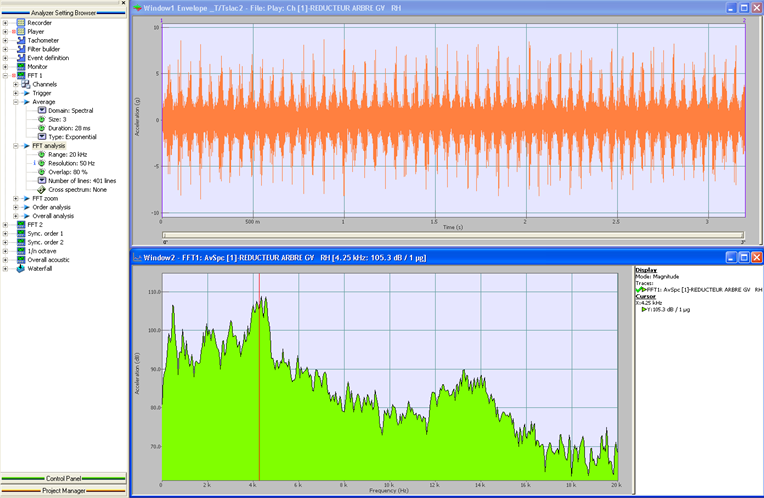
The first step consists of the traditional FFT spectrum analysis of the signal in the complete frequency bandwidth (0-20 kHz). | |||
The first step consists | |||
The zoom analysis is used in the second step. The third step describes the envelope analysis. | The zoom analysis is used in the second step. The third step describes the envelope analysis. | ||
Finally, we will also proceed to the analysis of the demodulated signal in the fourth step | Finally, we will also proceed to the analysis of the demodulated signal in the fourth step. | ||
---- | ---- | ||
===Step 1: Traditional Spectrum Analysis=== | |||
In a first step, we | In a first step, we determine the spectrum obtained from the accelerometer signal. The signal is considered on a frequency band 0-20 kHz. | ||
[[Image:Envelope_02.png|framed|none]] | [[Image:Envelope_02.png|framed|none|Figure 1: Spectrum Analysis]] | ||
With the cursor we can detect two resonance domains. The first resonance is detected around 4.3 kHz and the second one around 13.3 kHz. | With the cursor we can detect two resonance domains. The first resonance is detected around 4.3 kHz and the second one around 13.3 kHz. | ||
---- | ---- | ||
===Step 2: Zoom Analysis=== | |||
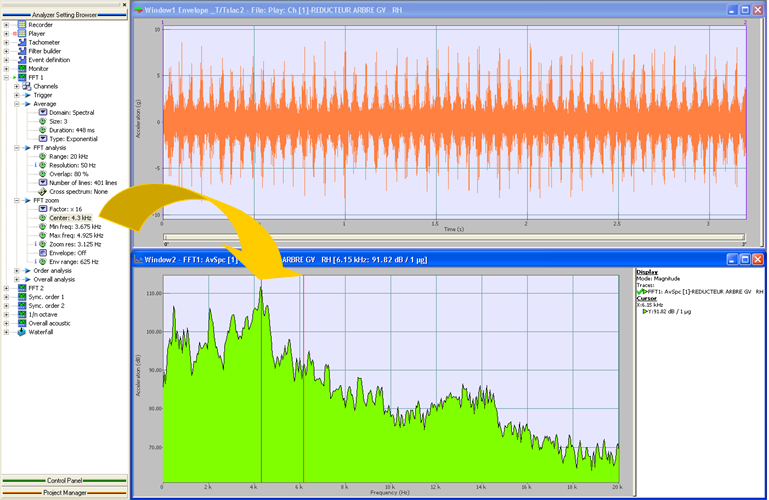
The traditional approach is to use a zoom analysis around 4.3 and 13.3 kHz in our case. In the NVGate software, define the settings of the FFT Zoom by: | |||
* Setting a zoom factor of 16. | |||
* Defining the center frequency of the zoom at 4.3 kHz in a first time. We can also use the drag and drop action to place the center frequency in the averaged spectrum window. | |||
[[Image:Envelope_03.png|framed|none|Figure 2 - Zoom Analysis Settings]] | |||
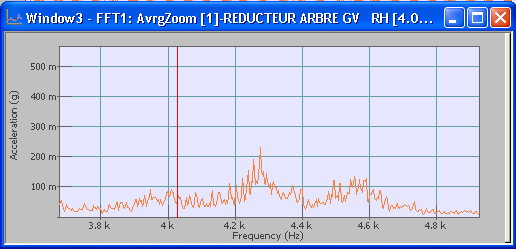
Now the Zoomed averaged spectrum window can be displayed (Figure 3). | Now the Zoomed averaged spectrum window can be displayed (Figure 3). | ||
[[Image:Envelope_04.png|framed|none]] | [[Image:Envelope_04.png|framed|none|Figure 3- Zoom Analysis]] | ||
The zoomed spectrum helps us to have a better resolution around the carrier frequency at which the signal is demodulated. For doing this kind of analysis we can use the side band markers. A typical signal spectrum can be seen as it usually has a central frequency line with lower amplitude side lines, as shown on the figure below: | |||
The zoomed spectrum helps us to have a better resolution around the carrier frequency at which the signal is demodulated. For doing this kind of analysis we can use the side band markers. | |||
[[Image:Envelope_05.gif|framed|none|Figure 4- Envelope Analysis]] | |||
If we see such a spectrum shape then it means we can start the envelope analysis. | If we see such a spectrum shape then it means we can start the envelope analysis. | ||
| Line 60: | Line 58: | ||
In the NVGate software, we use the side band markers in the Zoomed averaged spectrum window to identify the modulation frequency (Figure 5). | In the NVGate software, we use the side band markers in the Zoomed averaged spectrum window to identify the modulation frequency (Figure 5). | ||
[[Image:Envelope_06.png|framed|none]] | [[Image:Envelope_06.png|framed|none|figure 5: Side band markers in the Zoomed averaged spectrum window around 13.3 kHz]] | ||
We | |||
We suspect a modulation frequency of 148.4 Hz which exactly corresponds to the value of the inner bearing race defect frequency provided by the manufacturer of the ball bearing. | |||
From the shape of this spectrum we can also see there is a modulation phenomenon. This is why we are going to proceed to the envelop analysis to check the demodulated signal and its spectrum. | From the shape of this spectrum we can also see there is a modulation phenomenon. This is why we are going to proceed to the envelop analysis to check the demodulated signal and its spectrum. | ||
| Line 70: | Line 68: | ||
---- | ---- | ||
===Step 3: Envelope Analysis=== | |||
The envelope mode is activated by choosing a zoom factor (already done in our example) and checking the box "Envelope" (Figure 6). | The envelope mode is activated by choosing a zoom factor (already done in our example) and checking the box "Envelope" (Figure 6). | ||
| Line 76: | Line 74: | ||
The Envelop trigger and the Envelope spectrum windows can now be displayed (number 4 of the Figure 6). | The Envelop trigger and the Envelope spectrum windows can now be displayed (number 4 of the Figure 6). | ||
[[Image:Envelope_07.png|framed|none]] | [[Image:Envelope_07.png|framed|none|Figure 6- Envelope and Zoom Analysis at 13.3 kHz]] | ||
'' | '''' | ||
Five shocks per revolution are identified in the Envelope trigger window obtained after the signal demodulation (number 4 of the Figure 6). | Five shocks per revolution are identified in the Envelope trigger window obtained after the signal demodulation (number 4 of the Figure 6). | ||
We are using the Harmonic markers in the Envelope spectrum window to detect the modulation frequency that is significant | We are using the Harmonic markers in the Envelope spectrum window to detect the modulation frequency that is significant to the defect in the gear box. In our case, we confirm that the frequency at 148.4 Hz is the modulation frequency (Figure 7). | ||
[[Image:Envelope_08.png|framed|none]] | [[Image:Envelope_08.png|framed|none]] | ||
===Step 4: Analysis of the demodulated signal=== | |||
From the envelope signal window we can also detect the two characteristic frequencies previously found (Figure 8): | From the envelope signal window we can also detect the two characteristic frequencies previously found (Figure 8): | ||
[[Image:Envelope_09.png|framed|none | [[Image:Envelope_09.png|framed|none|Figure 8 – Zoom display on the envelope trigger window]] | ||
Revision as of 22:10, 18 June 2020
Using the envelope analysis for roller bearing defect detection.
Objective:
Abnormal vibrations were detected on a speed reducing gear box. We proceeded to diagnose the machine. A default in the roller bearing is suspected. An accelerometer is positioned close to the bearing and connected to the OR3X analyzer.
Necessary equipment:
OROS analyzer with NVgate Software In this example, we are analyzing the time signal file recorded with the analyzer. Office mode of NVGate is used.
Description:
The first step consists of the traditional FFT spectrum analysis of the signal in the complete frequency bandwidth (0-20 kHz).
The zoom analysis is used in the second step. The third step describes the envelope analysis.
Finally, we will also proceed to the analysis of the demodulated signal in the fourth step.
Step 1: Traditional Spectrum Analysis
In a first step, we determine the spectrum obtained from the accelerometer signal. The signal is considered on a frequency band 0-20 kHz.
With the cursor we can detect two resonance domains. The first resonance is detected around 4.3 kHz and the second one around 13.3 kHz.
Step 2: Zoom Analysis
The traditional approach is to use a zoom analysis around 4.3 and 13.3 kHz in our case. In the NVGate software, define the settings of the FFT Zoom by:
- Setting a zoom factor of 16.
- Defining the center frequency of the zoom at 4.3 kHz in a first time. We can also use the drag and drop action to place the center frequency in the averaged spectrum window.
Now the Zoomed averaged spectrum window can be displayed (Figure 3).
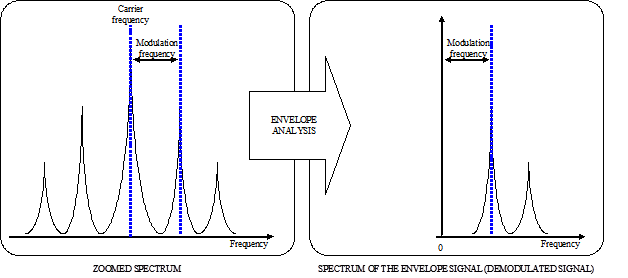
The zoomed spectrum helps us to have a better resolution around the carrier frequency at which the signal is demodulated. For doing this kind of analysis we can use the side band markers. A typical signal spectrum can be seen as it usually has a central frequency line with lower amplitude side lines, as shown on the figure below:
If we see such a spectrum shape then it means we can start the envelope analysis.
In the NVGate software, we use the side band markers in the Zoomed averaged spectrum window to identify the modulation frequency (Figure 5).
We suspect a modulation frequency of 148.4 Hz which exactly corresponds to the value of the inner bearing race defect frequency provided by the manufacturer of the ball bearing.
From the shape of this spectrum we can also see there is a modulation phenomenon. This is why we are going to proceed to the envelop analysis to check the demodulated signal and its spectrum.
Step 3: Envelope Analysis
The envelope mode is activated by choosing a zoom factor (already done in our example) and checking the box "Envelope" (Figure 6).
The Envelop trigger and the Envelope spectrum windows can now be displayed (number 4 of the Figure 6).
'
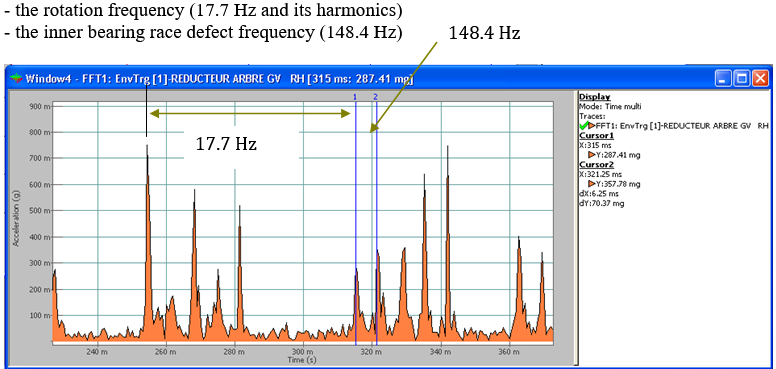
Five shocks per revolution are identified in the Envelope trigger window obtained after the signal demodulation (number 4 of the Figure 6).
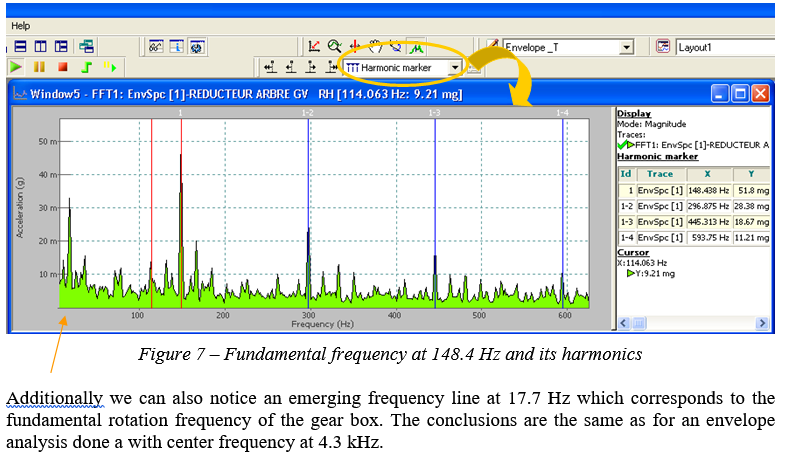
We are using the Harmonic markers in the Envelope spectrum window to detect the modulation frequency that is significant to the defect in the gear box. In our case, we confirm that the frequency at 148.4 Hz is the modulation frequency (Figure 7).
Step 4: Analysis of the demodulated signal
From the envelope signal window we can also detect the two characteristic frequencies previously found (Figure 8):
