Difference between revisions of "NVGate Zoomed signal"
Jump to navigation
Jump to search
m (English edits) |
|||
| (One intermediate revision by one other user not shown) | |||
| Line 3: | Line 3: | ||
[[Image:Display_Graphs_Traces_93.png|framed|none]] | [[Image:Display_Graphs_Traces_93.png|framed|none]] | ||
This kind of zoom can be done by <nowiki>’</nowiki>drag & drop<nowiki>’</nowiki> the selected zone you want to analyze. | This kind of zoom can be done by <nowiki>’</nowiki>drag & drop<nowiki>’</nowiki> to the selected zone you want to analyze. | ||
[[Image:Display_Graphs_Traces_94.png|framed|none]] | [[Image:Display_Graphs_Traces_94.png|framed|none]] | ||
After displaying the zoomed signal, on the recorded signal you can modify your zoom at any time. All | After displaying the zoomed signal, on the recorded signal you can modify your zoom at any time. All changes will be displayed automatically in the zoomed signal as soon as the zoomed zone is modified. | ||
===Check record=== | |||
Check record function is | Check record function is used to '''verify the signal data in detail after acquisition'''. When NVGate records a signal, the save window displays the zoomed signal view of the saved measurement. The signal is displayed after closing the window with OK. | ||
[[Image:V11_release_24.png|framed|none]] | [[Image:V11_release_24.png|framed|none]] | ||
| Line 16: | Line 16: | ||
It is then possible to: | It is then possible to: | ||
* '''Zoom into the signal''' by drag & dropping on the graph | * '''Zoom into the signal''' by drag & dropping on the graph. | ||
* '''Listen to the tracks''' through the PC loudspeaker by clicking on the loudspeaker icon. Select the listened track with the up/down arrows. | * '''Listen to the tracks''' through the PC loudspeaker by clicking on the loudspeaker icon. Select the listened track with the up/down arrows. | ||
Revision as of 20:50, 5 June 2020
Zoomed signal
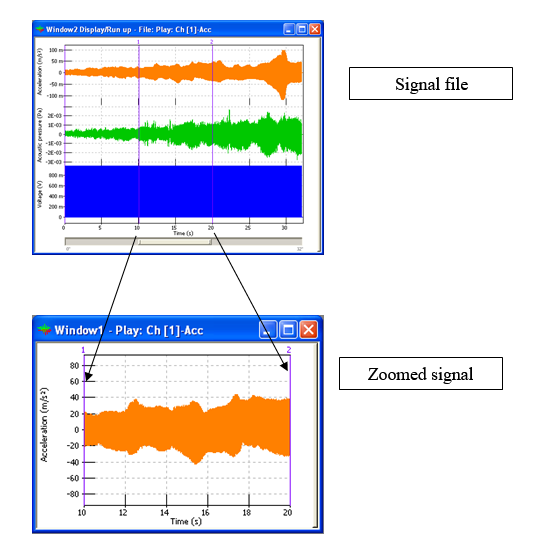
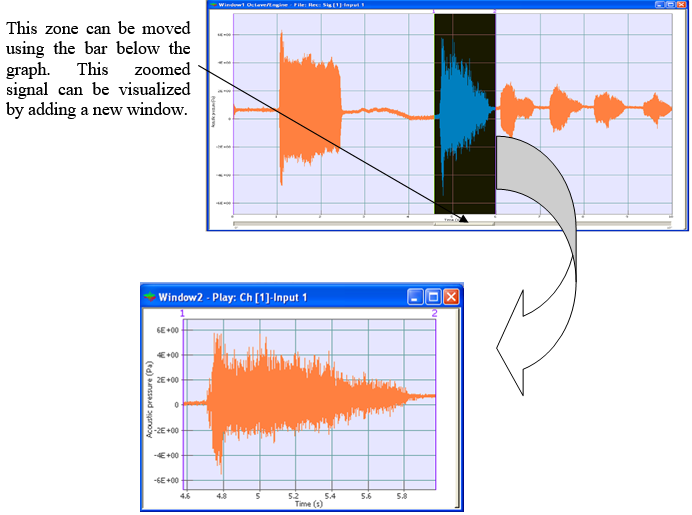
This kind of zoom can be done by ’drag & drop’ to the selected zone you want to analyze.
After displaying the zoomed signal, on the recorded signal you can modify your zoom at any time. All changes will be displayed automatically in the zoomed signal as soon as the zoomed zone is modified.
Check record
Check record function is used to verify the signal data in detail after acquisition. When NVGate records a signal, the save window displays the zoomed signal view of the saved measurement. The signal is displayed after closing the window with OK.
It is then possible to:
- Zoom into the signal by drag & dropping on the graph.
- Listen to the tracks through the PC loudspeaker by clicking on the loudspeaker icon. Select the listened track with the up/down arrows.


