Difference between revisions of "NVGate Player"
(→Player) |
|||
| Line 70: | Line 70: | ||
=====Play-Back on PC speaker===== | =====Play-Back on PC speaker===== | ||
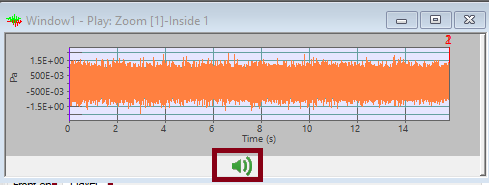
From any of the previous configurations, the recorded signal could be listened on the PC loud speakers. | From any of the previous configurations, the recorded signal could be listened on the PC loud speakers. | ||
[[File:Player_playback.png|none]] | |||
Click on [[Image:Player_connection_wizard_06.png]] in the active window. The button stops the play back at any time. A mobile cursor (blue) localizes the played back signal part in the signal window. | Click on [[Image:Player_connection_wizard_06.png]] in the active window. The button stops the play back at any time. A mobile cursor (blue) localizes the played back signal part in the signal window. | ||
Revision as of 12:45, 28 April 2020
Player
The Player module is used to playback recorded signals that can be computed in post analysis mode. In this way you can re-inject the recorded signals into any plug-in analyzer (Monitor, FFT, 1/n Octave...). It is also possible to play back a recorded signal through the Output during On-line analysis.
There’s several ways to load the recorded signal for post-analysis:
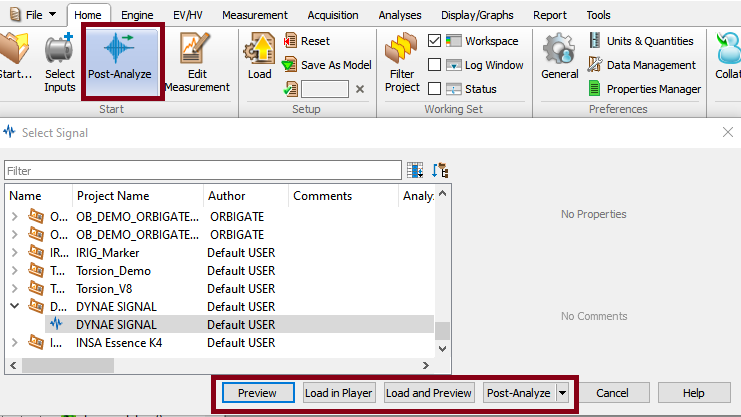
- From the Home tab / Start group, press the Post Analyze button. This will display a selection of signal files available for post-analysis:
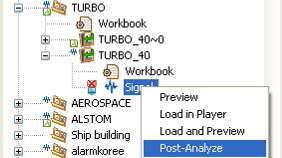
- On project manager, by right clicking on the signal you want to analyze, then you can preview, load, load & preview or Post-Analyze it.
1. Preview let you visualize the recorded signal envelope. Contents of signal files can be visualized in a high-speed preview even if you are manipulating huge file. This new technology allows multiple files preview at the same time. Very large domain record (several Gigabytes) can be previewed in a click, even if the hardware is not connected. Means that the files can be located on the hardware OR3x disk and visualized (not post-analyzed) on the PC without request of downloading, or Hardware connection.
2. Load in player makes your signal available for post-analysis without viewing it.
3. Load & Preview is a combination that let you see the envelope of the recorded signal you are post-analyzing.
4. Post analyze/new is a combination that let you see the envelope of the recorded signal you are post-analyzed, switch to post-analysis and start a new setup menu for post-analysis. (if you are already in post analyse, the curent setup will not be delete)
5. Post analyze/Keep record setup is a combination that let you see the envelope of the recorded signal you are post-analyzed, switch to post-analysis, and keep the setup that you have used during the record signal by replacing dynamical input front the front end inputs to the player tracks. Note: 'if the record setup contains virtual inputs, torsional channels, CAN or DC channels, the connection of these channels to the plug-ins will be reset. The video below explain the post analyse "Keep record setup"
Display
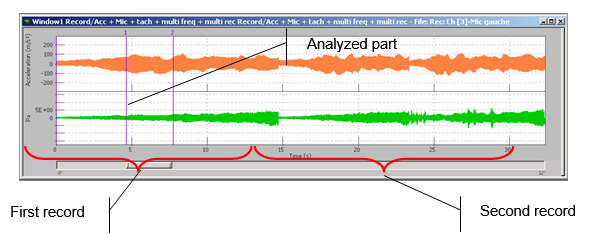
NVGate® proposes 2 different types of windows for post-analysis operation that let you analyze more precisely a part of the signal:
- One for the file overview providing a compressed view of each record.
- The second type is the zoom on the analyzed part (between the start and stop offset cursors).
This operating mode allows an easier navigation inside the recorded domain file to locate the part of interest, and then post-analyze only this selected part.
Available results
| Type | Size | Dimension | Domain | Save |
| Signal File | 2048 compressed pt max | 2D | Compressed time | Display only |
There are 2 modes for the player:
- Post-analysis, the player takes place of the front end; the signal can be analyzed by any plug-ins.
- Play-back on output In connected mode on-line, signals are played on the output (load files in the player and connect tracks to outputs). Note that the Input sampling must be the same as player max bandwidth x 2.56.
Play-Back on PC speaker
From any of the previous configurations, the recorded signal could be listened on the PC loud speakers.
Click on ![]() in the active window. The button stops the play back at any time. A mobile cursor (blue) localizes the played back signal part in the signal window.
in the active window. The button stops the play back at any time. A mobile cursor (blue) localizes the played back signal part in the signal window.
Selected record
This sub-module contains the signal file settings loaded in the Player module.
- Signal file: the name of the measure containing the signal file.
- Record number: defines the record to be processed (if the signal file contains more than 1 record).
- Start offset: the beginning position of the part of signal to analyze or play (0 <= Start Offset < Stop Offset).
- Stop offset: the end position of the part of signal to analyze or play (Start Offset < Stop Offset <= selected record duration).
- Duration: the duration of the selected part of signal between the Start offset and the Stop offset.
Hidden/fixed: Fixed
- Repeat 'mode': On/Off: used to repeat playback of the selected part of the signal indefinitely. The repeat mode is not enabled in post-analysis mode.
Hidden/fixed: Hidden in post analysis mode
- Max bandwidth: contains the list of available frequency bandwidths in the selected signal file. This setting defines the largest frequency bandwidth for all the plug-in analyzers in the post-analysis mode.
Example:
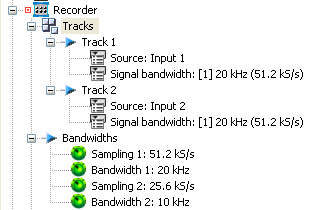
Input 1 and Input 2 are the inputs to be recorded. Input 1 will be recorded with signal bandwidth = 20 kHz and Input 2 with signal bandwidth = 5 kHz.
In post analysis mode, the Player max bandwidth can be selected between 5 kHz and 20 kHz. Then, each Signal bandwidth group can be used in different plug-ins.
| ON-LINE | POST ANALYSIS | |||||
| Recorded file | Player | Plug-in analyzer | ||||
| Signal Bandwidth 1 | Signal Bandwidth 2 | Selected Max Bandwidth |
Plug-in analyzer x | Plug-in analyzer y | ||
| Selected Bandwidth |
Available Input | Selected Bandwidth |
Available Input | |||
| 20 kHz | 5 kHz | 5 kHz | 5 kHz | #1 & #2 |
5 kHz | #1 & #2 |
| 20 kHz | 5 kHz | 20 kHz | 5 kHz | #1& #2 |
20 kHz | Only #1 |
The maximum available bandwidth for a plug-in analyzer depends on the Player max bandwidth selected. Then the inputs available in a plug-in are linked to the plug-in analyzer selected bandwidth. In the example above, the plug-in analyzer y selected bandwidth is 20 kHz. As the Player selected max bandwidth is 20 kHz, the Input 2 (signal bandwidth 2 = 5 kHz) cannot be analyzed at the frequency of 20 kHz.
- Analysis mode: defines how the selected part of signal is analyzed in the post-analysis mode. Hidden/fixed: Visible in post analysis mode
| Analysis mode | Description |
| Continuous | The selected part of the signal is played continuously. |
| Time step | The player switches to pause every "Time step" second. |
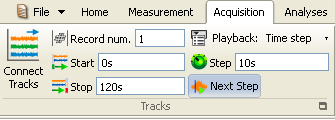
- Time 'step': defines the time step in seconds in the "Time step" analysis mode. The player switches to "pause" every "time step" second. The user must then click on the "Player Continue" button to analyze the next "time step" signal duration.
Hidden/fixed: Visible in the post analysis mode
Tracks
Displays the list of the tracks contained in the selected signal file. The following settings are automatically adjusted at each signal file new selection.
- Label: the name of the input signal recorded. Fixed
- Transducer: the name of the transducer used during recording.
- Physical qty.: the unit of the input signal selected during recording.
- Sensitivity: the sensitivity of the transducer.
- Range peak: the input range peak in the transducer SI unit. Fixed
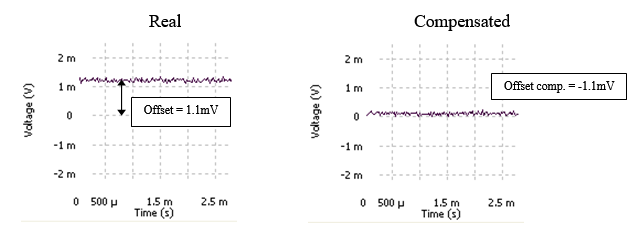
- Offset comp.: the input offset compensation in Volts.
- Coupling: the input coupling. Fixed
- Signal bandwidth: the equivalent signal frequency bandwidth and the corresponding sampling frequency (for example: 20 kHz (51.2 kS/s).
The player tracks can be connected to a plug-in analyzer in the Post-analysis mode or to the Front-end output in Connected mode on line. Fixed
