Difference between revisions of "NVGate Display"
(→Time) |
|||
| (39 intermediate revisions by one other user not shown) | |||
| Line 1: | Line 1: | ||
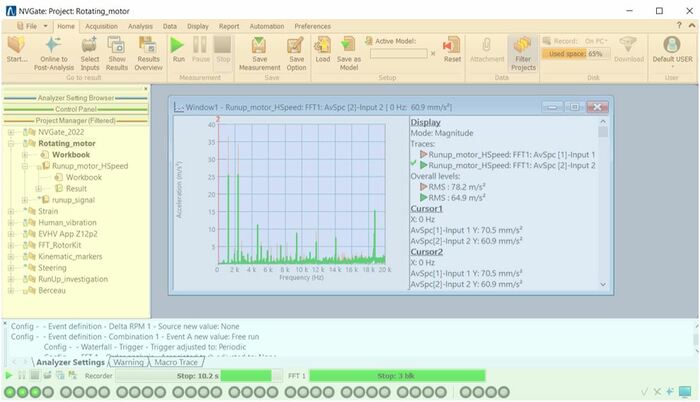
This section explains all the functions and information you can find in the graphs, windows and infotrace. It contains also the information relative to the scales, graphic modes, display modes and the contextual menus. | |||
Different windows which contain one or more graphs or traces can be created using the [[NVGate_GoToResult#Step_2_Show_results|''Results'' dialog]] or the [[NVGate_Ribbons:_Display/Graph_Tab#Add.2Fremove_window|''Add/remove window'' dialog]]. You can also add or remove some information in the Infotrace using the Infotrace properties. Manage all the display settings using the right click in almost any area. For each result type there are different available options using the right click. | |||
[[File:Window_display_2022.JPG|700px]] | |||
[[File: | |||
<Youtube>https://www.youtube.com/watch?v=CuUHne-GEVQ</Youtube> | <Youtube>https://www.youtube.com/watch?v=CuUHne-GEVQ</Youtube> | ||
| Line 29: | Line 10: | ||
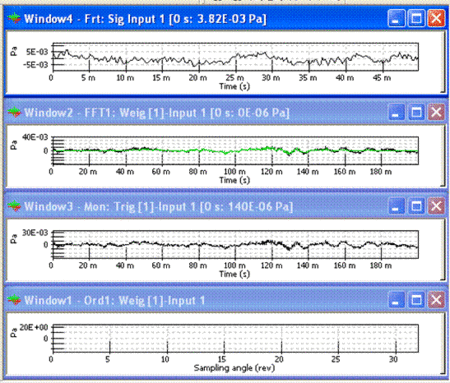
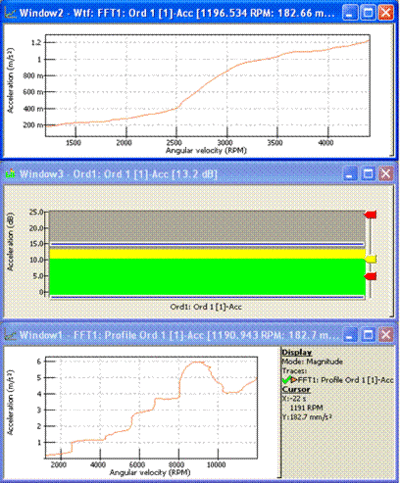
The windows allow to display signal traces. They can contain several traces in the same graph (multi-trace display) or several graphs (multi-graph display). The windows can display 1D graphs (viewmeter, RPM monitoring), 2D graphs (profiles, signal recording) or 3D graphs such as Waterfall display. | The windows allow to display signal traces. They can contain several traces in the same graph (multi-trace display) or several graphs (multi-graph display). The windows can display 1D graphs (viewmeter, RPM monitoring), 2D graphs (profiles, signal recording) or 3D graphs such as Waterfall display. | ||
===Interface overview=== | |||
===== | <div style="position: relative">[[File:Interface_overview.JPG|700px]] | ||
<div style="position: absolute; left: 520px; top: 40px">[[File:text_ribbon.png|150px]]</div> | |||
<div style="position: absolute; left: 30px; top: 180px">[[File:Text_workspace.png|100px]]</div> | |||
<div style="position: absolute; left: 500px; top: 200px">[[File:Text_windows.png|180px]]</div> | |||
<div style="position: absolute; left: 500px; top: 330px">[[File:Text_log_window.png|100px]]</div> | |||
<div style="position: absolute; left: 550px; top: 370px">[[File:Text_status_bar.png|100px]]</div> | |||
</div> | |||
</div> | |||
===Infotrace=== | |||
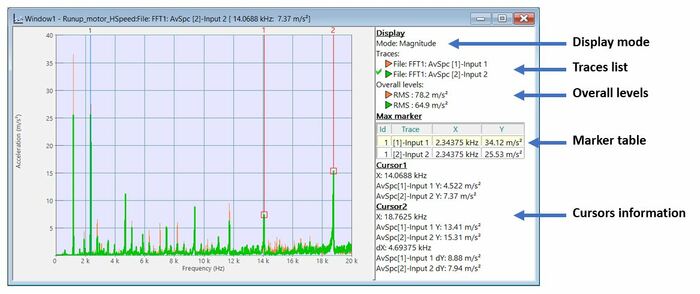
The infotrace displays information about the graph: | |||
* '''Graph mode:''' magnitude, real... | * '''Graph mode:''' magnitude, real... | ||
| Line 41: | Line 29: | ||
* '''Overall levels:''' Displays the RMS level in 2D windows containing spectra or time signals. | * '''Overall levels:''' Displays the RMS level in 2D windows containing spectra or time signals. | ||
* '''Cursor information:''' x, y, order, dx, dy if available | * '''Cursor information:''' x, y, order, dx, dy if available | ||
* '''Marker arrays''' | * '''Marker arrays:''' Using keyboard arrows, you can select the active trace in the infotrace. | ||
Using keyboard arrows, you can select the active trace in the infotrace. | |||
[[ | [[File:Infotrace_2022.JPG|700px]] | ||
====Traces names==== | |||
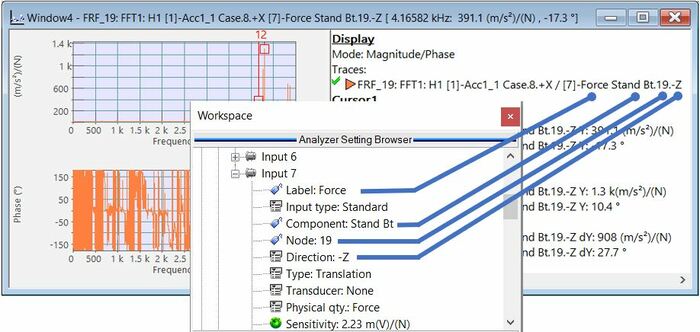
The traces names indicate accurately what signal is displayed. A trace label consists of: | The traces names indicate accurately what signal is displayed. A trace label consists of: | ||
| Line 104: | Line 90: | ||
In order to simplify the trace identifications in applications that manage many measurement points (structural dynamics, Roving impact hammer) the content of the front-end identification settings are inserted in the trace labels. | In order to simplify the trace identifications in applications that manage many measurement points (structural dynamics, Roving impact hammer) the content of the front-end identification settings are inserted in the trace labels. | ||
[[ | [[File:Trace_name_2022.JPG|700px]] | ||
The trace labels display the ''Component'', ''Node'' and ''Direction'' when the corresponding setting is different from its default value: | The trace labels display the ''Component'', ''Node'' and ''Direction'' when the corresponding setting is different from its default value: | ||
| Line 113: | Line 99: | ||
This applies individually, setting by setting and is independent for each channel. | This applies individually, setting by setting and is independent for each channel. | ||
===== | ====Contextual menu==== | ||
The infotrace contextual menu is accessible by right clicking on the infotrace. | |||
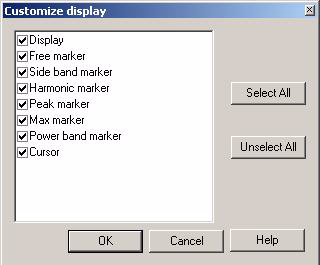
'''Customize''': From the Infotrace, right click and select Customize. | |||
From the Infotrace, right click and select Customize. | |||
[[Image:Display_Graphs_Traces_23.png|framed|none]] | [[Image:Display_Graphs_Traces_23.png|framed|none]] | ||
| Line 170: | Line 116: | ||
* '''Cancel:''' ignores the changes and closes the dialog box. | * '''Cancel:''' ignores the changes and closes the dialog box. | ||
'''Auto width:''' Sets the Infotrace area width to the width of the largest element currently displayed. | |||
Sets the Infotrace area width to the width of the largest element currently displayed. | |||
'''Copy marker table:''' Copies the marker table content to the clipboard in Excel format, in order to paste it in Excel. Each column/line of the table becomes a column/line in the Excel sheet. | |||
Copies the marker table content to the clipboard in Excel format, in order to paste it in Excel. Each column/line of the table becomes a column/line in the Excel sheet. | |||
See the "Copy marker" topic p 101 for more details about the marker table copy. | See the "Copy marker" topic p 101 for more details about the marker table copy. | ||
'''Close:''' Hides the Infotrace area. | |||
===Graph=== | |||
A graph displays computed traces. It can be multi-trace or multi-graph. | |||
==== | ====Graph type==== | ||
=====Time ===== | |||
==== | |||
=== | |||
=== | |||
Time graphs display time real signals. | Time graphs display time real signals. | ||
| Line 528: | Line 163: | ||
:: The 0 value if the Y scale is linear. | :: The 0 value if the Y scale is linear. | ||
====Spectral ==== | =====Spectral ===== | ||
Spectral graphs display narrow band (complex) spectra. | Spectral graphs display narrow band (complex) spectra. | ||
'''Source Signals'''<br> | |||
The following results may be displayed as spectral graphs: | The following results may be displayed as spectral graphs: | ||
| Line 538: | Line 173: | ||
* Sync. order x: Ord. inst. spectrum, Ord. avg. spectrum, Ord. spectrum. | * Sync. order x: Ord. inst. spectrum, Ord. avg. spectrum, Ord. spectrum. | ||
[[Image:Display_Graphs_Traces_79.gif| | [[Image:Display_Graphs_Traces_79.gif|450px|none]] | ||
'''Properties'''<br> | |||
[[Image:Display_Graphs_Traces_80.png|450px|none]] | |||
* '''X Axis:''' | |||
:-'''Linear:''' uses linear scale for X-axis units. | |||
:-'''Logarithmic:''' uses logarithmic scale for X-axis units. | |||
* '''Y Axis:''' | |||
:-'''Linear: uses linear scale for Y-axis units. | |||
:-'''Logarithmic: uses logarithmic scale for Y-axis units. | |||
* '''dB:''' uses reference dB scale for Y-axis units. | |||
* '''Display mode''' | |||
:-'''Magnitude:''' overlays all magnitude traces on a single graph. | |||
:-'''Phase:''' overlays all phase traces on a single graph. | |||
:-'''Real part:''' overlays all real parts traces on a single graph. | |||
:-'''Imaginary part:''' overlays all imaginary part traces on a single graph. | |||
:-'''Magnitude/phase:''' overlays all magnitude traces on the upper graph and all the phase traces on the lower graph. | |||
:-'''Real/imaginary:''' overlays all magnitude traces on the upper graph and all the phase traces on the lower graph. | |||
:-'''Polar:''' overlays all complex traces on a polar graph: = magnitude, = phase. | |||
:-'''Real part 3D:''' displays all real part traces as a 3D graph arranged along the Z-axis. | |||
:-'''Imaginary part 3D:''' displays all imaginary part traces as a 3D graph arranged along the Z-axis. | |||
:-'''Magnitude 3D:''' displays all magnitude traces as a 3D graph arranged along the Z-axis. | |||
:-'''Phase 3D:''' displays all phase traces as a 3D graph arranged along the Z-axis. | |||
:-'''Real part multi-graph:''' displays all real part traces using one graph per trace in the same window. | |||
:-'''Imaginary part multi-graph:''' displays all imaginary part traces using one graph per trace in the same window. | |||
:-'''Magnitude multi-graph:''' displays all magnitude traces using one graph per trace in the same window. | |||
:-'''Phase multi-graph:''' displays all phase traces using one graph per trace in the same window. | |||
:-'''Phase/Magnitude:''' overlays all phase traces on the upper graph using 1/3 of window space and all the magnitude traces on the lower graph using 2/3 of the window. | |||
:-'''Merged Magnitude/Phase:''' displays all magnitude and phase part traces as a unique graph. | |||
:-'''Magnitude gathering:''' if this mode is activated and when a multi-trace mode is selected, an area is created for each different Y magnitude: all the signals with the same Y magnitude are in the same area. If there is only one different Y magnitude, all the signals are in the same area. | |||
* | * '''Trace color:''' | ||
:-'''Number:''' selects the trace number for color modification. | |||
:-'''Color box:''' click on this box to modify the color of the selected trace. | |||
:-'''Filling mode:''' if selected, all the curves of the windows are filled from: | |||
::the bottom of the area if Y scale is a dB one or Logarithmic one, | |||
::the 0 value of the Y scale is linear. | |||
* '''Dynamics:''' | |||
:-'''90 dB:''' resizes the Y-axis to 90 dB dynamics starting from <nowiki>+</nowiki>20 dBV. | |||
:-'''110 dB:''' resizes the Y-axis to 110 dB dynamics starting from <nowiki>+</nowiki>20 dBV. | |||
:-'''130 dB:''' resizes the Y-axis to 130 dB dynamics starting from <nowiki>+</nowiki>20 dBV. | |||
:-'''150 dB:''' resizes the Y-axis to 150 dB dynamics starting from <nowiki>+</nowiki>20 dBV. | |||
* Dynamics | |||
Phase | * '''Phase:''' | ||
:-''' -180° -<nowiki>></nowiki> 180°:''' sets the phase graph Y-axis between –180° to <nowiki>+</nowiki>180°. | |||
[[Image:Display_Graphs_Traces_81.png|400px|none]] | |||
:-'''0 -<nowiki>></nowiki> 360°:''' sets the phase graph Y-axis between 0 to <nowiki>+</nowiki>360°. | |||
[[Image:Display_Graphs_Traces_82.png|400px|none]] | |||
* '''Rotations:''' sets the number of rotations to be displayed on the Y-axis. | |||
[[Image:Display_Graphs_Traces_84.png|400px|none]] | |||
=====Lissajous===== | |||
====Lissajous ==== | |||
Parametric graph of one triggered block with another one for reference. | Parametric graph of one triggered block with another one for reference. | ||
'''Source Signals'''<br> | |||
The following results may be displayed into Lissajous graphs: | The following results may be displayed into Lissajous graphs: | ||
* FFT x: Lissajous. | * '''FFT x: Lissajous'''. | ||
<font color="#FF0000"> | <font color="#FF0000"> | ||
[[Image:Display_Graphs_Traces_85.png|framed|none]] | [[Image:Display_Graphs_Traces_85.png|framed|none]] | ||
| Line 619: | Line 245: | ||
You can use filters on this kind of graph, as integration or a double integration. | You can use filters on this kind of graph, as integration or a double integration. | ||
'''Properties'''<br> | |||
[[Image:Display_Graphs_Traces_86.png|framed|none]] | [[Image:Display_Graphs_Traces_86.png|framed|none]] | ||
* X Axis | * '''X Axis:''' | ||
:-'''Linear:''' uses linear scale for X-axis units. | |||
* Y Axis | * '''Y Axis:''' | ||
:-'''Linear:''' uses linear scale for Y-axis units. | |||
* Display mode | * '''Display mode:''' | ||
:-'''Multi-trace:''' overlays all traces on a single graph. | |||
* Trace color | * '''Trace color:''' | ||
:-'''Number:''' selects the trace number for color modification. | |||
:-'''Color box:''' click on this box to modify the color of the selected trace. | |||
:-'''Orthonormal view:''' if checked, the graph is displayed in an orthonormal area. | |||
---- | ---- | ||
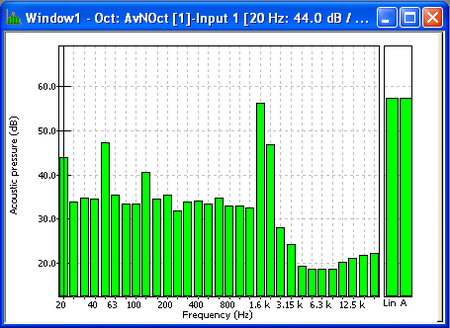
====Nth octave==== | =====Nth octave===== | ||
Displays nth octave band graph. | Displays nth octave band graph. | ||
'''Source Signals'''<br> | |||
The following results may be displayed as nth octave graphs: | The following results may be displayed as nth octave graphs: | ||
* Nth-Octave: 1/n octave, Avg 1/n octave. | * Nth-Octave: 1/n octave, Avg 1/n octave. | ||
[[Image:Display_Graphs_Traces_87.png| | [[Image:Display_Graphs_Traces_87.png|450px|none]] | ||
'''Properties'''<br> | |||
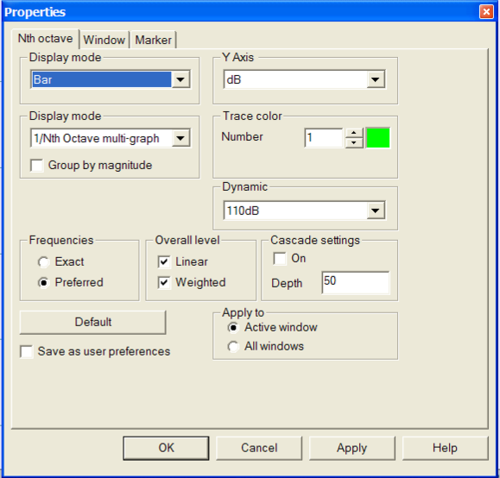
[[Image:Display_Graphs_Traces_88.png|500px|none]] | [[Image:Display_Graphs_Traces_88.png|500px|none]] | ||
* Y Axis | *'''Y Axis:''' | ||
:-'''Linear:''' uses linear scale for Y-axis units. | |||
:-'''Logarithmic:''' uses logarithmic scale for Y-axis units. | |||
:-'''dB:''' uses reference dB scale for Y axis units. | |||
* Display mode | *'''Display mode''' | ||
:-'''Bar:''' bar representation | |||
:-'''Step:''' step representation | |||
:-'''Rectangle:''' overlaid rectangle | |||
:-'''Filled:''' overlaid filled rectangles. | |||
* Display mode | *'''Display mode''' | ||
:-'''Multi-trace:''' overlays all traces on a single graph. | |||
:-'''Multi-graph:''' one graph for each trace. | |||
:-'''Magnitude gathering:''' if this mode is activated and when a multi-trace mode is selected, an area is created for each different Y magnitude: all the signals with the same Y magnitude are in the same area. If there is only one different Y magnitude, all the signals are in the same area. | |||
* Trace color | *'''Trace color''' | ||
:-'''Number:''' selects the trace number for color modification. | |||
:-'''Color box:''' click on this box to modify the color of the selected trace. | |||
* Overall level | *'''Overall level''' | ||
:-'''Linear:''' if checked, the linear global level is displayed. | |||
:-'''Weighted:''' if checked and available, the weighted level is displayed. | |||
* Frequencies | * '''Frequencies:''' | ||
:-'''Exact:''' displays exact band center frequency. | |||
:-'''Preferred:''' displays preferred frequencies, i.e rounded values for the central frequencies. Preferred frequencies are only available for octave and 1/3rd octave windows: in the octave. If this mode is selected in 12th and 24th octave windows, exact frequencies are displayed. | |||
* Dynamics | * '''Dynamics:''' | ||
:-'''90 dB:''' resizes the Y-axis to 90 dB dynamics starting from <nowiki>+</nowiki>20 dBV. | |||
:-'''110 dB:''' resizes the Y-axis to 110 dB dynamics starting from <nowiki>+</nowiki>20 dBV. | |||
:-'''130 dB:''' resizes the Y-axis to 130 dB dynamics starting from <nowiki>+</nowiki>20 dBV. | |||
:-'''150 dB:''' resizes the Y-axis to 150 dB dynamics starting from <nowiki>+</nowiki>20 dBV. | |||
---- | ---- | ||
====Viewmeter==== | =====Viewmeter===== | ||
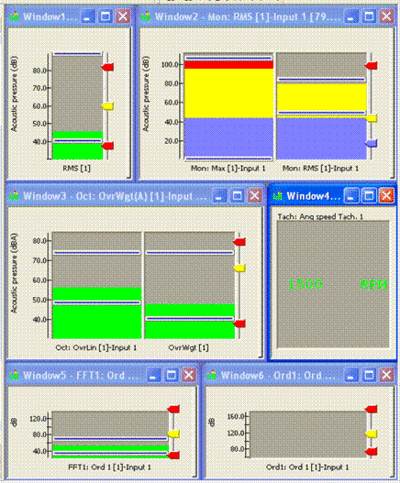
Displays scalar value graphs. | Displays scalar value graphs. | ||
'''Source Signals'''<br> | |||
The following results may be displayed as nth viewmeter graphs: | The following results may be displayed as nth viewmeter graphs: | ||
| Line 694: | Line 320: | ||
* Tachometer: Angular speed | * Tachometer: Angular speed | ||
[[Image:Display_Graphs_Traces_89.gif| | [[Image:Display_Graphs_Traces_89.gif|400px|none]] | ||
'''Properties'''<br> | |||
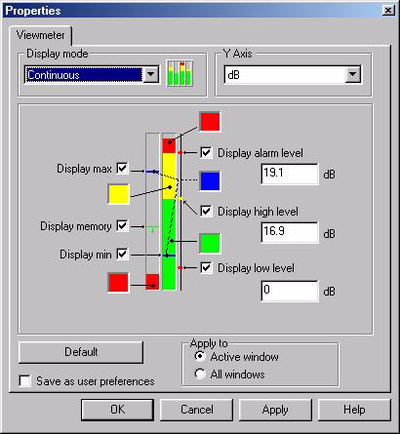
This page defines the way in which the scalar results are displayed. | This page defines the way in which the scalar results are displayed. | ||
[[Image:Display_Graphs_Traces_90.png| | [[Image:Display_Graphs_Traces_90.png|400px|none]] | ||
* Display mode: There are two types of display: | * '''Display mode:''' There are two types of display: | ||
:-'''Bar graph:''' | |||
[[Image:Display_Graphs_Traces_04-display.png| | [[Image:Display_Graphs_Traces_04-display.png|400px|none]] | ||
:-'''Digital display''' | |||
* Y Axis | * '''Y Axis:''' | ||
:-'''Linear:''' uses linear scale for Y-axis units. | |||
:-'''Logarithmic:''' uses logarithmic scale for Y-axis units. | |||
:-'''dB:''' uses reference dB scale for Y-axis units. | |||
* Display max, Display min: Displays the min and the max scalar value as a cursor. The color of the cursor can be freely selected. This property only applies to bar graphs. | * '''Display max, Display min:''' Displays the min and the max scalar value as a cursor. The color of the cursor can be freely selected. This property only applies to bar graphs. | ||
* Display low level: Changes the color of the display when the value is below this level. The color can be freely selected. | * '''Display low level:''' Changes the color of the display when the value is below this level. The color can be freely selected. | ||
* Display high level: Changes the color of the display when the value is higher than this level. The color can be freely selected. | * '''Display high level:''' Changes the color of the display when the value is higher than this level. The color can be freely selected. | ||
* Display alarm level: Changes the color of the display when the value is higher than this level. The color can be freely selected. | * '''Display alarm level:''' Changes the color of the display when the value is higher than this level. The color can be freely selected. | ||
* Brick height: Defines the height of the bricks for the viewmeter and brick display modes. | * '''Brick height:''' Defines the height of the bricks for the viewmeter and brick display modes. | ||
* Save as user preference: When this box is checked, the value is given as a percentage of the full scale, and may be applied to any graph. | * '''Save as user preference:''' When this box is checked, the value is given as a percentage of the full scale, and may be applied to any graph. | ||
=====Monitoring===== | |||
====Monitoring==== | |||
Displays compressed signal graph during recording. | Displays compressed signal graph during recording. | ||
'''Source Signals'''<br> | |||
The following results may be displayed as nth monitoring graphs: | The following results may be displayed as nth monitoring graphs: | ||
* Recorder: monitoring signal | * Recorder: monitoring signal | ||
[[Image:Display_Graphs_Traces_91.png| | [[Image:Display_Graphs_Traces_91.png|400px|none]] | ||
'''Properties'''<br> | |||
[[Image:Display_Graphs_Traces_92.png| | [[Image:Display_Graphs_Traces_92.png|500px|none]] | ||
* Trace color | * '''Trace color''' | ||
:-'''Number:''' selects the trace number for color modification. | |||
:-'''Color box:''' click on this box to modify the color of the selected trace. | |||
* X Axis | * '''X Axis''' | ||
:-'''Absolute time:''' displays the time from windows format. | |||
:-'''Relative time:''' displays the duration of the record. The beginning of the record is set to 0. | |||
:-'''Auto:''' selects absolute or relative time depending on the duration of the record. For records smaller than 2s, the relative time is displayed, for others, the absolute time is chosen. | |||
* Y Autoscale | * '''Y Autoscale:''' | ||
:-'''Continuous:''' the Y scale is automatically adjusted to the current min and max y values of the window traces with a margin to facilitate visibility. | |||
:-'''Disabled:''' Y autoscale is not activated. | |||
====Compressed signal==== | =====Compressed signal===== | ||
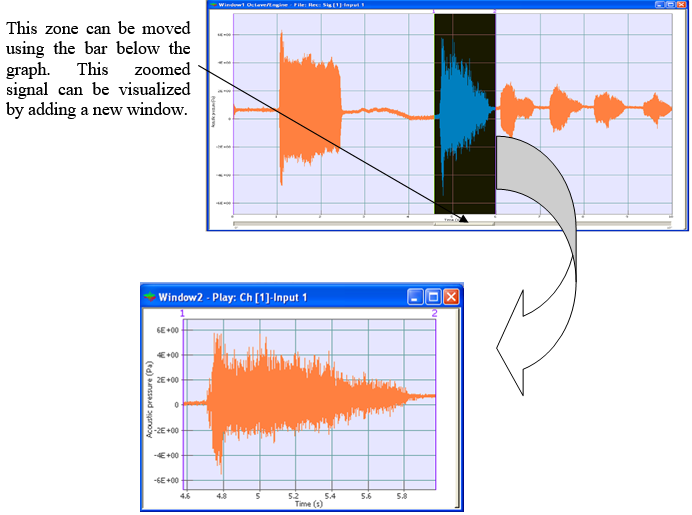
Displays compressed recorded signal graphs. | Displays compressed recorded signal graphs. | ||
'''Source Signals'''<br> | |||
The following results may be displayed as nth compressed signal graphs: | The following results may be displayed as nth compressed signal graphs: | ||
| Line 768: | Line 389: | ||
After displaying the zoomed signal, on the recorded signal you can modify your zoom at any time. All changes would be displayed automatically in the zoomed signal as soon as you modified your zoomed zone. | After displaying the zoomed signal, on the recorded signal you can modify your zoom at any time. All changes would be displayed automatically in the zoomed signal as soon as you modified your zoomed zone. | ||
'''Check record'''<br> | |||
Check record function is for '''verifying the signal data in details just after its acquisition'''. When NVGate records a signal, the save window proposes to display the zoom signal view of the saved measurement. The signal is displayed after closing the window with OK. | Check record function is for '''verifying the signal data in details just after its acquisition'''. When NVGate records a signal, the save window proposes to display the zoom signal view of the saved measurement. The signal is displayed after closing the window with OK. | ||
| Line 778: | Line 399: | ||
* '''Listen to the tracks''' through the PC loudspeaker by clicking on the loudspeaker icon. Select the listened track with the up/down arrows. | * '''Listen to the tracks''' through the PC loudspeaker by clicking on the loudspeaker icon. Select the listened track with the up/down arrows. | ||
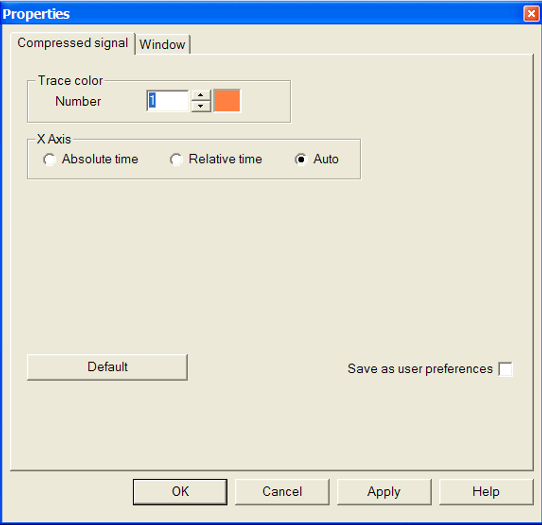
'''Properties''' | |||
[[Image:Display_Graphs_Traces_95.png|framed|none]] | [[Image:Display_Graphs_Traces_95.png|framed|none]] | ||
| Line 791: | Line 412: | ||
:- '''Auto''': selects absolute or relative time depending on the duration of the record. For records smaller than 2s, the relative time is displayed, for others, the absolute time is chosen. | :- '''Auto''': selects absolute or relative time depending on the duration of the record. For records smaller than 2s, the relative time is displayed, for others, the absolute time is chosen. | ||
====Profile==== | =====Profile===== | ||
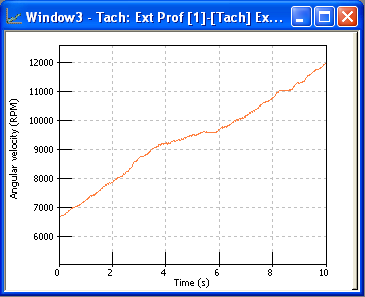
Displays scalar profile. | Displays scalar profile. | ||
'''Source Signals'''<br> | |||
The following results may be displayed as nth compressed signal graphs: | The following results may be displayed as nth compressed signal graphs: | ||
| Line 804: | Line 425: | ||
* Tachometer: RPM | * Tachometer: RPM | ||
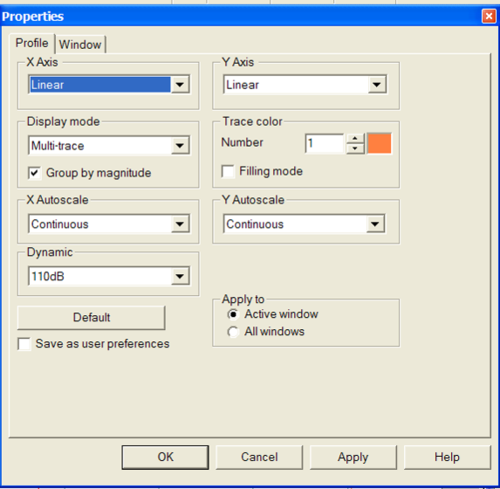
'''Properties'''<br> | |||
[[Image:Display_Graphs_Traces_100.png|500px|none]] | [[Image:Display_Graphs_Traces_100.png|500px|none]] | ||
| Line 833: | Line 452: | ||
:-'''Disabled:''' Y autoscale is not activated. | :-'''Disabled:''' Y autoscale is not activated. | ||
====Complex profile==== | =====Complex profile===== | ||
'''Source Signals'''<br> | |||
The following results may be displayed as complex profile graphs: | The following results may be displayed as complex profile graphs: | ||
| Line 841: | Line 460: | ||
* SOA X: Order profile | * SOA X: Order profile | ||
[[Image:Display_Graphs_Traces_101.gif| | [[Image:Display_Graphs_Traces_101.gif|400px|none]] | ||
'''Properties'''<br> | |||
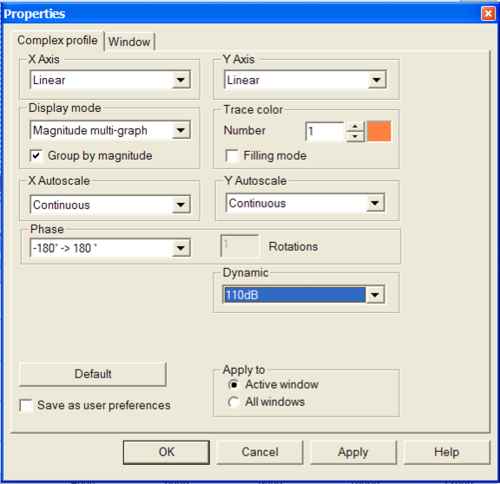
[[Image:Display_Graphs_Traces_102.png|500px|none]] | |||
* '''X Axis:''' | |||
:-'''Linear:''' uses linear scale for X-axis units. | |||
*'''Y Axis:''' | |||
:-'''Linear:''' uses linear scale for Y-axis units. | |||
:-'''Logarithmic:''' uses logarithmic scale for Y-axis units. | |||
:-'''dB:''' uses reference dB scale for Y axis units. | |||
*'''Display mode:''' | |||
:-'''Magnitude:''' overlays all magnitude traces on a single graph. | |||
:-'''Phase:''' overlays all phase traces on a single graph. | |||
:-'''Real part:''' overlays all real part traces on a single graph. | |||
:-'''Imaginary part:''' overlays all imaginary part traces on a single graph. | |||
:-'''Magnitude/phase:''' overlays all magnitude traces on the upper graph and all phase traces on the lower graph. | |||
:-'''Real/imaginary:''' overlays all magnitude traces on the upper graph and all phase traces on the lower graph. | |||
:-'''Polar:''' displays in polar coordinates, the phase and the amplitude on a single graph. | |||
:-'''Real part multi-graph:''' displays all real part traces using one graph per trace in the same window. | |||
:-'''Imaginary part multi-graph:''' displays all imaginary part traces using one graph per trace in the same window. | |||
:-'''Magnitude multi-graph:''' displays all magnitude traces using one graph per trace in the same window. | |||
:-'''Phase multi-graph:''' displays all phase traces using one graph per trace in the same window. | |||
:-'''Phase/Magnitude:''' overlays all phase traces on the upper graph using 1/3 of window space and all the magnitude traces on the lower graph using 2/3 of the window. | |||
:-'''Merged Magnitude/Phase:''' displays all magnitude and phase parts traces on a single graph. | |||
:-'''Magnitude gathering:''' if this mode is activated and when a multi-trace mode is selected, an area is created for each different Y magnitude: all the signals with the same Y magnitude are in the same area. If there is only one different Y magnitude, all the signals are in the same area. | |||
*'''Trace color:''' | |||
:-'''Number:''' selects the trace number for color modification. | |||
:-'''Color box:''' click on this box to modify the color of the selected trace. | |||
:-'''Filling mode:''' if selected, all the curves of the windows are filled from: | |||
::The 0 value if the Y scale is linear. | |||
*'''Dynamics:''' | |||
:-'''90 dB:''' resizes the Y-axis to 90 dB dynamics starting from <nowiki>+</nowiki>20 dBV. | |||
:-'''110 dB:''' resizes the Y-axis to 110 dB dynamics starting from <nowiki>+</nowiki>20 dBV. | |||
:-'''130 dB:''' resizes the Y-axis to 130 dB dynamics starting from <nowiki>+</nowiki>20 dBV. | |||
:-'''150 dB:''' resizes the Y-axis to 150 dB dynamics starting from <nowiki>+</nowiki>20 dBV. | |||
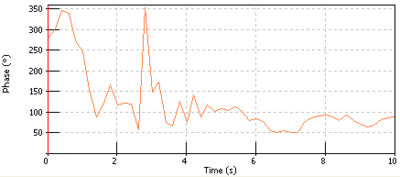
*'''Phase:''' | |||
:-'''-180° -<nowiki>></nowiki> 180°:''' sets the phase graph Y-axis between –180° to <nowiki>+</nowiki>180°. | |||
[[Image:Display_Graphs_Traces_103.png|400px|none]] | |||
:-'''0 -<nowiki>></nowiki> 360°: sets the phase graph Y-axis between 0 to <nowiki>+</nowiki>360°. | |||
[[Image:Display_Graphs_Traces_104.png|400px|none]] | |||
:-'''Rotations:''' sets the number of rotations to be displayed on the Y-axis. Example for 5 rotations: | |||
[[Image:Display_Graphs_Traces_106.png|400px|none]] | |||
[[Image: | |||
* '''X Autoscale:''' | |||
:-'''Continuous:''' the X scale is automatically adjusted to the current min and max x values of the window traces. | |||
:-'''Disabled:''' X autoscale is not activated. | |||
* '''Y Autoscale:''' | |||
:-'''Continuous:''' the Y scale is automatically adjusted to the current min and max y values of the window traces with a margin to facilitate visibility. | |||
* | :-'''Disabled:''' Y autoscale is not activated. | ||
---- | ---- | ||
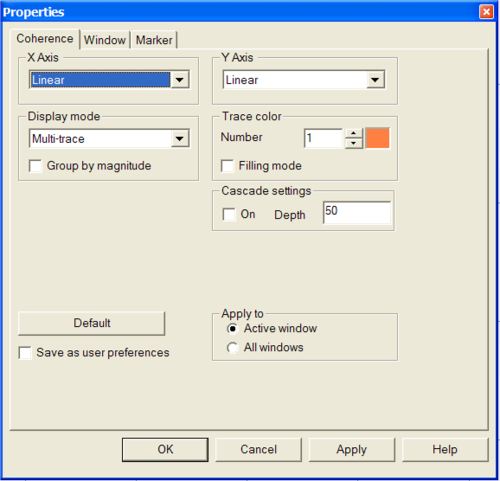
====Coherence==== | =====Coherence===== | ||
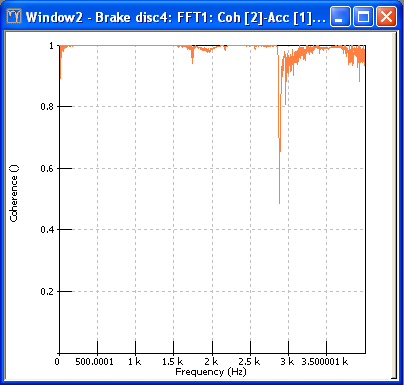
Displays coherence graphs. | Displays coherence graphs. | ||
'''Source Signals:'''<br> | |||
The following results may be displayed as coherence graphs: | The following results may be displayed as coherence graphs: | ||
| Line 918: | Line 530: | ||
[[Image:Display_Graphs_Traces_107.png|framed|none]] | [[Image:Display_Graphs_Traces_107.png|framed|none]] | ||
'''Properties'''<br> | |||
[[Image:Display_Graphs_Traces_108.png| | [[Image:Display_Graphs_Traces_108.png|500px|none]] | ||
* X Axis | *'''X Axis:''' | ||
* Linear: uses linear scale for X-axis units. | * Linear: uses linear scale for X-axis units. | ||
* Y Axis | *'''Y Axis:''' | ||
:-'''Linear:''' uses linear scale for Y-axis units. | |||
* Display mode | *'''Display mode:''' | ||
:-'''Multi-graph:''' overlays all traces on a single graph. | |||
:-'''Multi-trace:''' displays all traces using one graph per trace in the same window. | |||
:-'''Time multi-trace 3D:''' overlays all traces on a single 3D graph. | |||
:-'''Magnitude gathering:''' if this mode is activated and when a multi-trace mode is selected, an area is created for each different Y magnitude: all the signals with the same Y magnitude are in the same area. If there is only one different Y magnitude, all the signals are in the same area. | |||
* Trace color | *'''Trace color:''' | ||
:-'''Number:''' selects the trace number for color modification. | |||
:-'''Color box:''' click on this box to modify the color of the selected trace. | |||
:-'''Filling mode:''' if selected, all the curves of the windows are filled from: | |||
::the bottom of the area if Y scale is dB or Logarithmic, | |||
::the 0 value if the Y scale is linear. | |||
====Shaft View==== | =====Shaft View===== | ||
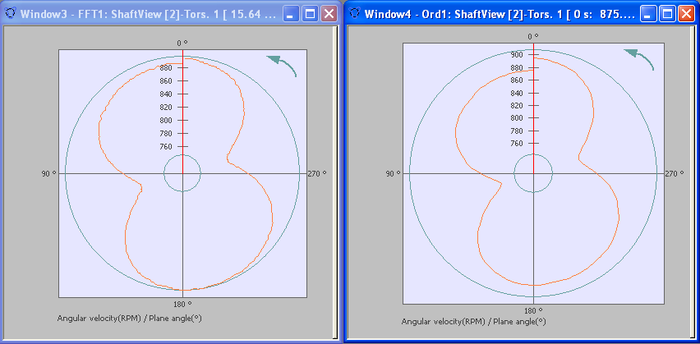
The shaft view or "marguerite" shows the trigger block of FFTs and SOA around one revolution. This graph includes angular cursors (with delta-angle) useful for reading the location of peaks. | The shaft view or "marguerite" shows the trigger block of FFTs and SOA around one revolution. This graph includes angular cursors (with delta-angle) useful for reading the location of peaks. | ||
| Line 953: | Line 565: | ||
All graphs in a window have the same rotation and keyphasor location. | All graphs in a window have the same rotation and keyphasor location. | ||
'''Source Signals'''<br> | |||
The following results may be displayed as Triggered Shaft View graphs on condition that a tachometer is associated to the plug-in: | The following results may be displayed as Triggered Shaft View graphs on condition that a tachometer is associated to the plug-in: | ||
| Line 967: | Line 579: | ||
* SOA x: Average Shaft View | * SOA x: Average Shaft View | ||
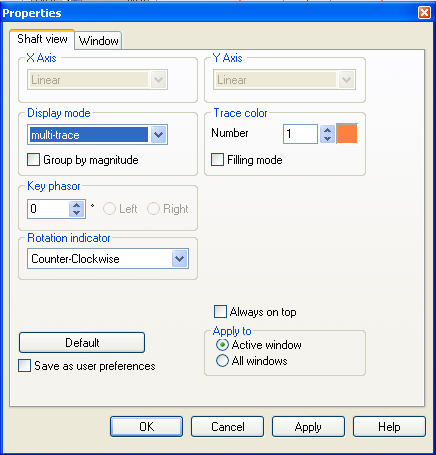
'''Properties'''<br> | |||
[[Image:Display_Graphs_Traces_111.png|framed|none]] | [[Image:Display_Graphs_Traces_111.png|framed|none]] | ||
* X Axis | * '''X Axis:''' | ||
:-'''Linear:''' uses linear scale for X-axis units. | |||
* Y Axis | * '''Y Axis:''' | ||
:-'''Linear:''' uses linear scale for Y-axis units. | |||
* Display mode | * '''Display mode:''' | ||
:-'''Multi-graph:''' overlays all traces on a single graph. | |||
:-'''Multi-trace:''' displays all traces using one graph per trace in the same window. | |||
* Trace color | * '''Trace color:''' | ||
:-'''Number:''' selects the trace number for color modification. | |||
:-'''Color box:''' click on this box to modify the color of the selected trace. | |||
:-'''Filling mode:''' if selected, all the curves of the windows are filled from: | |||
::the 0 value if the Y scale is linear. | |||
* '''Key phasor:''' Allows to specify the position of the key phasor by entering the shift angle in ° and the direction left or right. | |||
* Key phasor | * '''Rotation indicator:''' | ||
:-'''Counter-Clockwise:''' defines a counter-clockwise rotation. | |||
* Rotation indicator | :-'''Clockwise:''' defines a clockwise rotation. | ||
====Waterfall graphs (2D view, 3D view, color spectrum)==== | =====Waterfall graphs (2D view, 3D view, color spectrum)===== | ||
====Slices sorting selection in 2D/3D==== | =====Slices sorting selection in 2D/3D===== | ||
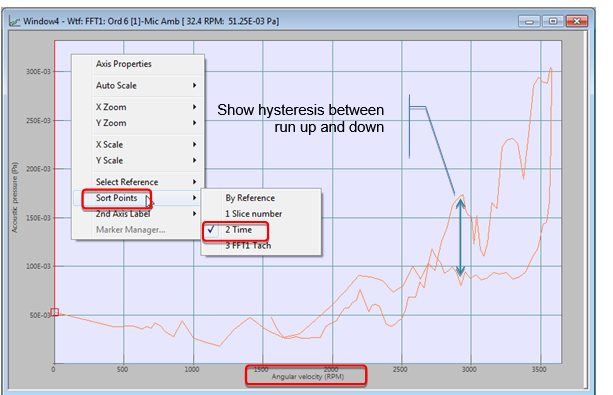
NVGate is able to display unwrapped run-up/down profiles The "Sort points" selection allows displaying the data along one X scale but sort it along another reference. | NVGate is able to display unwrapped run-up/down profiles The "Sort points" selection allows displaying the data along one X scale but sort it along another reference. | ||
| Line 1,003: | Line 613: | ||
This is useful for mixed run up/down to see hysteresis. | This is useful for mixed run up/down to see hysteresis. | ||
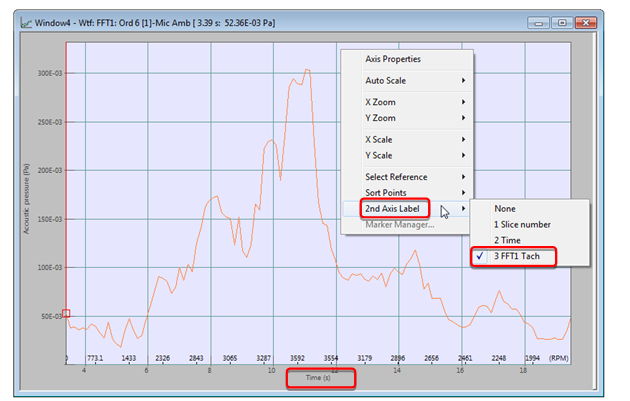
====Second X axis in profiles==== | =====Second X axis in profiles===== | ||
[[Image:V10_release_30.png|framed|none]] | [[Image:V10_release_30.png|framed|none]] | ||
| Line 1,021: | Line 631: | ||
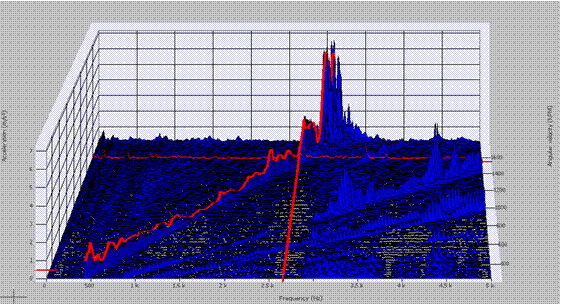
The X-axis is the frequency. | The X-axis is the frequency. | ||
=====Tachometer centered on FFT/SOA blocks===== | ======Tachometer centered on FFT/SOA blocks====== | ||
This allows centering tachometer speed at the center of the FFT/SOA trigger block(s). It is useful with long trigger blocks (High resolution analyses) to perfectly match the actual data with the order cursor or section. | This allows centering tachometer speed at the center of the FFT/SOA trigger block(s). It is useful with long trigger blocks (High resolution analyses) to perfectly match the actual data with the order cursor or section. | ||
| Line 1,077: | Line 687: | ||
---- | ---- | ||
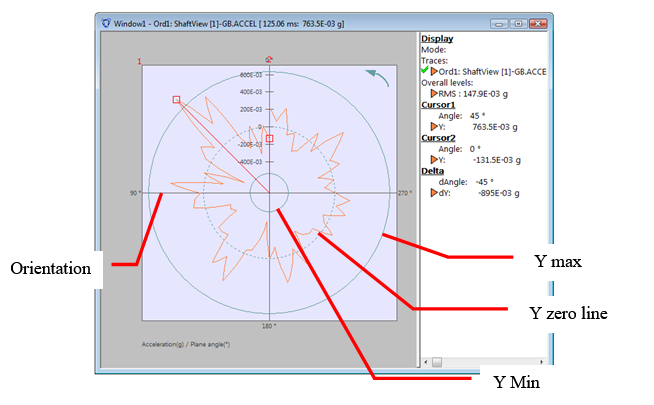
====Orbit==== | =====Orbit===== | ||
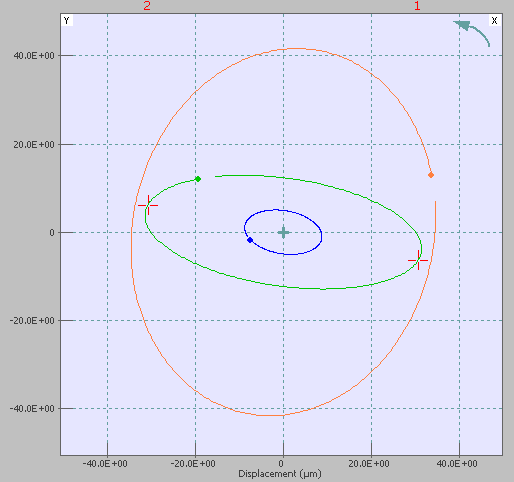
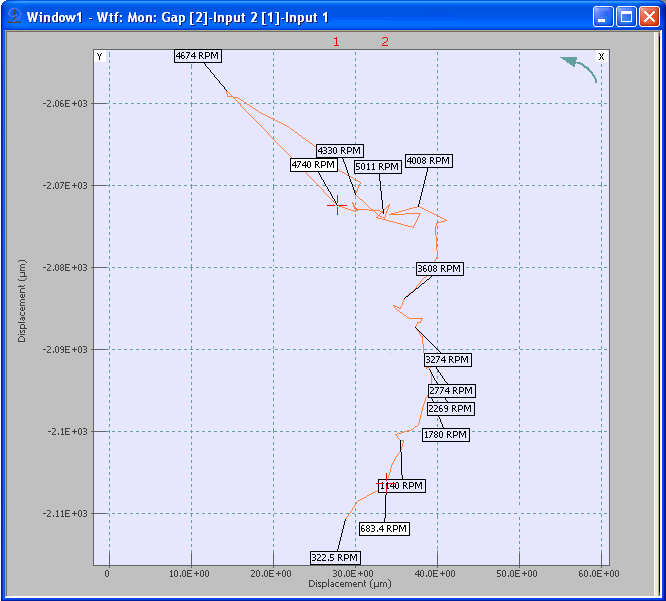
Displays the AC dynamic motion of the center of a rotating shaft. It generates a two-dimensional image. | Displays the AC dynamic motion of the center of a rotating shaft. It generates a two-dimensional image. | ||
'''Source Signals'''<br> | |||
The following results may be displayed as Orbit graphs on condition that a tachometer is associated to the plug-ins: | The following results may be displayed as Orbit graphs on condition that a tachometer is associated to the plug-ins: | ||
| Line 1,103: | Line 713: | ||
The display of the Synthesized Orbit is done on 360 points (1 point per degree). | The display of the Synthesized Orbit is done on 360 points (1 point per degree). | ||
'''Properties'''<br> | |||
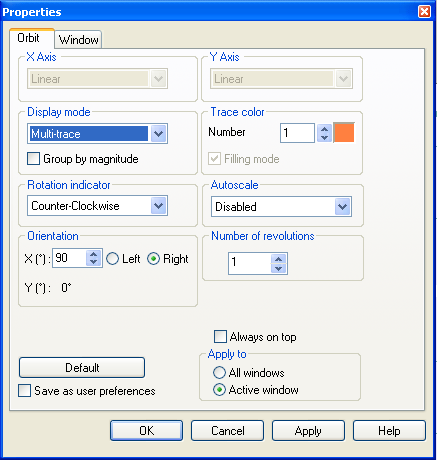
[[Image:Display_Graphs_Traces_123.png|framed|none]] | [[Image:Display_Graphs_Traces_123.png|framed|none]] | ||
* X Axis | * '''X Axis:''' | ||
:-'''Linear:''' uses linear scale for X-axis units. | |||
* Y Axis | * '''Y Axis:''' | ||
:-'''Linear:''' uses linear scale for Y-axis units. | |||
* Display mode | * '''Display mode:''' | ||
:-'''Multi-graph:''' overlays all traces on a single graph. | |||
:-'''Multi-trace:''' displays all traces using one graph per trace in the same window. | |||
* Trace color | * '''Trace color:''' | ||
:-'''Number:''' selects the trace number for color modification. | |||
:-'''Color box:''' click on this box to modify the color of the selected trace. | |||
:-'''Filling mode:''' if selected, all the curves of the windows are filled from: | |||
::the bottom of the area if Y scale is dB or Logarithmic, | |||
::the 0 value if the Y scale is linear. | |||
* Rotation indicator | * '''Rotation indicator:''' | ||
:-'''Counter-Clockwise:''' defines a counter-clockwise rotation | |||
:-'''Clockwise:''' defines a clockwise rotation. | |||
* Autoscale | * '''Autoscale:''' | ||
:-'''Continuous:''' applies a continuous autoscale during the measurement. | |||
:-'''Disabled:''' disable the autoscale. | |||
* Orientation | * '''Orientation:''' Allows to shift X-axis and Y-axis from a defined angle to the left or to the right; X and Y are nevertheless always orthogonal. | ||
* '''Number of revolutions:''' Number of revolution displayed in the graph. | |||
* Number of revolutions | |||
====Gap==== | =====Gap===== | ||
Displays the shaft center DC position changes. | Displays the shaft center DC position changes. | ||
'''Source Signals'''<br> | |||
The following results may be displayed as Gap graphs: | The following results may be displayed as Gap graphs: | ||
| Line 1,143: | Line 751: | ||
[[Image:Display_Graphs_Traces_124.png|framed|none]] | [[Image:Display_Graphs_Traces_124.png|framed|none]] | ||
'''Properties'''<br> | |||
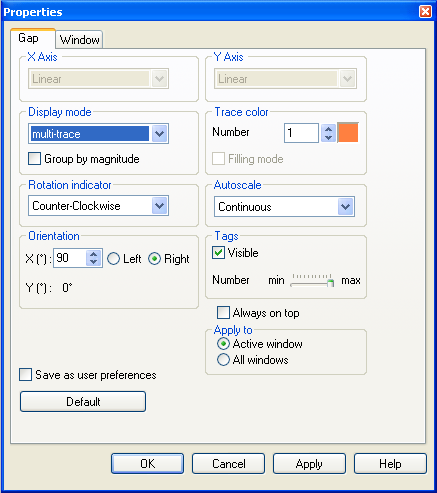
[[Image:Display_Graphs_Traces_125.png|framed|none]] | |||
* '''X Axis:''' | |||
:-'''Linear:''' uses linear scale for X-axis units. | |||
* '''Y Axis:''' | |||
:-'''Linear:''' uses linear scale for Y-axis units. | |||
* '''Display mode:''' | |||
:-'''Multi-graph:''' overlays all traces on a single graph. | |||
:-'''Multi-trace:''' displays all traces using one graph per trace in the same window. | |||
* '''Trace color:''' | |||
:-'''Number:''' selects the trace number for color modification. | |||
:-'''Color box:''' click on this box to modify the color of the selected trace. | |||
:-'''Filling mode:''' if selected, all the curves of the windows are filled from: | |||
::the bottom of the area if Y scale is dB or Logarithmic, | |||
::the 0 value if the Y scale is linear. | |||
* '''Rotation indicator:''' | |||
:-'''Counter-Clockwise:''' defines a counter-clockwise rotation. | |||
:-'''Clockwise:''' defines a clockwise rotation. | |||
* '''Autoscale:''' | |||
:-'''Continuous:''' applies a continuous autoscale during the measurement. | |||
:-'''Disabled:''' disable the autoscale. | |||
* '''Orientation:''' Allows to shift X-axis and Y-axis from a defined angle to the left or to the right; X and Y are nevertheless always orthogonal. | |||
* '''Tags:''' | |||
:-'''Visible:''' Tags are visible on the graph. | |||
:-'''Number:''' defines the tags density on the plot (min or max). | |||
====Contextual menu==== | |||
The Graph contextual menu is accessible by right clicking on the graph. | |||
=====Axis properties===== | |||
The axis values and behavior can be set in the ''Axis properties'' dialog box. | |||
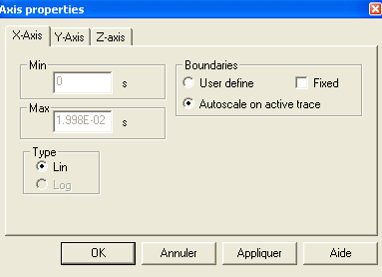
[[Image:Display_Graphs_Traces_126.png|framed|none]] | |||
* '''Min: '''Enabled only when the ''User Define'' type is selected. It sets the minimum value assigned to the scale.<br> | |||
* '''Max: '''Enabled only when the ''User define'' type is selected. It sets the maximum value assigned to the scale.<br> | |||
* '''Boundaries:''' | |||
:- '''User Define''': Used to select the min and max scale values. | |||
:- '''Autoscale on active trace''': The minimum and maximum scale values are automatically adjusted to the values of the active trace. | |||
:- '''Autoscale on all traces''': The minimum and maximum scale values are automatically adjusted so that every trace is fully visible. | |||
* '''Type''': Changes the type of scale (Linear, logarithmic or dB). Only the available types are enabled. | |||
* '''Enable/disable zoom''': when checked, it is impossible to make any change to the scale. | |||
=====Zoom===== | |||
'''X zoom'''<br> | |||
All of these functions are available if there is no active X automatic autoscale. | |||
* '''Zoom in: '''Zoom in on the horizontal scale by placing the cursor position in the center. If the center is at the minimum value, you may not zoom. You may zoom if the X scale width is greater than the active signal precision in X. | |||
* '''Zoom out:''' Zoom out from the horizontal scale by placing the cursor position in the center. If the center is at the minimum value, you may not zoom. You may zoom if Z min and max values are included in the min and max value gap defined by the active signal of the window. | |||
* '''Full width:''' Restores the X min and max values defined by the active signal of the window. | |||
* '''Auto-scale:''' Set min and max values of the X scale to the X min and max values of the active signal for the "On active" item and to the X min and max values of all signals of the window for "On all" item. A margin is added to these values to facilitate visibility. The X width is always more than X active signal precision. | |||
'''Y zoom'''<br> | |||
* '''Zoom in:''' Used to zoom in on the vertical scale. You may zoom in if the scale width is greater than the active signal precision in Y. | |||
* '''Zoom out:''' Used to zoom out from the vertical scale. You may zoom in if min and max values are included in Y min and max value gap defined by the active signal of the window. | |||
* '''Full width:''' Restores the Y min and max values defined by the active signal of the window. | |||
* '''Auto-scale:''' Sets min and max values of the Y scale to the Y min and max values of the active signal for the "On active" item and to the min and max values of all signals of the window for "On all" item. A margin is added to these values to facilitate visibility. The Y width is always more than Y active signal precision. | |||
'''Z zoom'''<br> | |||
All of these functions are available if there is no active X automatic autoscale. | |||
* '''Zoom in:''' Used to zoom in on the Z scale. You may zoom if the scale width is greater than the active signal precision in Z. | |||
* '''Zoom out:''' Used to zoom out from the Z scale. You may zoom if min and max values are included in Z min and max value gap defined by the active signal of the window. | |||
* '''Full width:''' Restores the Z min and max values defined by the active signal of the window. | |||
* '''Auto-scale''': Sets min and max values of the Z scale to the Z min and max values of the active signal. A margin is added to these values to facilitate visibility. The Y width is always greater than Y active signal precision. | |||
=====Scale===== | |||
'''X scale:''' Changes X scale type of the area to the selected type. Available types (according to the kind of the area) are: | |||
* Linear | |||
* Logarithmic | |||
'''Y scale:''' Changes Y scale type of the area to the selected type. Available types (according to the kinds of the area and the window) are: | |||
* Linear | |||
* Logarithmic | |||
* DB | |||
'''Z scale:''' Changes Z scale type of the area to the selected type. Available types (according to the kinds of the area and the window) are: | |||
* Linear | |||
* Logarithmic | |||
* dB | |||
=====Marker manager===== | |||
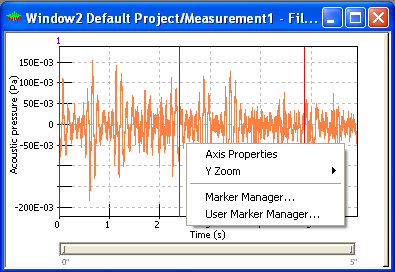
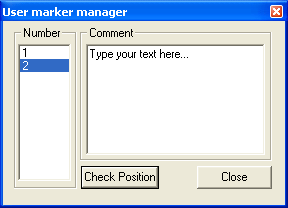
This dialog is only available for the Monitoring and Compressed windows. It contains the list of all record markers of the record signal opened. In the monitoring window, each record marker comment can be modified. In the compressed window, comments cannot be modified. | |||
[[Image:Display_Graphs_Traces_26.png|400px|left]] [[Image:Display_Graphs_Traces_27.png|300px|none]] <br><br><br><br> | |||
=====Reset Min & Max===== | |||
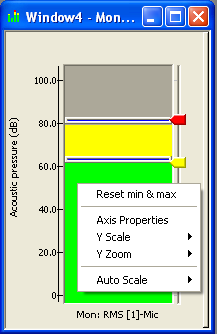
Restores min and max values for the selected scale | |||
[[Image:Display_Graphs_Traces_28.png|framed|none]] | |||
===Window=== | |||
====Contextual menu==== | |||
The window contextual menu is accessible by right clicking on the part around the graph. | |||
=====Display===== | |||
In each window, several display modes are available, depending on the graph type. | |||
{|class="wikitable" style="background:white" |border="2" cellspacing="0" cellpadding="4" width="40%" align="center" | |||
|'''Graph type ''' | |||
|'''Display mode''' | |||
|- | |||
|Time signal | |||
|Multi-trace<br>Multi-graph<br>Time multi-trace 3D | |||
|- | |||
|Spectral | |||
|Magnitude<br>Phase Real part<br>Imaginary part<br>Magnitude/Phase<br>Real/Imaginary<br>Polar Real part 3D<br>Imaginary part 3D<br>Magnitude 3D<br>Phase 3D<br>Real part multi-graph <br>Imaginary part multi-graph<br>Magnitude multi-graph<br>Phase multi-graph <br>Merged magnitude/phase | |||
|- | |||
|Nth Octave | |||
|Multi-trace<br>Multi-graph | |||
|- | |||
|Viewmeter/Monitoring | |||
|Continuous<br>Viewmeter<br>Brick<br>Digital<br>Digital magnitude & phase | |||
|- | |||
|Waterfall | |||
|Magnitude<br>Phase<br>Real part<br>Imaginary part | |||
|- | |||
|Monitoring/Compressed signal | |||
|Multi-graph (Only one mode available) | |||
|- | |||
|Profile | |||
|Multi-trace<br>Multi-graph | |||
|- | |||
|Complex profile | |||
|Magnitude<br>Phase Real part<br>Imaginary part<br>Magnitude/Phase<br>Real/Imaginary<br>Real part multi-graph<br>Imaginary part multi-graph<br>Magnitude multi-graph<br>Phase multi-graph <br>Merged magnitude/phase | |||
|- | |||
|Lissajoux | |||
|Multi-trace (Only one mode available) | |||
|- | |||
|Constant Band Tracking | |||
|Magnitude<br>Phase<br>Real part<br>Imaginary part<br>Magnitude/Phase<br>Real/Imaginary<br>Real part multi-graph<br>Imaginary part multi-graph<br>Magnitude multi-graph<br>Phase multi-graph <br>Merged magnitude/phase | |||
|}<br clear="all"> | |||
{|border="0" cellspacing="0" cellpadding="4" width="100%" align="center" | |||
|- | |||
|'''Multi-trace: ''' | |||
[[Image:Display_Graphs_Traces_29.png|300px|none]] | |||
|This mode displays all window traces of the same type in one graph. In several window types, two multi-trace graphs are displayed in the same window: for example, one for the Real part and one for the imaginary part. In this mode, a''' magnitude gathering mode''' can be activated in the set preferences window: this mode displays signals by creating one area for each Y magnitude included in the window. If two or more signals have the same Y magnitude, they will be displayed in the same area. | |||
<br><br> | |||
|- | |||
|'''Multi-graph: '''<br> | |||
[[Image:Display_Graphs_Traces_30.png|300px|none]] | |||
|This mode displays one graph per trace in the window. | |||
<br><br> | |||
|- | |||
|'''Multi-trace 3D: '''<br> | |||
[[Image:Display_Graphs_Traces_31.png|300px|none]] | |||
|This mode displays all traces in the same 3D graph. | |||
<br><br> | |||
|- | |||
|'''Real part: '''<br> | |||
[[Image:Display_Graphs_Traces_32.png|300px|none]] | |||
|This mode displays the real part of the signal. It can be displayed in multi-trace, multi graph, or multi-trace 3D, depending on the graph type. | |||
<br> | |||
|- | |||
|'''Imaginary part: '''<br> | |||
[[Image:Display_Graphs_Traces_33.png|300px|none]] | |||
|This mode displays the imaginary part of the signal. It can be displayed in multi-trace, multi graph, or multi-trace 3D, depending on the graph type. | |||
<br><br> | |||
|- | |||
|'''Magnitude: '''<br> | |||
[[Image:Display_Graphs_Traces_34.png|300px|none]] | |||
|This mode displays the magnitude of the signal. It can be displayed in multi-trace, multi graph, or multi-trace 3D, depending on the graph type. | |||
<br><br> | |||
|- | |||
|'''Phase: '''<br> | |||
[[Image:Display_Graphs_Traces_35.png|300px|none]] | |||
|This mode displays the phase of the signal. It can be displayed in multi-trace, multi graph, or multi-trace 3D, depending on the graph type. | |||
<br><br> | |||
|- | |||
|'''Merged magnitude/phase: '''<br> | |||
[[Image:Display_Graphs_Traces_36.png|300px|none]] | |||
|This mode displays the magnitude and the phase of the signal in the same area. This is a multi-trace mode. The module scale is on the left of the graph and the phase scale is on the right. | |||
|}<br clear="all"> | |||
=====Properties===== | =====Properties===== | ||
See "Graph type" topic p 37. | |||
* Always on top: the window will be on top | |||
* Default: reset the all the settings to the default settings | |||
* Apply to: applies the settings either to All windows or just for the Active window | |||
* Save as user preferences: save the properties settings | |||
=====Active trace===== | |||
Select the active trace of the window. When the signal changes, the Y scale is updated to the Y magnitude of the signal. Only signals with the same Y magnitude as the active signal are displayed. The others are displayed as unavailable in the info-trace. | |||
The color of the cursor corresponds with the trace<nowiki>’</nowiki>s color; you can select in the infotrace the active trace and its linked cursor using arrays of the keyboard. | |||
=====Remove trace===== | |||
Removes selected trace from the window. If this trace is the active one, the active signal is changed. A trace can be removed using <nowiki>’</nowiki>Ctrl suppr<nowiki>’</nowiki>. | |||
=====Memorize trace===== | |||
[[Image:Save group.png|framed|none]] | |||
Memorizes the active trace of the active window at any time (independently from Run and Stop event). | |||
The memorized trace is named ''Memx: active trace name. ''There<nowiki>’</nowiki>s an incrementation of the memorized traces id (x). You can save the memorized traces by adding it to the result selection. | |||
<font color="#FF0000"> | |||
[[Image:Display_Graphs_Traces_37.png|framed|none]] | |||
</font>'''Note''': you can memorize an active trace by using the insert button of the keyboard. | |||
=====Clear memory===== | |||
Clear all memorized traces. You can remove specific memorized traces with the <nowiki>’</nowiki>Remove trace<nowiki>’</nowiki> command. | |||
=====AutoMemorize===== | |||
[[Image:Display_Graphs_Traces_38.png|framed|none]] | |||
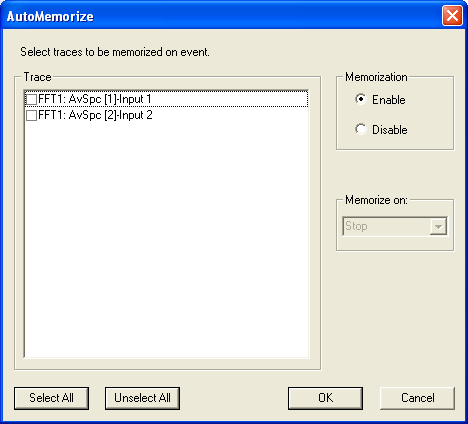
<nowiki>’</nowiki>AutoMemorize<nowiki>’</nowiki> traces consists in memorizing traces on the stop event. Select the graph to be memorized. | |||
By using an operator on an active trace and his associated memorized traces is available by right-clicking on the graphs and selecting <nowiki>’</nowiki>operators<nowiki>’</nowiki>. This operator will be automatically updated if a memorized trace is added or deleted (see also operators). | |||
During a multi-run, the average on automatic memorized trace is done automatically for each run, and the average trace is automatically updated. | |||
=====Auto scale Y on all===== | |||
Sets min and max values of the Y scale to the Y min and max values of all signals displayed in the graph. A margin is added to these values to facilitate visibility. The Y width is always more than Y active signal precision. | |||
=====Cascade view===== | |||
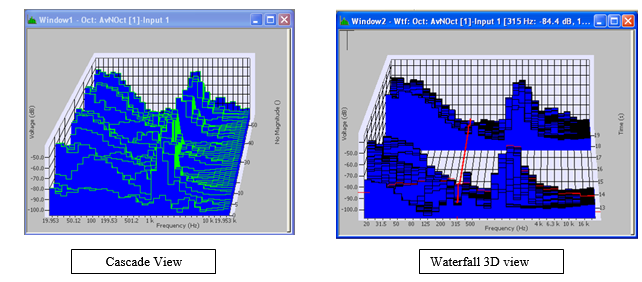
Present the current active trace in a cascade view of the last 50 (default value) recovered results. | |||
This is dedicated for monitoring used, this is not a waterfall (acquisition mode in real-time). The Z-axis represents the number of slices independently from any reference such as time or RPM evolution. | |||
This function is available only for 2D spectra and trigger blocks. | |||
'''Warning''': if you are in manual trigger, or if there is an absence in the time, you won<nowiki>’</nowiki>t be able to notice it with the cascade view. In the following example, a pause has been made during the measurement; on the waterfall 3Dview (with time for reference) it is possible to see this pause. In the cascade view the pause won<nowiki>’</nowiki>t be noticed (number of block for reference). | |||
[[Image:Display_Graphs_Traces_39.png|framed|none]] | |||
=====Weighting===== | |||
These commands are available only for results with an X-Axis that represents frequencies. The operations are performed in the spectral domain | |||
* '''None: '''No weighting is applied. | |||
* '''A Weighting: '''Selects the "A" weighting | |||
* '''More: '''Used to select specialized weighting | |||
<br>See more details about Weightings in [[NVGate_filter_formula_appendix|NVGate Filters]]. | |||
[[Image: | =====Add to Result selection===== | ||
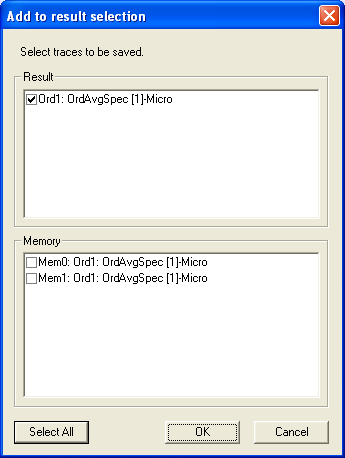
This command adds all the results displayed in the window to the list of results that must be saved in a measurement. If the result is already on the list, it is not added. Some results displayed cannot be saved (Instant trigger of the front end, profile of a DC input). | |||
=====Copy graph(s)===== | |||
This command copies the active graph in the format <nowiki>’</nowiki>wmf<nowiki>’</nowiki>, this command is not available for 3D Waterfall. | |||
=====Copy bitmap===== | |||
This command copies graph in the format <nowiki>’</nowiki>.bmp<nowiki>’</nowiki> | |||
=====Copy data===== | |||
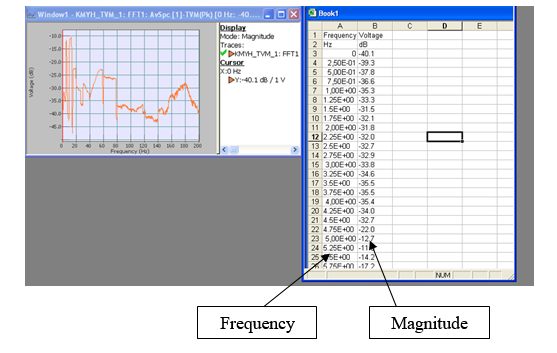
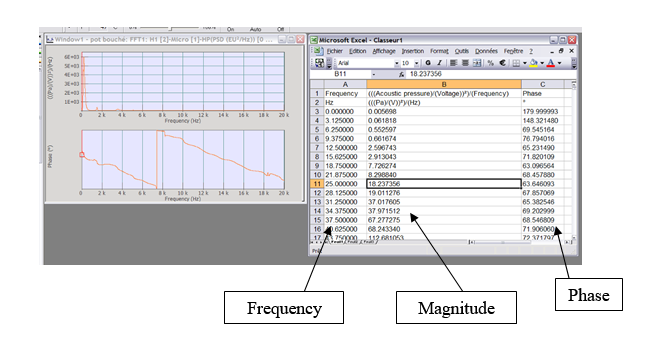
This command copies data in order to export them in Excel. This will export all point<nowiki>’</nowiki>s values from the active graph. NVGate export values with a point as separator and in engineer mode. This command is available for all spectra and profiles (even waterfall profiles). | |||
If the graph is displayed with complex values, then the <nowiki>’</nowiki>copy data<nowiki>’</nowiki> command allows to export phase and module values. | |||
Example: | |||
* Natural values: | |||
Values displayed are values from the Active trace: | |||
[[Image:Display_Graphs_Traces_63.png|framed|none]] | |||
* Complex values: | |||
For complex values the <nowiki>’</nowiki>Copy data<nowiki>’</nowiki> will displayed phase and module values. | |||
[[Image:Display_Graphs_Traces_64.png|framed|none]] | |||
=====Copy to Mask===== | |||
Adds the result to the project template results. This result is then available for editing and use as a template. | |||
=====Add Alarm===== | |||
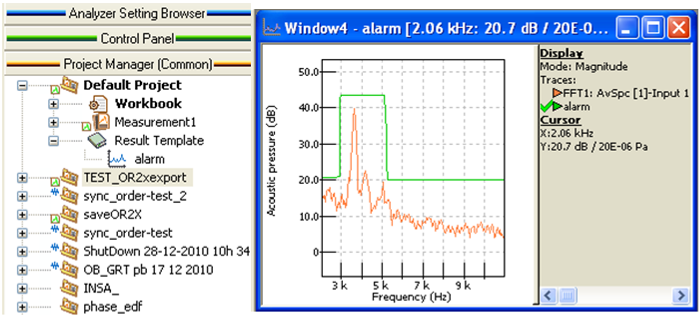
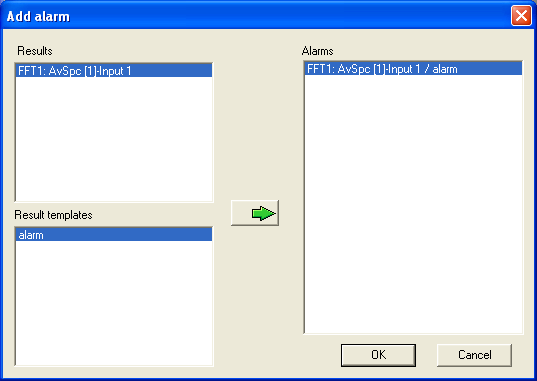
Dialog box to create an alarm. An alarm compares a dynamic signal with a template result. The result of the comparison can be used in the macro to perform certain tests. | |||
To make this option available, a result template must be added to the window (using drag & drop for example). | |||
[[Image:Display_Graphs_Traces_65.png|framed|none]] | |||
Go to the "Chapter 5: Tools" to see more details about the Result template. | |||
[[Image:Display_Graphs_Traces_66.png|framed|none]] | |||
[[Image:Display_Graphs_Traces_67.png|framed|none]] | |||
To create an alarm, select a result from the top list, a template from the bottom list and click the Add button. The list on the right displays a list of the existing alarms. | |||
===Pointer type=== | |||
The pointer type depends on the mode that is activated in the [[NVGate_Ribbons:_Display/Graph_Tab|Display Tab]]. | |||
{|border="0" cellspacing="0" cellpadding="4" width="100%" align="center" | |||
|- | |||
|[[Image:Display_Graphs_Traces_17.png|25px|none]] | |||
|'''Zoom:''' Displayed when the magnifying tool is selected: Used to select a rectangle in a graphic area, or to zoom in with a by left click and drag. | |||
|- | |||
|[[Image:Display_Graphs_Traces_18.png|25px|none]] | |||
|'''Cursor:''' Displayed when cursor mode is selected: Used to move the cursor by left clicking and dragging. | |||
|- | |||
|[[Image:Display_Graphs_Traces_19.png|25px|none]] | |||
|'''Move:''' Displayed when <nowiki>’</nowiki>move mode<nowiki>’</nowiki> is selected. Used to change x and y scale boundaries by left clicking and dragging. | |||
|- | |||
|[[Image:Display_Graphs_Traces_20.png|25px|none]] | |||
|'''Rotation:''' Displayed when the rotation tool is selected: Used to rotate a 3D graph. | |||
|- | |||
|[[Image:Display_Graphs_Traces_21.png|25px|none]] | |||
|'''Marker:''' Displayed when the marker mode is activated. Used to modify the marker position and properties. | |||
|- | |||
| | |||
|'''Scale scrolling''': Displayed when scale mode is selected and when the cursor is on a scale area.<br> | |||
[[Image:Display_Graphs_Traces_16.png|500px|none]] | |||
|}<br clear="all"> | |||
===Cursors=== | ===Cursors=== | ||
====Style==== | ====Style==== | ||
Revision as of 09:50, 14 January 2022
This section explains all the functions and information you can find in the graphs, windows and infotrace. It contains also the information relative to the scales, graphic modes, display modes and the contextual menus.
Different windows which contain one or more graphs or traces can be created using the Results dialog or the Add/remove window dialog. You can also add or remove some information in the Infotrace using the Infotrace properties. Manage all the display settings using the right click in almost any area. For each result type there are different available options using the right click.
The windows allow to display signal traces. They can contain several traces in the same graph (multi-trace display) or several graphs (multi-graph display). The windows can display 1D graphs (viewmeter, RPM monitoring), 2D graphs (profiles, signal recording) or 3D graphs such as Waterfall display.
Interface overview
Infotrace
The infotrace displays information about the graph:
- Graph mode: magnitude, real...
- List of traces with their states: available or not / displayed in all areas or not / not displayed. You can move into the infotrace to select a specified trace and to follow cursor’s value of this trace. Memorized traces are also displayed in the list (Memx)
- Overall levels: Displays the RMS level in 2D windows containing spectra or time signals.
- Cursor information: x, y, order, dx, dy if available
- Marker arrays: Using keyboard arrows, you can select the active trace in the infotrace.
Traces names
The traces names indicate accurately what signal is displayed. A trace label consists of:
| Item | Indicates | Example |
| File | Trace origin when it does not come from current analysis | Measurement A |
| Source | Trace origin when it does not come directly from a plug-in | Wtf, Mem02, Oper |
| Plug-in | The plug-in which calculated the trace | FFT 1, OCT |
| Results type | The type of result in the plug-in | AcgSpct, Coh, Trigger block |
| Channel | The channel in the plug-in | [3] |
| Label | The input Label | Acc. top |
| Section | The section in the Waterfall | Z= 2500 RPM, X=375 RPM |
| Unit/Weighting | Applied alteration | Pk-Pk, PSD, (A) |
| Time Date | Of the result | 15:50:14 03/10/15 |
In order to simplify the trace identifications in applications that manage many measurement points (structural dynamics, Roving impact hammer) the content of the front-end identification settings are inserted in the trace labels.
The trace labels display the Component, Node and Direction when the corresponding setting is different from its default value:
- Component = None
- Node = 0
- Direction = Scalar
This applies individually, setting by setting and is independent for each channel.
The infotrace contextual menu is accessible by right clicking on the infotrace.
Customize: From the Infotrace, right click and select Customize.
This dialog box is used to select the information to be displayed in the infotrace (cursor coordinates, marker values…).
All checked items are displayed, unchecked items are not displayed.
- Select All: Selects all items
- Unselect All: Unselects all items
- Ok: Applies the changes and closes the dialog box.
- Cancel: ignores the changes and closes the dialog box.
Auto width: Sets the Infotrace area width to the width of the largest element currently displayed.
Copy marker table: Copies the marker table content to the clipboard in Excel format, in order to paste it in Excel. Each column/line of the table becomes a column/line in the Excel sheet.
See the "Copy marker" topic p 101 for more details about the marker table copy.
Close: Hides the Infotrace area.
Graph
A graph displays computed traces. It can be multi-trace or multi-graph.
Graph type
Time
Time graphs display time real signals.
Source signals (plug-in/process)
The following results may be displayed as time graphs:
- Front-end: Signal.
- Monitor: Triggered block.
- FFT x: Triggered block, weighted block.
- SOA x: Triggered block, weighted block.
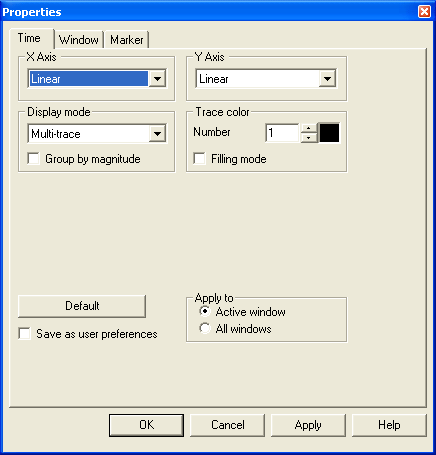
Properties
- X-Axis:
- -Linear: uses linear scale for X-axis units.
- Y-Axis:
- -Linear: uses linear scale for Y-axis units.
- -Logarithmic: uses logarithmic scale for Y-axis units.
- Display mode
- -Multi-graph: overlays all traces using one graph per trace on the same window.
- -Multi-trace: overlays all traces in one graph.
- -Multi-trace 3D: overlays all traces in one 3D graph.
- -Magnitude gathering: if this mode is activated and when a multi-trace mode is selected, an area is created for each different Y magnitude: all the signals with the same Y magnitude are in the same area. If there is only one different Y magnitude, all the signals are in the same area.
- Trace color
- -Number: selects the trace number for color modification.
- -Color box: click on this box to modify the color of the selected trace.
- -Filling mode: if selected, all the curves of the windows are filled from:
- The bottom of the area if Y scale is a dB one or Logarithmic one,
- The 0 value if the Y scale is linear.
Spectral
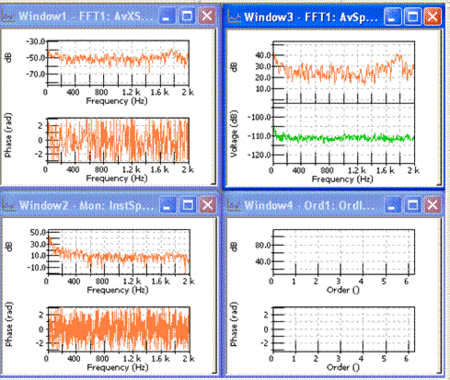
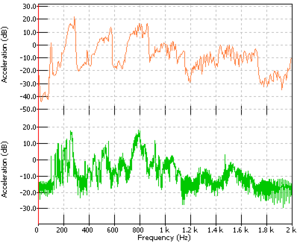
Spectral graphs display narrow band (complex) spectra.
Source Signals
The following results may be displayed as spectral graphs:
- Monitor: Inst. spectrum, Avg spectrum.
- FFT x: Inst. spectrum, Avg spectrum, Inst cross-spectrum, Avg cross-spectrum, FRF H1, FRF H2, spectrum.
- Sync. order x: Ord. inst. spectrum, Ord. avg. spectrum, Ord. spectrum.
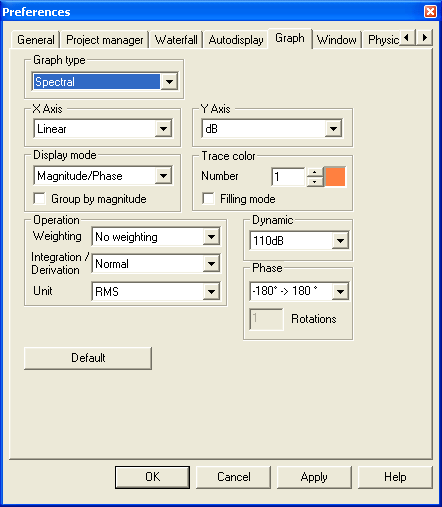
Properties
- X Axis:
- -Linear: uses linear scale for X-axis units.
- -Logarithmic: uses logarithmic scale for X-axis units.
- Y Axis:
- -Linear: uses linear scale for Y-axis units.
- -Logarithmic: uses logarithmic scale for Y-axis units.
- dB: uses reference dB scale for Y-axis units.
- Display mode
- -Magnitude: overlays all magnitude traces on a single graph.
- -Phase: overlays all phase traces on a single graph.
- -Real part: overlays all real parts traces on a single graph.
- -Imaginary part: overlays all imaginary part traces on a single graph.
- -Magnitude/phase: overlays all magnitude traces on the upper graph and all the phase traces on the lower graph.
- -Real/imaginary: overlays all magnitude traces on the upper graph and all the phase traces on the lower graph.
- -Polar: overlays all complex traces on a polar graph: = magnitude, = phase.
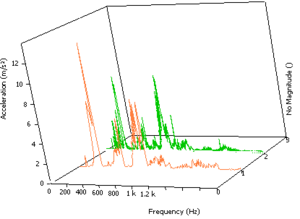
- -Real part 3D: displays all real part traces as a 3D graph arranged along the Z-axis.
- -Imaginary part 3D: displays all imaginary part traces as a 3D graph arranged along the Z-axis.
- -Magnitude 3D: displays all magnitude traces as a 3D graph arranged along the Z-axis.
- -Phase 3D: displays all phase traces as a 3D graph arranged along the Z-axis.
- -Real part multi-graph: displays all real part traces using one graph per trace in the same window.
- -Imaginary part multi-graph: displays all imaginary part traces using one graph per trace in the same window.
- -Magnitude multi-graph: displays all magnitude traces using one graph per trace in the same window.
- -Phase multi-graph: displays all phase traces using one graph per trace in the same window.
- -Phase/Magnitude: overlays all phase traces on the upper graph using 1/3 of window space and all the magnitude traces on the lower graph using 2/3 of the window.
- -Merged Magnitude/Phase: displays all magnitude and phase part traces as a unique graph.
- -Magnitude gathering: if this mode is activated and when a multi-trace mode is selected, an area is created for each different Y magnitude: all the signals with the same Y magnitude are in the same area. If there is only one different Y magnitude, all the signals are in the same area.
- Trace color:
- -Number: selects the trace number for color modification.
- -Color box: click on this box to modify the color of the selected trace.
- -Filling mode: if selected, all the curves of the windows are filled from:
- the bottom of the area if Y scale is a dB one or Logarithmic one,
- the 0 value of the Y scale is linear.
- Dynamics:
- -90 dB: resizes the Y-axis to 90 dB dynamics starting from +20 dBV.
- -110 dB: resizes the Y-axis to 110 dB dynamics starting from +20 dBV.
- -130 dB: resizes the Y-axis to 130 dB dynamics starting from +20 dBV.
- -150 dB: resizes the Y-axis to 150 dB dynamics starting from +20 dBV.
- Phase:
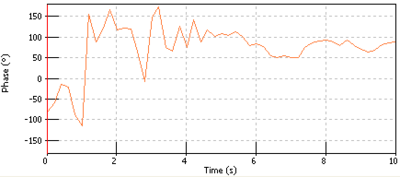
- - -180° -> 180°: sets the phase graph Y-axis between –180° to +180°.
- -0 -> 360°: sets the phase graph Y-axis between 0 to +360°.
- Rotations: sets the number of rotations to be displayed on the Y-axis.
Lissajous
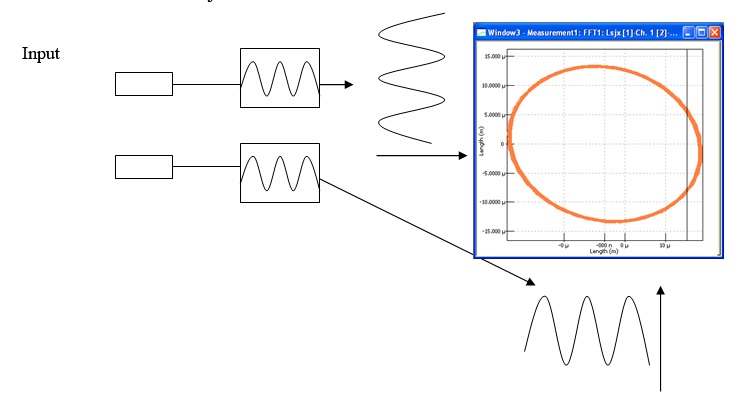
Parametric graph of one triggered block with another one for reference.
Source Signals
The following results may be displayed into Lissajous graphs:
- FFT x: Lissajous.
The perimeter of the Lissajous corresponds of the FFT length’s block.
You can use filters on this kind of graph, as integration or a double integration.
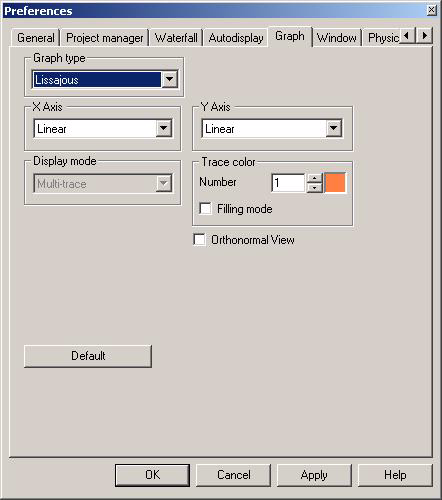
Properties
- X Axis:
- -Linear: uses linear scale for X-axis units.
- Y Axis:
- -Linear: uses linear scale for Y-axis units.
- Display mode:
- -Multi-trace: overlays all traces on a single graph.
- Trace color:
- -Number: selects the trace number for color modification.
- -Color box: click on this box to modify the color of the selected trace.
- -Orthonormal view: if checked, the graph is displayed in an orthonormal area.
Nth octave
Displays nth octave band graph.
Source Signals
The following results may be displayed as nth octave graphs:
- Nth-Octave: 1/n octave, Avg 1/n octave.
Properties
- Y Axis:
- -Linear: uses linear scale for Y-axis units.
- -Logarithmic: uses logarithmic scale for Y-axis units.
- -dB: uses reference dB scale for Y axis units.
- Display mode
- -Bar: bar representation
- -Step: step representation
- -Rectangle: overlaid rectangle
- -Filled: overlaid filled rectangles.
- Display mode
- -Multi-trace: overlays all traces on a single graph.
- -Multi-graph: one graph for each trace.
- -Magnitude gathering: if this mode is activated and when a multi-trace mode is selected, an area is created for each different Y magnitude: all the signals with the same Y magnitude are in the same area. If there is only one different Y magnitude, all the signals are in the same area.
- Trace color
- -Number: selects the trace number for color modification.
- -Color box: click on this box to modify the color of the selected trace.
- Overall level
- -Linear: if checked, the linear global level is displayed.
- -Weighted: if checked and available, the weighted level is displayed.
- Frequencies:
- -Exact: displays exact band center frequency.
- -Preferred: displays preferred frequencies, i.e rounded values for the central frequencies. Preferred frequencies are only available for octave and 1/3rd octave windows: in the octave. If this mode is selected in 12th and 24th octave windows, exact frequencies are displayed.
- Dynamics:
- -90 dB: resizes the Y-axis to 90 dB dynamics starting from +20 dBV.
- -110 dB: resizes the Y-axis to 110 dB dynamics starting from +20 dBV.
- -130 dB: resizes the Y-axis to 130 dB dynamics starting from +20 dBV.
- -150 dB: resizes the Y-axis to 150 dB dynamics starting from +20 dBV.
Viewmeter
Displays scalar value graphs.
Source Signals
The following results may be displayed as nth viewmeter graphs:
- Front-end: DC.
- Monitor: DC, Max, Min, Kurtosis.
- Recorder: RMS
- FFT X: Order & Overall
- SOA X: Order & Overall
- 1/n Octave: Overall values
- Tachometer: Angular speed
Properties
This page defines the way in which the scalar results are displayed.
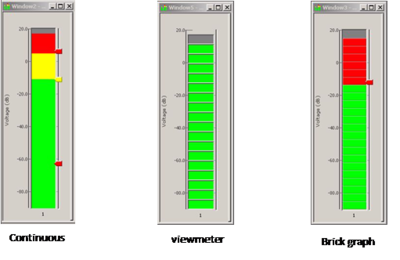
- Display mode: There are two types of display:
- -Bar graph:
- -Digital display
- Y Axis:
- -Linear: uses linear scale for Y-axis units.
- -Logarithmic: uses logarithmic scale for Y-axis units.
- -dB: uses reference dB scale for Y-axis units.
- Display max, Display min: Displays the min and the max scalar value as a cursor. The color of the cursor can be freely selected. This property only applies to bar graphs.
- Display low level: Changes the color of the display when the value is below this level. The color can be freely selected.
- Display high level: Changes the color of the display when the value is higher than this level. The color can be freely selected.
- Display alarm level: Changes the color of the display when the value is higher than this level. The color can be freely selected.
- Brick height: Defines the height of the bricks for the viewmeter and brick display modes.
- Save as user preference: When this box is checked, the value is given as a percentage of the full scale, and may be applied to any graph.
Monitoring
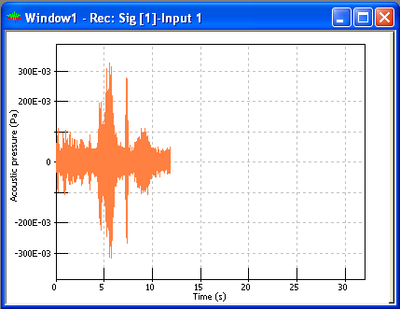
Displays compressed signal graph during recording.
Source Signals
The following results may be displayed as nth monitoring graphs:
- Recorder: monitoring signal
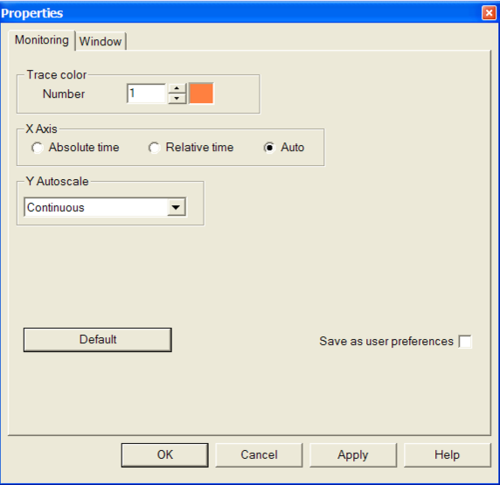
Properties
- Trace color
- -Number: selects the trace number for color modification.
- -Color box: click on this box to modify the color of the selected trace.
- X Axis
- -Absolute time: displays the time from windows format.
- -Relative time: displays the duration of the record. The beginning of the record is set to 0.
- -Auto: selects absolute or relative time depending on the duration of the record. For records smaller than 2s, the relative time is displayed, for others, the absolute time is chosen.
- Y Autoscale:
- -Continuous: the Y scale is automatically adjusted to the current min and max y values of the window traces with a margin to facilitate visibility.
- -Disabled: Y autoscale is not activated.
Compressed signal
Displays compressed recorded signal graphs.
Source Signals
The following results may be displayed as nth compressed signal graphs:
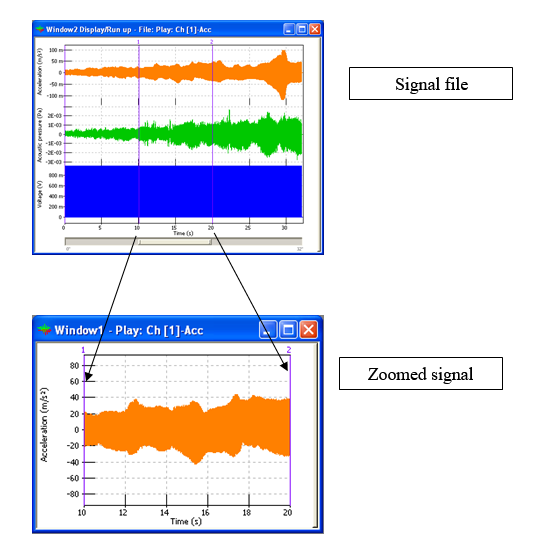
- Zoomed signal
This kind of zoom can be done by ’drag & drop’ the selected zone you want to analyze.
After displaying the zoomed signal, on the recorded signal you can modify your zoom at any time. All changes would be displayed automatically in the zoomed signal as soon as you modified your zoomed zone.
Check record
Check record function is for verifying the signal data in details just after its acquisition. When NVGate records a signal, the save window proposes to display the zoom signal view of the saved measurement. The signal is displayed after closing the window with OK.
It is then possible to:
- Zoom into the signal by drag & dropping on the graph
- Listen to the tracks through the PC loudspeaker by clicking on the loudspeaker icon. Select the listened track with the up/down arrows.
Properties
- Trace color
- - Number: selects the trace number for color modification.
- - Color box: click on this box to modify the color of the selected trace.
- X Axis
- - Absolute time: displays the time from windows format.
- - Relative time: displays the duration of the record. The beginning of the record is set to 0.
- - Auto: selects absolute or relative time depending on the duration of the record. For records smaller than 2s, the relative time is displayed, for others, the absolute time is chosen.
Profile
Displays scalar profile.
Source Signals
The following results may be displayed as nth compressed signal graphs:
- Monitor: DC, Max, Min, Kurtosis
Front-end: DC
- Tachometer: RPM
Properties
- X Axis:
- -Linear: uses linear scale for X-axis units.
- Y Axis
- -Linear: uses linear scale for Y-axis units.
- Display mode
- -Magnitude: overlays all magnitude traces on a single graph.
- -Phase: overlays all phase traces on a single graph.
- -Magnitude gathering: if this mode is activated and when a multi-trace mode is selected, an area is created for each different Y magnitude: all the signals with the same Y magnitude are in the same area. If there is only one different Y magnitude, all the signals are in the same area.
- Trace color
- -Number: selects the trace number for color modification.
- -Color box: click on this box to modify the color of the selected trace.
- -Filling mode: if selected, all the curves of the windows are filled from:
- the bottom of the area if Y scale is dB or Logarithmic,
- the 0 value if the Y scale is linear.
- X Autoscale:
- -Continuous: the X scale is automatically adjusted to the current min and max x values of the window traces.
- -Disabled: X autoscale is not activated.
- Y Autoscale
- -Continuous: the Y scale is automatically adjusted to the current min and max y values of the window traces with a margin to facilitate visibility.
- -Disabled: Y autoscale is not activated.
Complex profile
Source Signals
The following results may be displayed as complex profile graphs:
- FFT X: Order profile
- Waterfall: Order profile
- SOA X: Order profile
Properties
- X Axis:
- -Linear: uses linear scale for X-axis units.
- Y Axis:
- -Linear: uses linear scale for Y-axis units.
- -Logarithmic: uses logarithmic scale for Y-axis units.
- -dB: uses reference dB scale for Y axis units.
- Display mode:
- -Magnitude: overlays all magnitude traces on a single graph.
- -Phase: overlays all phase traces on a single graph.
- -Real part: overlays all real part traces on a single graph.
- -Imaginary part: overlays all imaginary part traces on a single graph.
- -Magnitude/phase: overlays all magnitude traces on the upper graph and all phase traces on the lower graph.
- -Real/imaginary: overlays all magnitude traces on the upper graph and all phase traces on the lower graph.
- -Polar: displays in polar coordinates, the phase and the amplitude on a single graph.
- -Real part multi-graph: displays all real part traces using one graph per trace in the same window.
- -Imaginary part multi-graph: displays all imaginary part traces using one graph per trace in the same window.
- -Magnitude multi-graph: displays all magnitude traces using one graph per trace in the same window.
- -Phase multi-graph: displays all phase traces using one graph per trace in the same window.
- -Phase/Magnitude: overlays all phase traces on the upper graph using 1/3 of window space and all the magnitude traces on the lower graph using 2/3 of the window.
- -Merged Magnitude/Phase: displays all magnitude and phase parts traces on a single graph.
- -Magnitude gathering: if this mode is activated and when a multi-trace mode is selected, an area is created for each different Y magnitude: all the signals with the same Y magnitude are in the same area. If there is only one different Y magnitude, all the signals are in the same area.
- Trace color:
- -Number: selects the trace number for color modification.
- -Color box: click on this box to modify the color of the selected trace.
- -Filling mode: if selected, all the curves of the windows are filled from:
- The 0 value if the Y scale is linear.
- Dynamics:
- -90 dB: resizes the Y-axis to 90 dB dynamics starting from +20 dBV.
- -110 dB: resizes the Y-axis to 110 dB dynamics starting from +20 dBV.
- -130 dB: resizes the Y-axis to 130 dB dynamics starting from +20 dBV.
- -150 dB: resizes the Y-axis to 150 dB dynamics starting from +20 dBV.
- Phase:
- --180° -> 180°: sets the phase graph Y-axis between –180° to +180°.
- -0 -> 360°: sets the phase graph Y-axis between 0 to +360°.
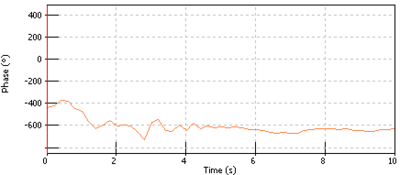
- -Rotations: sets the number of rotations to be displayed on the Y-axis. Example for 5 rotations:
- X Autoscale:
- -Continuous: the X scale is automatically adjusted to the current min and max x values of the window traces.
- -Disabled: X autoscale is not activated.
- Y Autoscale:
- -Continuous: the Y scale is automatically adjusted to the current min and max y values of the window traces with a margin to facilitate visibility.
- -Disabled: Y autoscale is not activated.
Coherence
Displays coherence graphs.
Source Signals:
The following results may be displayed as coherence graphs:
- FFT X: Coherence
Properties
- X Axis:
- Linear: uses linear scale for X-axis units.
- Y Axis:
- -Linear: uses linear scale for Y-axis units.
- Display mode:
- -Multi-graph: overlays all traces on a single graph.
- -Multi-trace: displays all traces using one graph per trace in the same window.
- -Time multi-trace 3D: overlays all traces on a single 3D graph.
- -Magnitude gathering: if this mode is activated and when a multi-trace mode is selected, an area is created for each different Y magnitude: all the signals with the same Y magnitude are in the same area. If there is only one different Y magnitude, all the signals are in the same area.
- Trace color:
- -Number: selects the trace number for color modification.
- -Color box: click on this box to modify the color of the selected trace.
- -Filling mode: if selected, all the curves of the windows are filled from:
- the bottom of the area if Y scale is dB or Logarithmic,
- the 0 value if the Y scale is linear.
Shaft View
The shaft view or "marguerite" shows the trigger block of FFTs and SOA around one revolution. This graph includes angular cursors (with delta-angle) useful for reading the location of peaks.
Note that in order to provide a stable trace, the corresponding plug-in must be triggered by a keyphasor. This keyphasor (any edge event) being the phase reference of each revolution. In the case of synchronous order analysis, the plug-in is automatically triggered on the tach. pulses.
The shaft view shows the first entire revolution contained in the trigger block. If less than one revolution is contained in the trigger block, nothing is displayed. A tachometer must be connect to the FFT or SOA plug-in in order to show traces in the shaft view.
The rotation indicator (and the angle labels arrangement 0 to 360°) is defined by the user’s preferences or directly from the window’s properties.
The keyphasor location is also user definable: It may take place every 45° along the complete revolution.
All graphs in a window have the same rotation and keyphasor location.
Source Signals
The following results may be displayed as Triggered Shaft View graphs on condition that a tachometer is associated to the plug-in:
- FFT x: Triggered Shaft View
- SOA x: Triggered Shaft View
The following results may be displayed as Average Shaft View graphs on condition that a tachometer is associated to the plug-in and that time average is chosen:
- FFT x: Average Shaft View
- SOA x: Average Shaft View
Properties
- X Axis:
- -Linear: uses linear scale for X-axis units.
- Y Axis:
- -Linear: uses linear scale for Y-axis units.
- Display mode:
- -Multi-graph: overlays all traces on a single graph.
- -Multi-trace: displays all traces using one graph per trace in the same window.
- Trace color:
- -Number: selects the trace number for color modification.
- -Color box: click on this box to modify the color of the selected trace.
- -Filling mode: if selected, all the curves of the windows are filled from:
- the 0 value if the Y scale is linear.
- Key phasor: Allows to specify the position of the key phasor by entering the shift angle in ° and the direction left or right.
- Rotation indicator:
- -Counter-Clockwise: defines a counter-clockwise rotation.
- -Clockwise: defines a clockwise rotation.
Waterfall graphs (2D view, 3D view, color spectrum)
Slices sorting selection in 2D/3D
NVGate is able to display unwrapped run-up/down profiles The "Sort points" selection allows displaying the data along one X scale but sort it along another reference.
The following example shows data displayed with tachometer speed on the X axis speed but sorted along to the time:
This is useful for mixed run up/down to see hysteresis.
Second X axis in profiles
For applications with mixed run-Up/Down (RPM, Torque, Temperature, etc...), it is useful to see the results evolution according to their occurrence (time, slice) but keeping the up/down information. This feature allows viewing the data unwrapped.
Waterfall display features different type of view of the stacked results. All views are related to the same 3D space:
The Z-axis is the selected reference (RPM, time or number of slices in order of the acquisition) its range is the waterfall depth. You can change the reference for z-axis at any time. This is available for 2D and 3D view.
The Y-axis is the selected magnitude; this can be changed at any time.
The X-axis is the frequency.
Tachometer centered on FFT/SOA blocks
This allows centering tachometer speed at the center of the FFT/SOA trigger block(s). It is useful with long trigger blocks (High resolution analyses) to perfectly match the actual data with the order cursor or section.
With classical tach:
The RPM is collected at the end of the analysis block.
This situation leads to an offset in the waterfall calculation of the orders (cursors, sections). For a run up, as the angular speed is over evaluated, the order calculation is lower than the actual ones.
With centered tach:
The RPM is calculated as the average speed during the block duration to be synchronized with the analyzed data.
With the centered tachometer, the orders calculations match more accurately the actual orders in waterfall.
The computation of the angular speed takes in account the averaging, triggering and overlap used in the plug-in.
The centered speed is calculated as:
The RPM centering and averaging is done in the analysis plug-in prior to be connected to the waterfall. To use the centered tach simply add the said tachometer to the corresponding plug-in (FFTn or SOAn). These additional tachometers are available in the waterfall as soon as one of the result of the plug-in is added to the waterfall.
1. Add Tach to the Plug-in,
2. Add plug-in results (Spectra, orders, etc..) to the waterfall,
3. Display the waterfall
4. Select the Plug-in Tach, as a tachometer and reference
display modes :
5. 3D isometric
6. 3D perspective:
7. Freq/Time Colormap:
8. Time/Freq Colormap:
Orbit
Displays the AC dynamic motion of the center of a rotating shaft. It generates a two-dimensional image.
Source Signals
The following results may be displayed as Orbit graphs on condition that a tachometer is associated to the plug-ins:
- FFT x: Raw Orbit, Synthetized Orbit ( for customer with FFT-diag option)
- SOA x: Raw Orbit, Synthetized Orbit (For customer with ORD-Diag option)
Note :
The Raw Orbit graph displays an entire number of complete rotations contained in one block. At least one rotation is required.
The FFT should better be triggered by the Ext. Sync. channel.
If the FFT is bad configured, it is possible that no results are shown.
The FFT synthtetized Orbit is only available for customer with FFt-CBT option.
The FFT synthetized Orbit is filtered using CBT technics. this method provide a non accurate phase value on synthetiseed orbit. For acurate synthetize Orbit phase, you need to use the SOA Synthetized Orbit.
The ORD Synthesized Orbit graph is calculated with the orders of two channels selected. For a couple "ChannelA, ChannelB" up to 8 Synthesized Orbits can be selected. Each orbit corresponds to an order which appears in the tracked order setting.
The display of the Synthesized Orbit is done on 360 points (1 point per degree).
Properties
- X Axis:
- -Linear: uses linear scale for X-axis units.
- Y Axis:
- -Linear: uses linear scale for Y-axis units.
- Display mode:
- -Multi-graph: overlays all traces on a single graph.
- -Multi-trace: displays all traces using one graph per trace in the same window.
- Trace color:
- -Number: selects the trace number for color modification.
- -Color box: click on this box to modify the color of the selected trace.
- -Filling mode: if selected, all the curves of the windows are filled from:
- the bottom of the area if Y scale is dB or Logarithmic,
- the 0 value if the Y scale is linear.
- Rotation indicator:
- -Counter-Clockwise: defines a counter-clockwise rotation
- -Clockwise: defines a clockwise rotation.
- Autoscale:
- -Continuous: applies a continuous autoscale during the measurement.
- -Disabled: disable the autoscale.
- Orientation: Allows to shift X-axis and Y-axis from a defined angle to the left or to the right; X and Y are nevertheless always orthogonal.
- Number of revolutions: Number of revolution displayed in the graph.
Gap
Displays the shaft center DC position changes.
Source Signals
The following results may be displayed as Gap graphs:
- Waterfall: Gap
The Gap is available in the Waterfall for the Monitor and Time domain analyzer plug-ins and only for the DC values.
Properties
- X Axis:
- -Linear: uses linear scale for X-axis units.
- Y Axis:
- -Linear: uses linear scale for Y-axis units.
- Display mode:
- -Multi-graph: overlays all traces on a single graph.
- -Multi-trace: displays all traces using one graph per trace in the same window.
- Trace color:
- -Number: selects the trace number for color modification.
- -Color box: click on this box to modify the color of the selected trace.
- -Filling mode: if selected, all the curves of the windows are filled from:
- the bottom of the area if Y scale is dB or Logarithmic,
- the 0 value if the Y scale is linear.
- Rotation indicator:
- -Counter-Clockwise: defines a counter-clockwise rotation.
- -Clockwise: defines a clockwise rotation.
- Autoscale:
- -Continuous: applies a continuous autoscale during the measurement.
- -Disabled: disable the autoscale.
- Orientation: Allows to shift X-axis and Y-axis from a defined angle to the left or to the right; X and Y are nevertheless always orthogonal.
- Tags:
- -Visible: Tags are visible on the graph.
- -Number: defines the tags density on the plot (min or max).
The Graph contextual menu is accessible by right clicking on the graph.
Axis properties
The axis values and behavior can be set in the Axis properties dialog box.
- Min: Enabled only when the User Define type is selected. It sets the minimum value assigned to the scale.
- Max: Enabled only when the User define type is selected. It sets the maximum value assigned to the scale.
- Boundaries:
- - User Define: Used to select the min and max scale values.
- - Autoscale on active trace: The minimum and maximum scale values are automatically adjusted to the values of the active trace.
- - Autoscale on all traces: The minimum and maximum scale values are automatically adjusted so that every trace is fully visible.
- Type: Changes the type of scale (Linear, logarithmic or dB). Only the available types are enabled.
- Enable/disable zoom: when checked, it is impossible to make any change to the scale.
Zoom
X zoom
All of these functions are available if there is no active X automatic autoscale.
- Zoom in: Zoom in on the horizontal scale by placing the cursor position in the center. If the center is at the minimum value, you may not zoom. You may zoom if the X scale width is greater than the active signal precision in X.
- Zoom out: Zoom out from the horizontal scale by placing the cursor position in the center. If the center is at the minimum value, you may not zoom. You may zoom if Z min and max values are included in the min and max value gap defined by the active signal of the window.
- Full width: Restores the X min and max values defined by the active signal of the window.
- Auto-scale: Set min and max values of the X scale to the X min and max values of the active signal for the "On active" item and to the X min and max values of all signals of the window for "On all" item. A margin is added to these values to facilitate visibility. The X width is always more than X active signal precision.
Y zoom
- Zoom in: Used to zoom in on the vertical scale. You may zoom in if the scale width is greater than the active signal precision in Y.
- Zoom out: Used to zoom out from the vertical scale. You may zoom in if min and max values are included in Y min and max value gap defined by the active signal of the window.
- Full width: Restores the Y min and max values defined by the active signal of the window.
- Auto-scale: Sets min and max values of the Y scale to the Y min and max values of the active signal for the "On active" item and to the min and max values of all signals of the window for "On all" item. A margin is added to these values to facilitate visibility. The Y width is always more than Y active signal precision.
Z zoom
All of these functions are available if there is no active X automatic autoscale.
- Zoom in: Used to zoom in on the Z scale. You may zoom if the scale width is greater than the active signal precision in Z.
- Zoom out: Used to zoom out from the Z scale. You may zoom if min and max values are included in Z min and max value gap defined by the active signal of the window.
- Full width: Restores the Z min and max values defined by the active signal of the window.
- Auto-scale: Sets min and max values of the Z scale to the Z min and max values of the active signal. A margin is added to these values to facilitate visibility. The Y width is always greater than Y active signal precision.
Scale
X scale: Changes X scale type of the area to the selected type. Available types (according to the kind of the area) are:
- Linear
- Logarithmic
Y scale: Changes Y scale type of the area to the selected type. Available types (according to the kinds of the area and the window) are:
- Linear
- Logarithmic
- DB
Z scale: Changes Z scale type of the area to the selected type. Available types (according to the kinds of the area and the window) are:
- Linear
- Logarithmic
- dB
Marker manager
This dialog is only available for the Monitoring and Compressed windows. It contains the list of all record markers of the record signal opened. In the monitoring window, each record marker comment can be modified. In the compressed window, comments cannot be modified.
Reset Min & Max
Restores min and max values for the selected scale
Window
The window contextual menu is accessible by right clicking on the part around the graph.
Display
In each window, several display modes are available, depending on the graph type.
| Graph type | Display mode |
| Time signal | Multi-trace Multi-graph Time multi-trace 3D |
| Spectral | Magnitude Phase Real part Imaginary part Magnitude/Phase Real/Imaginary Polar Real part 3D Imaginary part 3D Magnitude 3D Phase 3D Real part multi-graph Imaginary part multi-graph Magnitude multi-graph Phase multi-graph Merged magnitude/phase |
| Nth Octave | Multi-trace Multi-graph |
| Viewmeter/Monitoring | Continuous Viewmeter Brick Digital Digital magnitude & phase |
| Waterfall | Magnitude Phase Real part Imaginary part |
| Monitoring/Compressed signal | Multi-graph (Only one mode available) |
| Profile | Multi-trace Multi-graph |
| Complex profile | Magnitude Phase Real part Imaginary part Magnitude/Phase Real/Imaginary Real part multi-graph Imaginary part multi-graph Magnitude multi-graph Phase multi-graph Merged magnitude/phase |
| Lissajoux | Multi-trace (Only one mode available) |
| Constant Band Tracking | Magnitude Phase Real part Imaginary part Magnitude/Phase Real/Imaginary Real part multi-graph Imaginary part multi-graph Magnitude multi-graph Phase multi-graph Merged magnitude/phase |
| Multi-trace: | This mode displays all window traces of the same type in one graph. In several window types, two multi-trace graphs are displayed in the same window: for example, one for the Real part and one for the imaginary part. In this mode, a magnitude gathering mode can be activated in the set preferences window: this mode displays signals by creating one area for each Y magnitude included in the window. If two or more signals have the same Y magnitude, they will be displayed in the same area.
|
| Multi-graph: |
This mode displays one graph per trace in the window.
|
| Multi-trace 3D: |
This mode displays all traces in the same 3D graph.
|
| Real part: |
This mode displays the real part of the signal. It can be displayed in multi-trace, multi graph, or multi-trace 3D, depending on the graph type.
|
| Imaginary part: |
This mode displays the imaginary part of the signal. It can be displayed in multi-trace, multi graph, or multi-trace 3D, depending on the graph type.
|
| Magnitude: |
This mode displays the magnitude of the signal. It can be displayed in multi-trace, multi graph, or multi-trace 3D, depending on the graph type.
|
| Phase: |
This mode displays the phase of the signal. It can be displayed in multi-trace, multi graph, or multi-trace 3D, depending on the graph type.
|
| Merged magnitude/phase: |
This mode displays the magnitude and the phase of the signal in the same area. This is a multi-trace mode. The module scale is on the left of the graph and the phase scale is on the right.
|
Properties
See "Graph type" topic p 37.
- Always on top: the window will be on top
- Default: reset the all the settings to the default settings
- Apply to: applies the settings either to All windows or just for the Active window
- Save as user preferences: save the properties settings
Active trace
Select the active trace of the window. When the signal changes, the Y scale is updated to the Y magnitude of the signal. Only signals with the same Y magnitude as the active signal are displayed. The others are displayed as unavailable in the info-trace.
The color of the cursor corresponds with the trace’s color; you can select in the infotrace the active trace and its linked cursor using arrays of the keyboard.
Remove trace
Removes selected trace from the window. If this trace is the active one, the active signal is changed. A trace can be removed using ’Ctrl suppr’.
Memorize trace
Memorizes the active trace of the active window at any time (independently from Run and Stop event).
The memorized trace is named Memx: active trace name. There’s an incrementation of the memorized traces id (x). You can save the memorized traces by adding it to the result selection.
Note: you can memorize an active trace by using the insert button of the keyboard.
Clear memory
Clear all memorized traces. You can remove specific memorized traces with the ’Remove trace’ command.
AutoMemorize
’AutoMemorize’ traces consists in memorizing traces on the stop event. Select the graph to be memorized.
By using an operator on an active trace and his associated memorized traces is available by right-clicking on the graphs and selecting ’operators’. This operator will be automatically updated if a memorized trace is added or deleted (see also operators).
During a multi-run, the average on automatic memorized trace is done automatically for each run, and the average trace is automatically updated.
Auto scale Y on all
Sets min and max values of the Y scale to the Y min and max values of all signals displayed in the graph. A margin is added to these values to facilitate visibility. The Y width is always more than Y active signal precision.
Cascade view
Present the current active trace in a cascade view of the last 50 (default value) recovered results.
This is dedicated for monitoring used, this is not a waterfall (acquisition mode in real-time). The Z-axis represents the number of slices independently from any reference such as time or RPM evolution.
This function is available only for 2D spectra and trigger blocks.
Warning: if you are in manual trigger, or if there is an absence in the time, you won’t be able to notice it with the cascade view. In the following example, a pause has been made during the measurement; on the waterfall 3Dview (with time for reference) it is possible to see this pause. In the cascade view the pause won’t be noticed (number of block for reference).
Weighting
These commands are available only for results with an X-Axis that represents frequencies. The operations are performed in the spectral domain
- None: No weighting is applied.
- A Weighting: Selects the "A" weighting
- More: Used to select specialized weighting
See more details about Weightings in NVGate Filters.
Add to Result selection
This command adds all the results displayed in the window to the list of results that must be saved in a measurement. If the result is already on the list, it is not added. Some results displayed cannot be saved (Instant trigger of the front end, profile of a DC input).
Copy graph(s)
This command copies the active graph in the format ’wmf’, this command is not available for 3D Waterfall.
Copy bitmap
This command copies graph in the format ’.bmp’
Copy data
This command copies data in order to export them in Excel. This will export all point’s values from the active graph. NVGate export values with a point as separator and in engineer mode. This command is available for all spectra and profiles (even waterfall profiles).
If the graph is displayed with complex values, then the ’copy data’ command allows to export phase and module values.
Example:
- Natural values:
Values displayed are values from the Active trace:
- Complex values:
For complex values the ’Copy data’ will displayed phase and module values.
Copy to Mask
Adds the result to the project template results. This result is then available for editing and use as a template.
Add Alarm
Dialog box to create an alarm. An alarm compares a dynamic signal with a template result. The result of the comparison can be used in the macro to perform certain tests.
To make this option available, a result template must be added to the window (using drag & drop for example).
Go to the "Chapter 5: Tools" to see more details about the Result template.
To create an alarm, select a result from the top list, a template from the bottom list and click the Add button. The list on the right displays a list of the existing alarms.
Pointer type
The pointer type depends on the mode that is activated in the Display Tab.
| Zoom: Displayed when the magnifying tool is selected: Used to select a rectangle in a graphic area, or to zoom in with a by left click and drag. | |
| Cursor: Displayed when cursor mode is selected: Used to move the cursor by left clicking and dragging. | |
| Move: Displayed when ’move mode’ is selected. Used to change x and y scale boundaries by left clicking and dragging. | |
| Rotation: Displayed when the rotation tool is selected: Used to rotate a 3D graph. | |
| Marker: Displayed when the marker mode is activated. Used to modify the marker position and properties. | |
| Scale scrolling: Displayed when scale mode is selected and when the cursor is on a scale area. |
Cursors
Style
| Vertical line: |
Displays a single line. |
| Vertical dashed line: |
Displays a single dashed line. |
| Vertical with rectangle: |
A rectangle is displayed around the selected point. |
| Cross hair: |
No line is displayed but there is a target around the selected point. |
| Vertical + horizontal: |
Displays 2 lines, an horizontal and a vertical that cross the selected point. |
Dual
Select 2 cursors from the window properties. That allows to compute delta values on X-axis and Y-axis.
Cursor Link
Link the cursors of different graphs that share the same unit on the X-Axis. Once linked, all the cursors move at the same time and the same position.
Link all cursors in one click
Cursors can be linked one by one to follow the same X-coordinate. It is now possible to link/unlink from the cursor contextual menu.
This applies to the link by reference and covers all the cursors of the current layout.
Waterfall link
- Link: Link the cursor of different graphs that share the same unit on the X-Axis. Once linked, all the cursor moved at the same time and the same position.
- Link by reference: Link the cursor of several Waterfalls referring to their internal index. Enables linking cursors that are displayed in graphs that do not share the same unit.
- Free: Release a cursor that has been previously linked.

